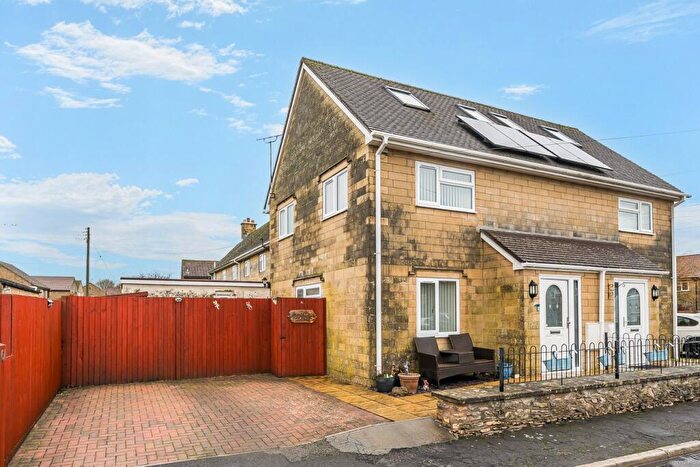
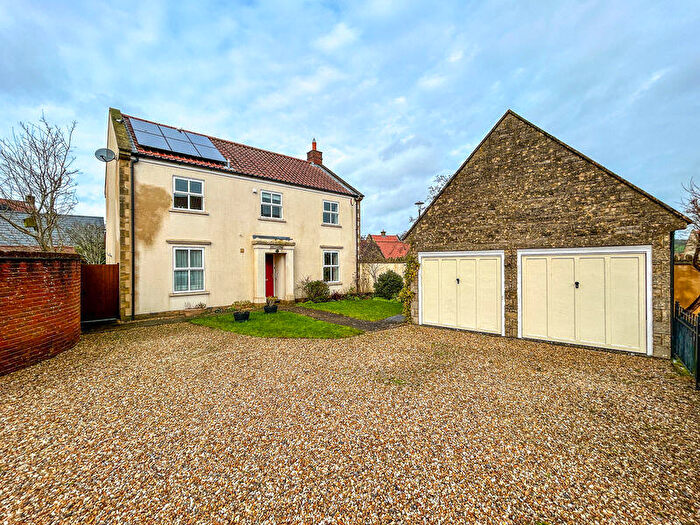
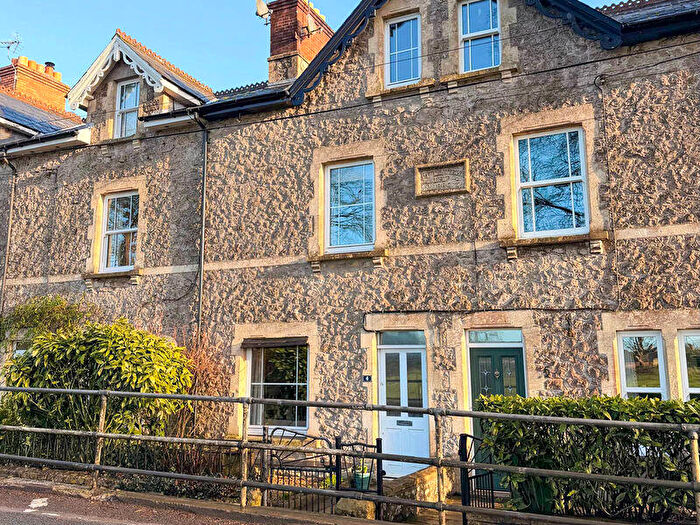
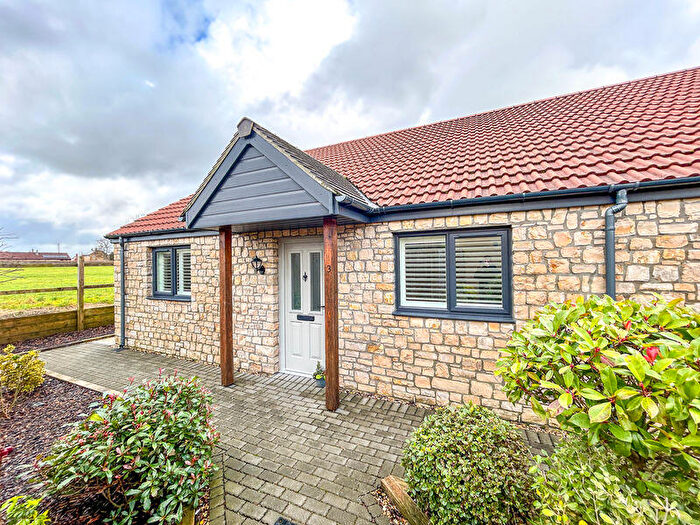
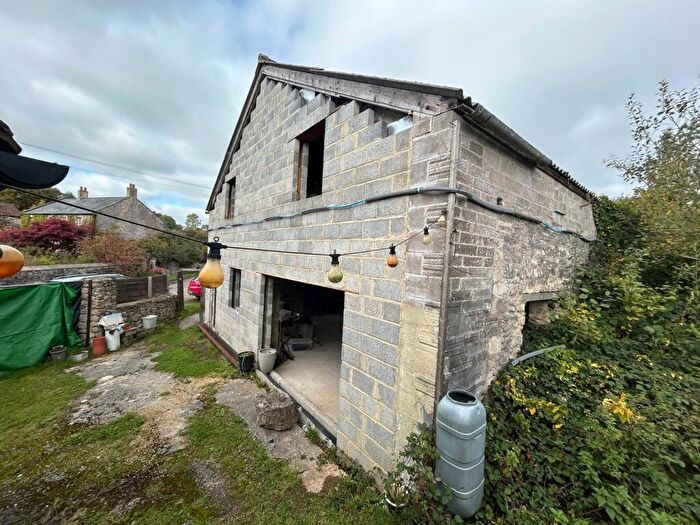
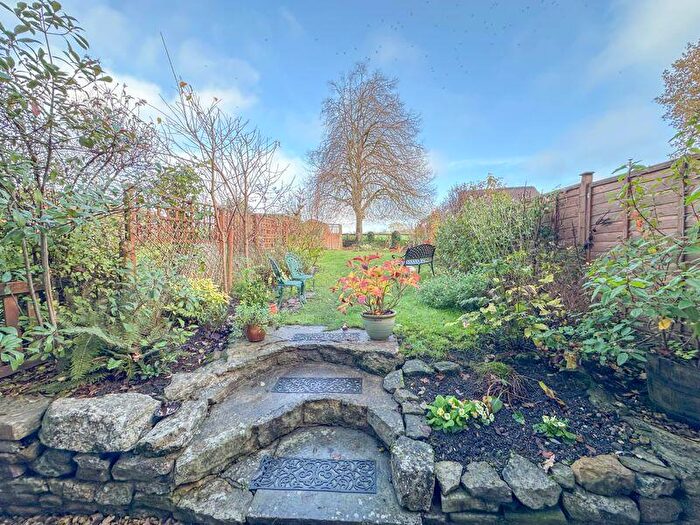
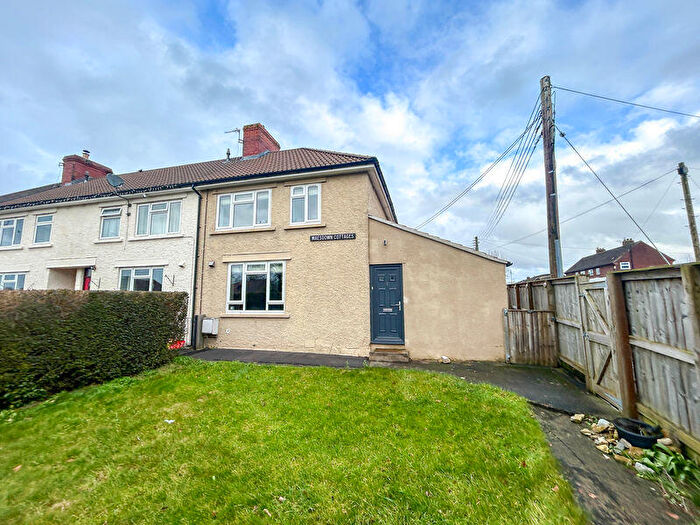
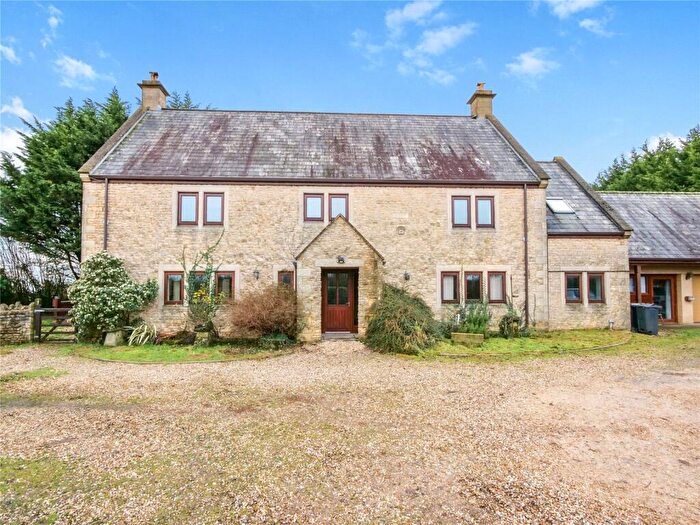
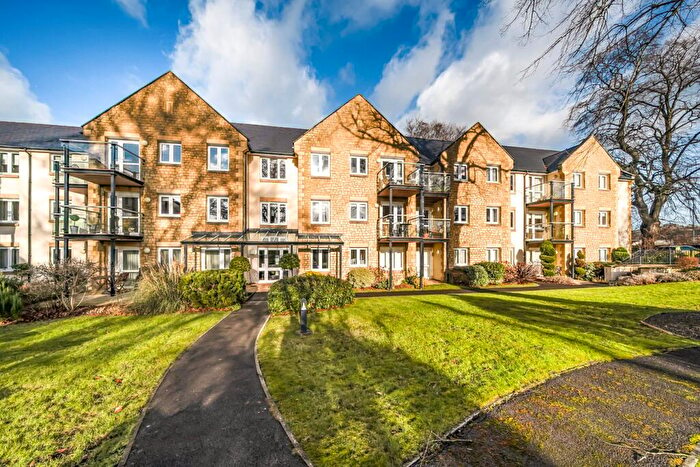
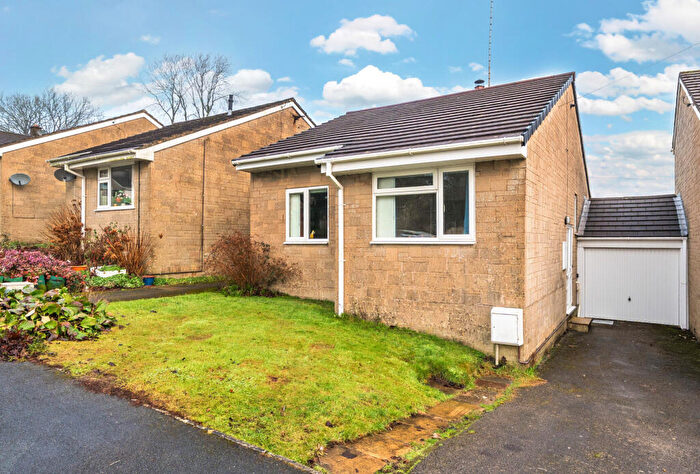
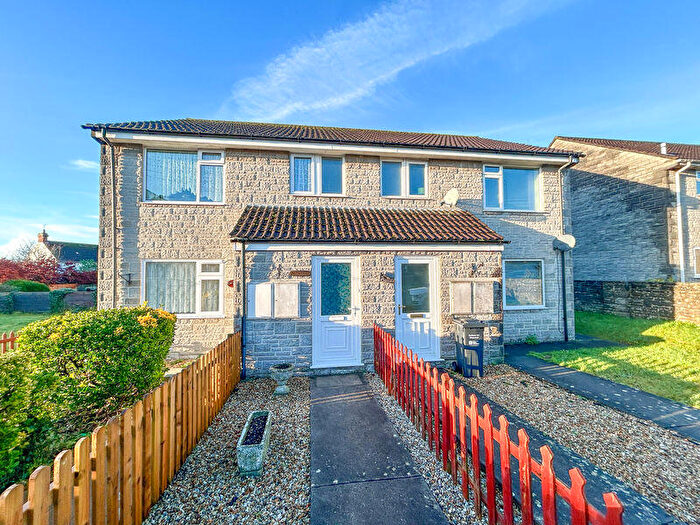
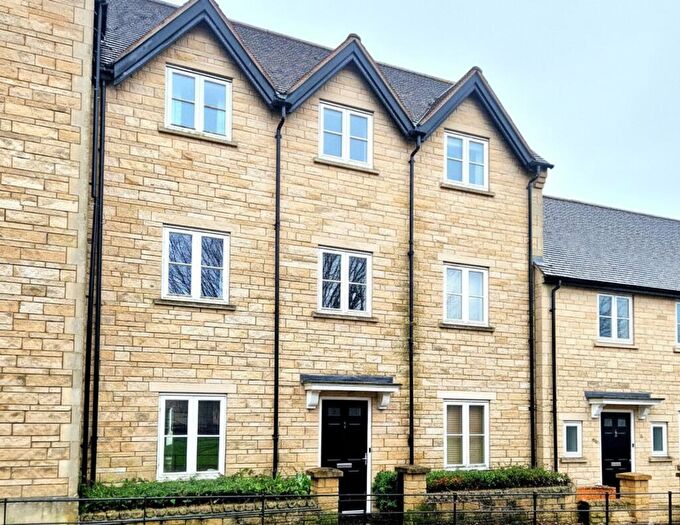
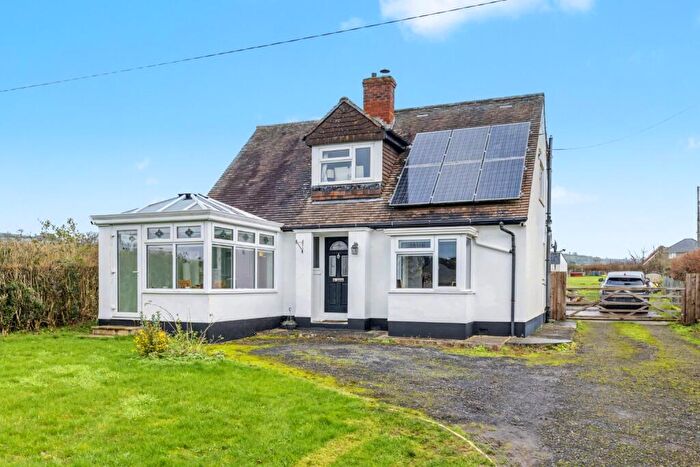
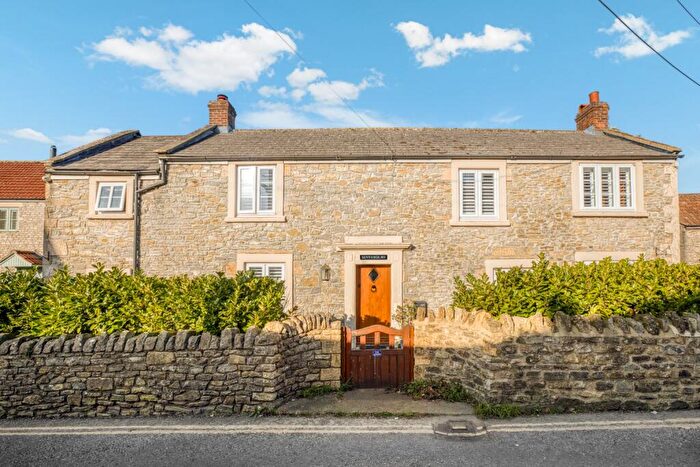
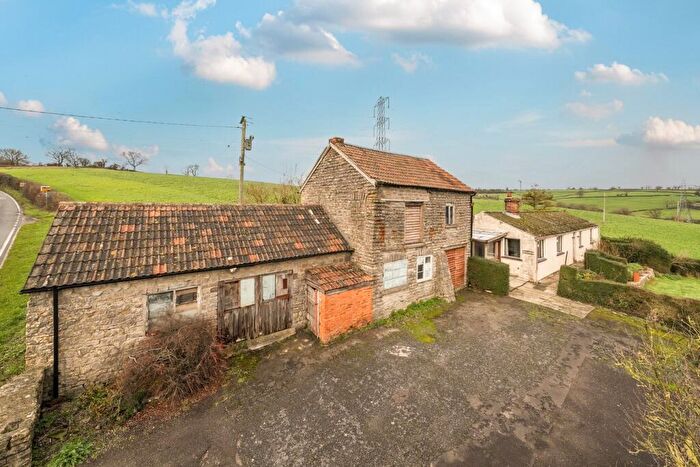
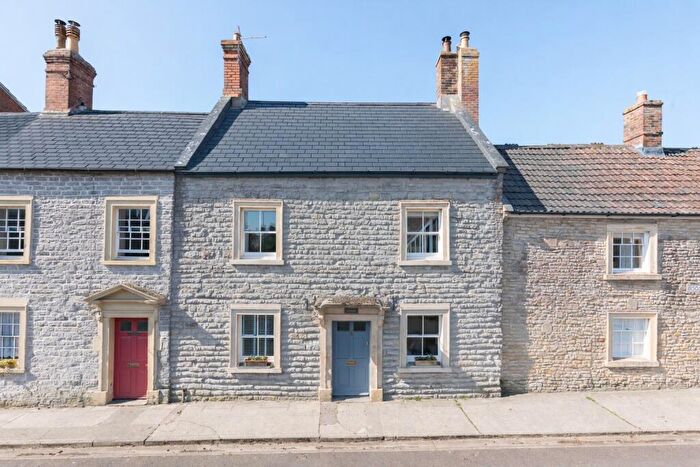
Houses for sale & to rent in Cranmore, Doulting And Nunney, Shepton Mallet
House Prices in Cranmore, Doulting And Nunney
Properties in Cranmore, Doulting And Nunney have an average house price of £423,984.00 and had 33 Property Transactions within the last 3 years¹.
Cranmore, Doulting And Nunney is an area in Shepton Mallet, Somerset with 471 households², where the most expensive property was sold for £750,000.00.
Properties for sale in Cranmore, Doulting And Nunney
Roads and Postcodes in Cranmore, Doulting And Nunney
Navigate through our locations to find the location of your next house in Cranmore, Doulting And Nunney, Shepton Mallet for sale or to rent.
| Streets | Postcodes |
|---|---|
| Beacon | BA4 4JU BA4 4LA |
| Beard Hill | BA4 6SS |
| Bodden Cottages | BA4 4PT |
| Carey Close | BA4 4AH |
| Castle Lane | BA4 4RY |
| Chelynch Park | BA4 4PL |
| Chelynch Road | BA4 4PJ BA4 4PZ BA4 4RQ |
| Cooks Lane | BA4 4RH |
| Crane Cottages | BA4 4QN BA4 4QW |
| Edmund Rack Road | BA4 4FZ |
| Farrington Lane | BA4 4RG |
| Frome Road | BA4 4QQ |
| Funtle Lane | BA4 4LD |
| Ganesfield | BA4 4QA |
| Heale | BA4 4LH BA4 4LJ |
| Holcombe Lane | BA4 4RD |
| Long Cross | BA4 4LE |
| Manor Farm | BA4 4QL |
| Manor Farm Cottages | BA4 4QG |
| Martins Paddock | BA4 4QY |
| Merryfield Lane | BA4 4RF |
| New Buildings | BA4 4QF |
| Newman Street | BA4 4JZ |
| Old Down Lane | BA4 4PX |
| Padfield Green | BA4 4QB |
| Pawelski Close | BA4 4RX |
| Piers Road | BA4 4QH |
| Prestleigh Lane | BA4 4NG |
| Slait Hill | BA4 4LL |
| St Bartholomew's Cottages | BA4 4FG |
| Wagon & Horses Hill | BA4 4ND |
| Withywood Lane | BA4 4QR |
| BA4 4LQ BA4 4NF BA4 4NJ BA4 4NL BA4 4NN BA4 4PU BA4 4PY BA4 4QD BA4 4QE BA4 4QJ BA4 4QP BA4 4QS BA4 4RB BA4 4RE BA4 4RN BA4 4RP BA4 4RZ BA4 4SA BA4 4SD BA4 4SE BA4 4SG BA4 4LG BA4 4QT BA4 4RA BA4 4SF BA4 4SQ BA4 6DD BA4 6QL BA4 6QN |
Transport near Cranmore, Doulting And Nunney
- FAQ
- Price Paid By Year
- Property Type Price
Frequently asked questions about Cranmore, Doulting And Nunney
What is the average price for a property for sale in Cranmore, Doulting And Nunney?
The average price for a property for sale in Cranmore, Doulting And Nunney is £423,984. This amount is 24% higher than the average price in Shepton Mallet. There are 1,178 property listings for sale in Cranmore, Doulting And Nunney.
What streets have the most expensive properties for sale in Cranmore, Doulting And Nunney?
The streets with the most expensive properties for sale in Cranmore, Doulting And Nunney are Chelynch Park at an average of £668,500, Martins Paddock at an average of £645,000 and Prestleigh Lane at an average of £565,000.
What streets have the most affordable properties for sale in Cranmore, Doulting And Nunney?
The streets with the most affordable properties for sale in Cranmore, Doulting And Nunney are Crane Cottages at an average of £277,890, Padfield Green at an average of £330,000 and Cooks Lane at an average of £378,000.
Which train stations are available in or near Cranmore, Doulting And Nunney?
Some of the train stations available in or near Cranmore, Doulting And Nunney are Bruton, Castle Cary and Frome.
Property Price Paid in Cranmore, Doulting And Nunney by Year
The average sold property price by year was:
| Year | Average Sold Price | Price Change |
Sold Properties
|
|---|---|---|---|
| 2025 | £447,777 | 12% |
9 Properties |
| 2024 | £395,615 | -11% |
13 Properties |
| 2023 | £438,045 | -0,3% |
11 Properties |
| 2022 | £439,310 | -10% |
19 Properties |
| 2021 | £484,540 | 27% |
16 Properties |
| 2020 | £352,375 | 6% |
8 Properties |
| 2019 | £332,050 | -19% |
10 Properties |
| 2018 | £395,104 | 31% |
24 Properties |
| 2017 | £273,031 | -43% |
16 Properties |
| 2016 | £389,666 | 10% |
15 Properties |
| 2015 | £350,656 | 6% |
16 Properties |
| 2014 | £329,407 | 15% |
14 Properties |
| 2013 | £279,425 | 21% |
14 Properties |
| 2012 | £221,814 | -22% |
17 Properties |
| 2011 | £271,687 | -34% |
8 Properties |
| 2010 | £363,590 | 27% |
11 Properties |
| 2009 | £264,750 | -30% |
10 Properties |
| 2008 | £345,142 | 1% |
7 Properties |
| 2007 | £339,996 | 16% |
13 Properties |
| 2006 | £284,946 | 23% |
19 Properties |
| 2005 | £219,428 | -39% |
14 Properties |
| 2004 | £304,976 | -6% |
23 Properties |
| 2003 | £322,419 | 37% |
23 Properties |
| 2002 | £201,677 | 24% |
29 Properties |
| 2001 | £154,219 | 5% |
18 Properties |
| 2000 | £145,772 | 18% |
9 Properties |
| 1999 | £118,941 | 24% |
18 Properties |
| 1998 | £90,761 | 11% |
17 Properties |
| 1997 | £80,863 | -27% |
26 Properties |
| 1996 | £102,639 | -11% |
14 Properties |
| 1995 | £113,692 | - |
13 Properties |
Property Price per Property Type in Cranmore, Doulting And Nunney
Here you can find historic sold price data in order to help with your property search.
The average Property Paid Price for specific property types in the last three years are:
| Property Type | Average Sold Price | Sold Properties |
|---|---|---|
| Semi Detached House | £438,666.00 | 9 Semi Detached Houses |
| Detached House | £510,576.00 | 13 Detached Houses |
| Terraced House | £309,636.00 | 11 Terraced Houses |

