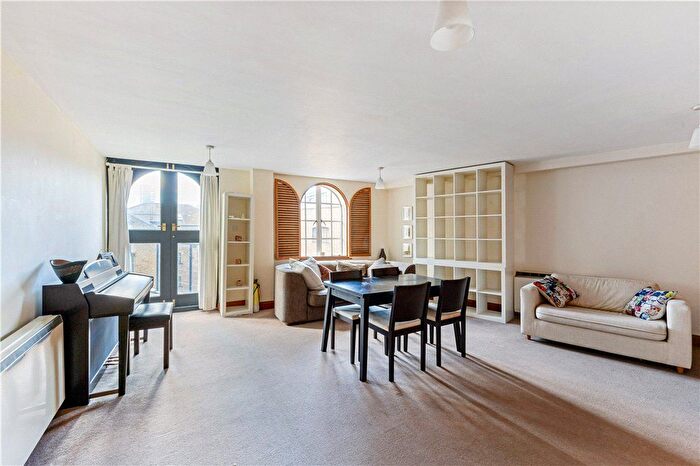
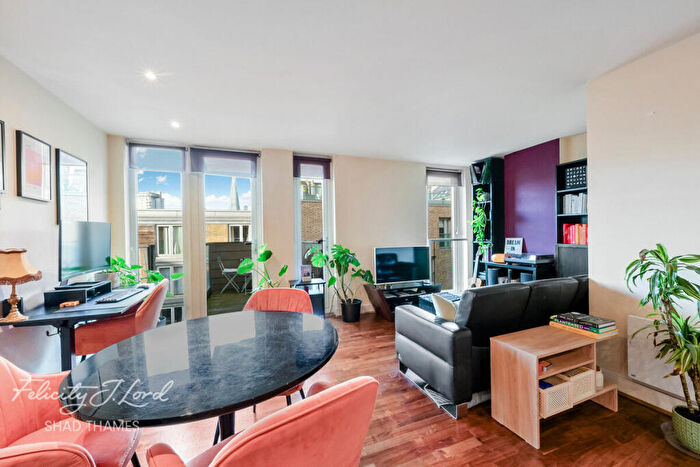
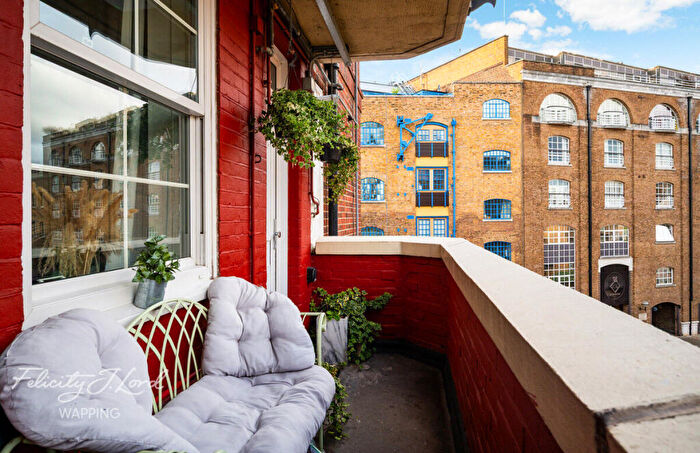
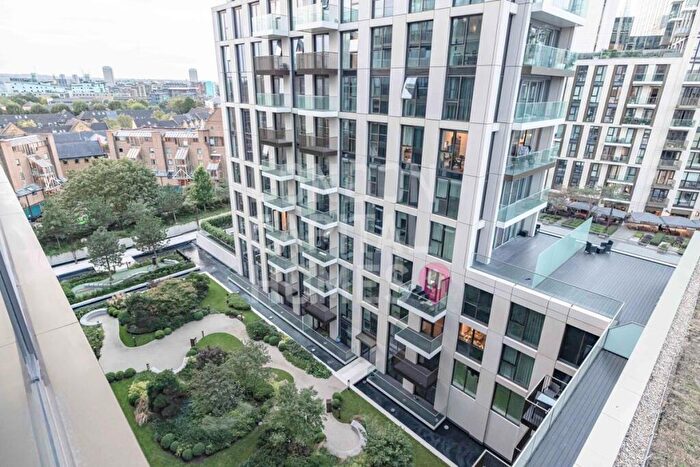
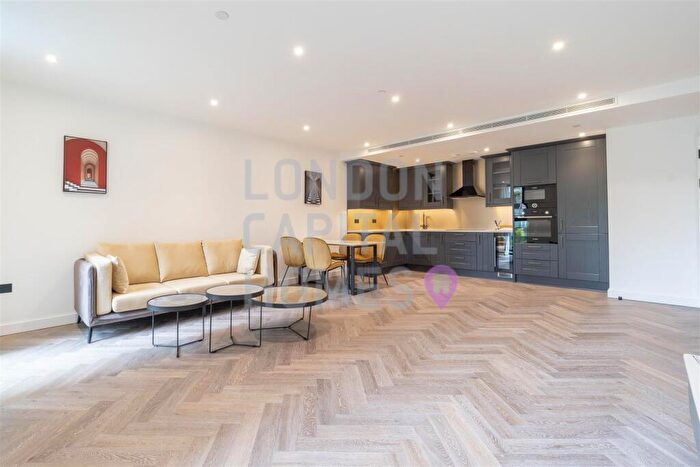
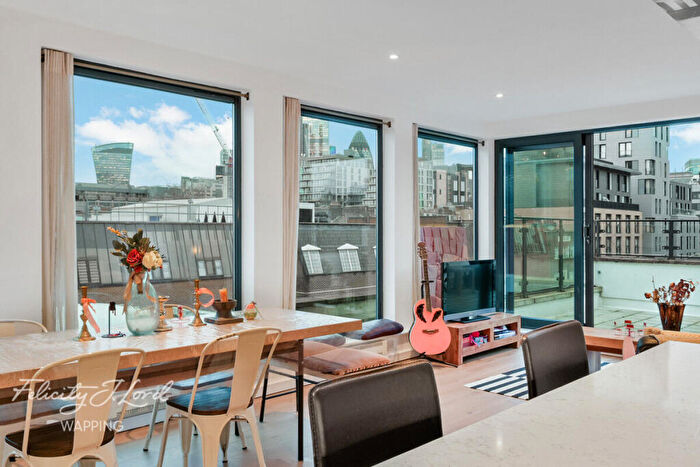
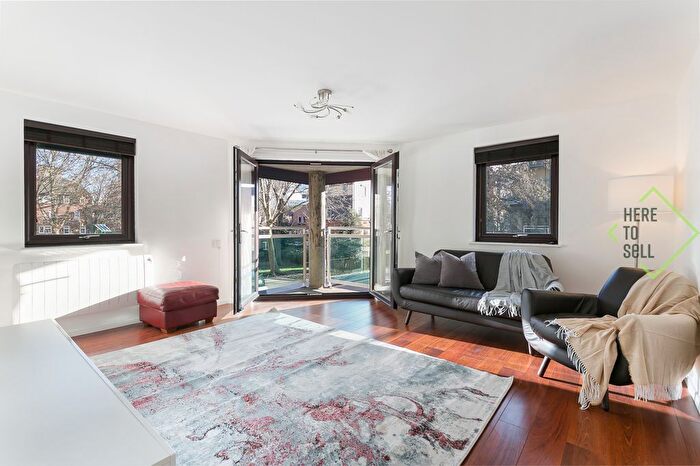
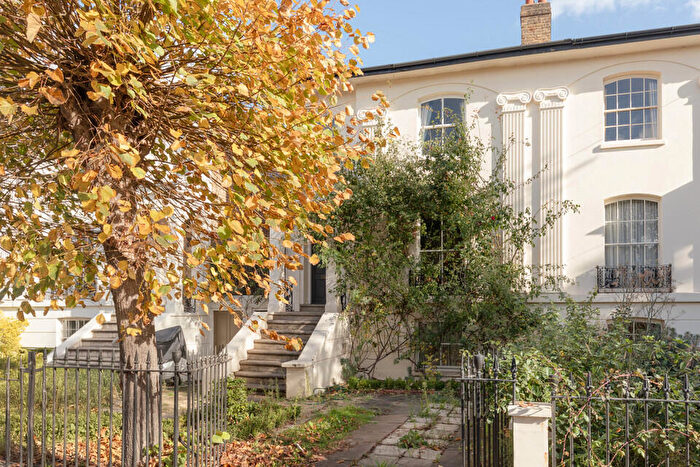
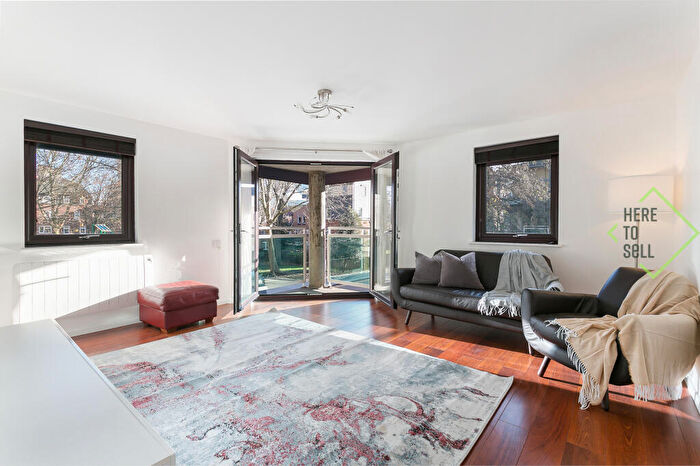
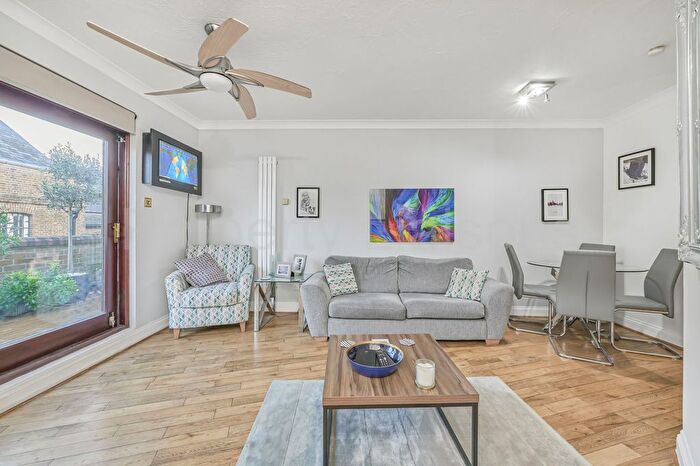
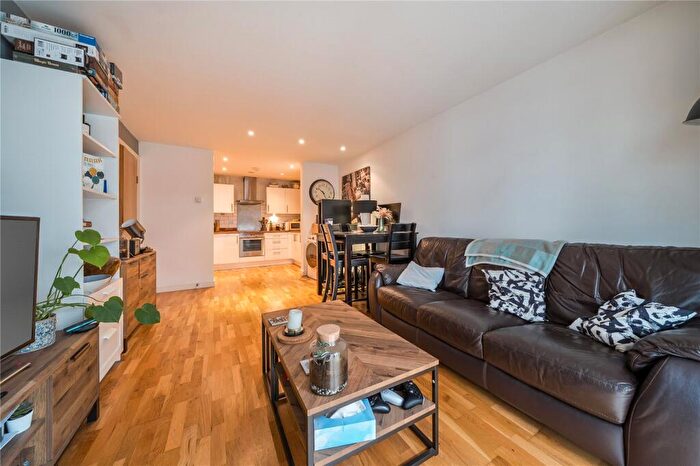
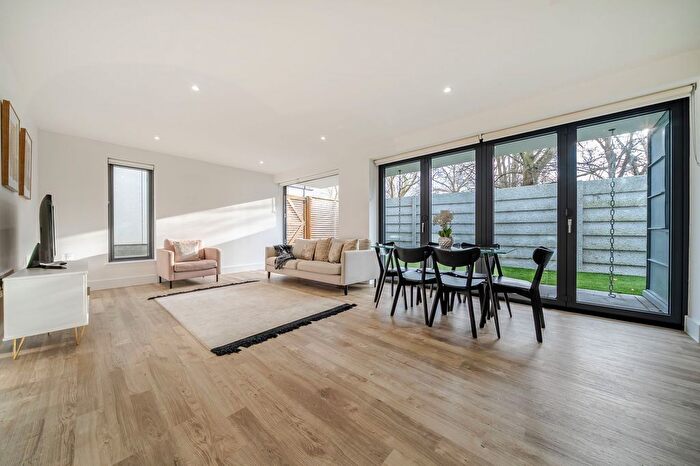
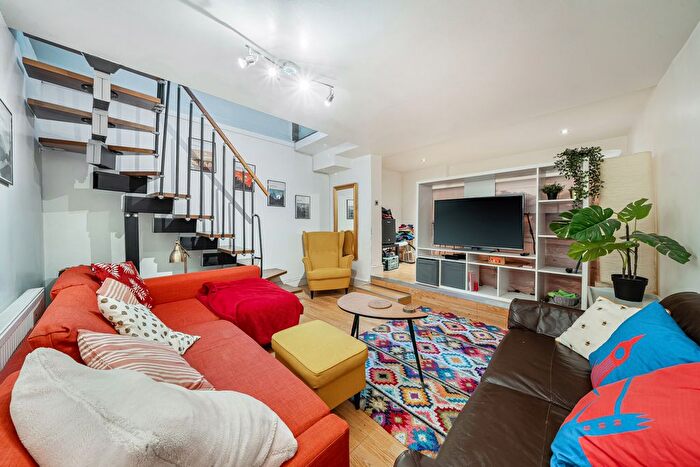
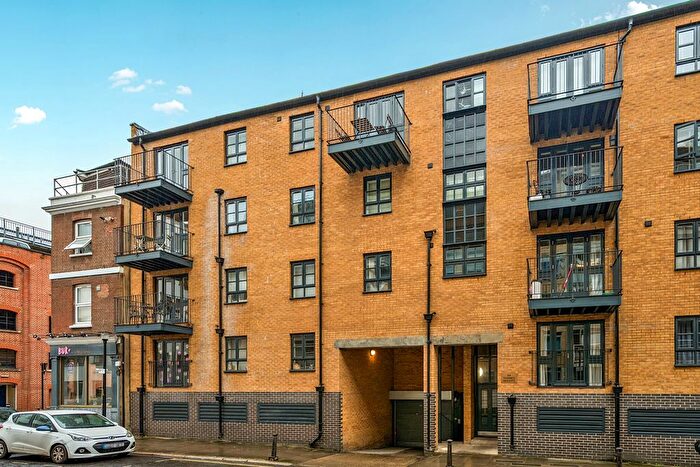
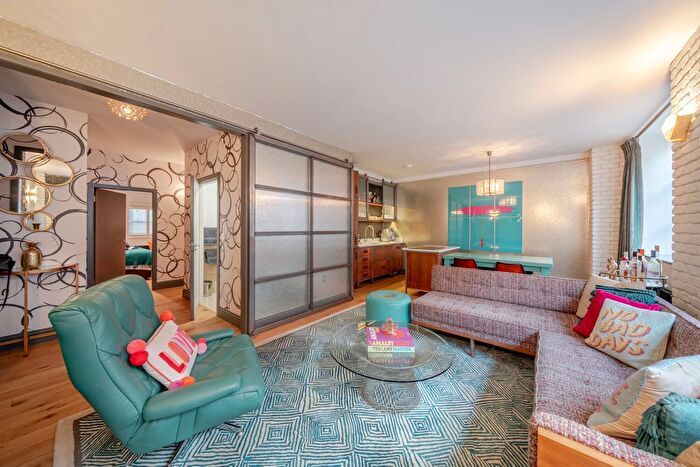
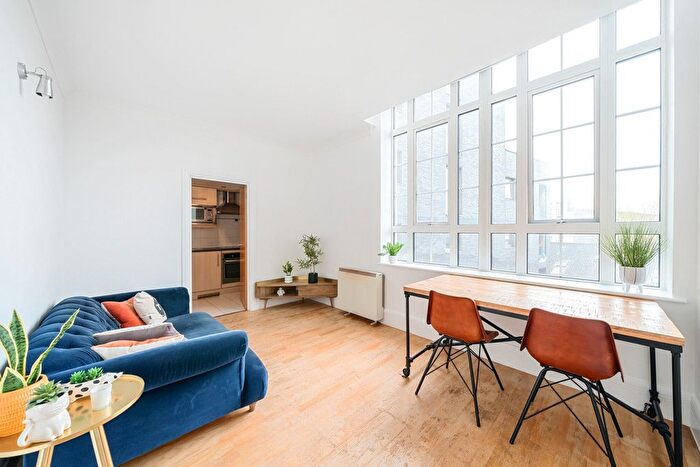
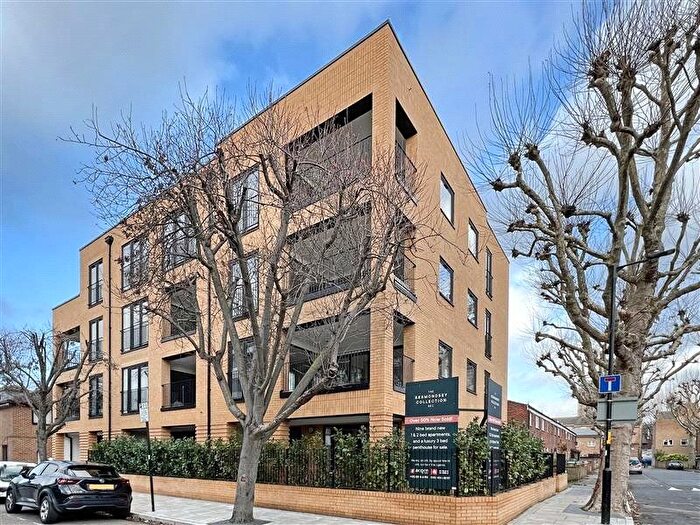
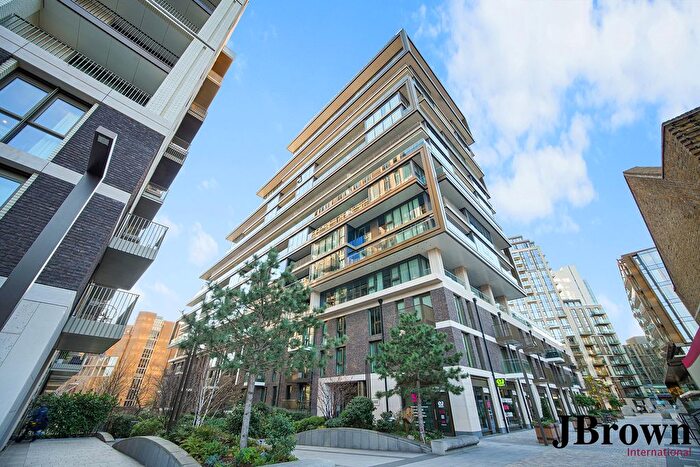
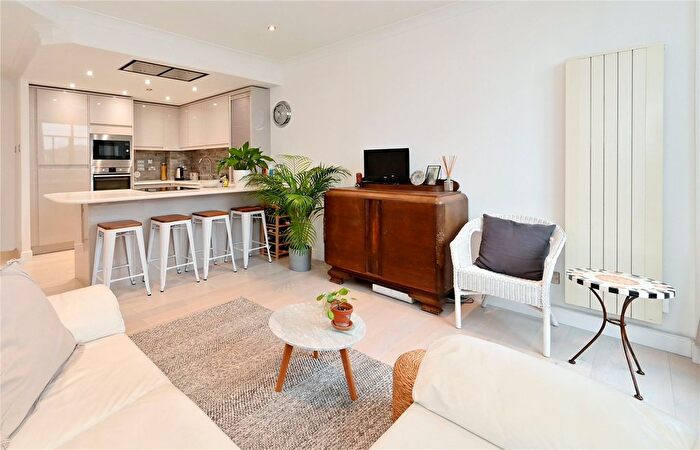
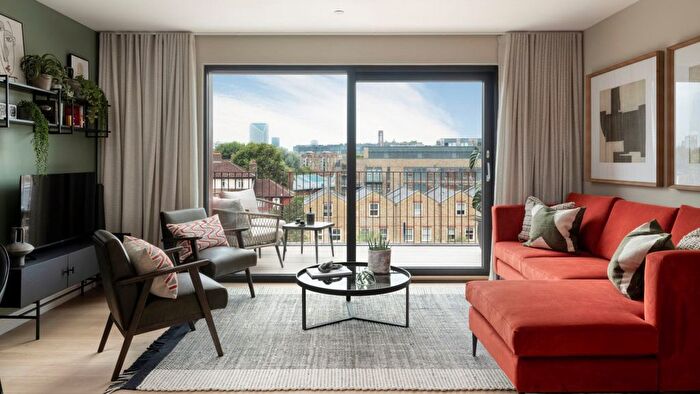
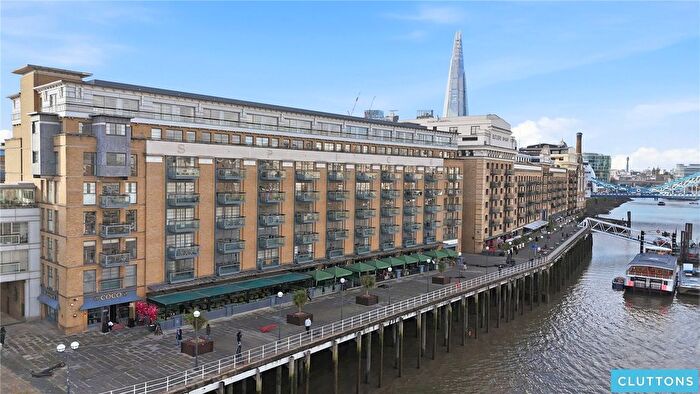
Houses for sale & to rent in North Bermondsey, London
House Prices in North Bermondsey
Properties in this part of North Bermondsey within London have an average house price of £448,410.00 and had 25 Property Transactions within the last 3 years¹. This area has 277 households² , where the most expensive property was sold for £1,500,000.00.
Properties for sale in North Bermondsey
Roads and Postcodes in North Bermondsey
Navigate through our locations to find the location of your next house in North Bermondsey, London for sale or to rent.
| Streets | Postcodes |
|---|---|
| Abbey Street | SE16 4EH |
| Abbeyfield Road | SE16 2AR SE16 2DY |
| Arabella Street | SE16 4BF SE16 4DY |
| Bermondsey Wall East | SE16 4NB SE16 4TY |
| Bermondsey Wall West | SE16 4SA SE16 4TG SE16 4TH SE16 4TQ |
| Chambers Street | SE16 4EN SE16 4EP SE16 4XR |
| Cherry Garden Street | SE16 4EL SE16 4QF |
| Clements Road | SE16 4DG SE16 4DU SE16 4EE SE16 4EQ SE16 4EZ |
| Copper Row | SE1 2LH |
| Dockhead | SE1 2BS |
| Drummond Road | SE16 2BT SE16 2JX SE16 2JY SE16 4ES SE16 4FA |
| Frean Street | SE16 4AS |
| Freda Street | SE16 4BJ SE16 4BW |
| Fulford Street | SE16 4NW |
| Gainsford Street | SE1 2NY |
| George Row | SE16 4WA |
| Hawkstone Road | SE16 2PA |
| Jamaica Road | SE1 2RW SE1 2RX SE16 4BA SE16 4BD SE16 4EG SE16 4RS SE16 4SH SE16 4SN |
| Koops Mill Mews | SE1 2SH |
| Layard Road | SE16 2JQ |
| Llewellyn Street | SE16 4UN |
| Major Road | SE16 4RZ |
| Marine Street | SE16 4AZ SE16 4BS |
| Mill Street | SE1 2AY SE1 2BA |
| Ness Street | SE16 4AR |
| Old Jamaica Road | SE16 4AW SE16 4BB SE16 4BL SE16 4DZ SE16 4ER SE16 4SU |
| Parkers Row | SE1 2DQ |
| Priter Road | SE16 4QW |
| Prospect Street | SE16 4EY |
| Providence Square | SE1 2EW |
| Queen Elizabeth Street | SE1 2BT SE1 2JE SE1 2LS SE1 2PD SE1 2RJ |
| Raymouth Road | SE16 2DB SE16 2DH SE16 2DJ |
| Rosebud Mews | SE16 2FD |
| Scott Lidgett Crescent | SE16 4XF |
| Shad Thames | SE1 2PU SE1 2XZ SE1 2YD |
| Southwark Park Road | SE16 2EW SE16 2HB SE16 2HU SE16 2JN SE16 2JP SE16 2JW |
| Spa Road | SE16 4AQ SE16 4AU SE16 4EJ |
| St James's Road | SE16 4ET SE16 4QZ SE16 4RA |
| Sugar Lane | SE16 4EU |
| Thurland Road | SE16 4AA |
| Tower Bridge Road | SE1 2UP |
| Tranton Road | SE16 4RL |
| Voyager Business Estate | SE16 4RP |
| Webster Road | SE16 4DH |
| West Lane | SE16 4NY |
Transport near North Bermondsey
-
Bermondsey Station
-
Rotherhithe Station
-
Wapping Station
-
Canada Water Station
-
New Cross Station
-
South Bermondsey Station
-
Surrey Quays Station
-
Tower Gateway Station
-
Tower Hill Station
-
London Bridge Station
- FAQ
- Price Paid By Year
- Property Type Price
Frequently asked questions about North Bermondsey
What is the average price for a property for sale in North Bermondsey?
The average price for a property for sale in North Bermondsey is £448,410. This amount is 32% lower than the average price in London. There are 6,161 property listings for sale in North Bermondsey.
What streets have the most expensive properties for sale in North Bermondsey?
The streets with the most expensive properties for sale in North Bermondsey are Prospect Street at an average of £601,666, Old Jamaica Road at an average of £589,000 and St James's Road at an average of £577,000.
What streets have the most affordable properties for sale in North Bermondsey?
The streets with the most affordable properties for sale in North Bermondsey are Chambers Street at an average of £141,656, Arabella Street at an average of £180,000 and Abbey Street at an average of £395,000.
Which train stations are available in or near North Bermondsey?
Some of the train stations available in or near North Bermondsey are Rotherhithe, Wapping and Canada Water.
Which tube stations are available in or near North Bermondsey?
Some of the tube stations available in or near North Bermondsey are Bermondsey, Canada Water and Tower Hill.
Property Price Paid in North Bermondsey by Year
The average sold property price by year was:
| Year | Average Sold Price | Price Change |
Sold Properties
|
|---|---|---|---|
| 2025 | £377,000 | -44% |
4 Properties |
| 2024 | £541,666 | -20% |
3 Properties |
| 2023 | £650,178 | 51% |
7 Properties |
| 2022 | £320,545 | 18% |
11 Properties |
| 2021 | £261,738 | -191% |
18 Properties |
| 2020 | £761,363 | 56% |
11 Properties |
| 2019 | £338,260 | -45% |
5 Properties |
| 2018 | £490,016 | 53% |
15 Properties |
| 2017 | £232,458 | 22% |
6 Properties |
| 2016 | £180,611 | -329% |
9 Properties |
| 2015 | £774,373 | 85% |
8 Properties |
| 2003 | £115,000 | 62% |
1 Property |
| 2000 | £43,750 | - |
2 Properties |
Property Price per Property Type in North Bermondsey
Here you can find historic sold price data in order to help with your property search.
The average Property Paid Price for specific property types in the last three years are:
| Property Type | Average Sold Price | Sold Properties |
|---|---|---|
| Flat | £397,097.00 | 23 Flats |
| Semi Detached House | £577,000.00 | 1 Semi Detached House |
| Detached House | £1,500,000.00 | 1 Detached House |

