
Houses for sale & to rent in SE17 1QD, FLINT STREET, North Walworth, London
House Prices in SE17 1QD, FLINT STREET, North Walworth
Properties in SE17 1QD have an average house price of £315,000.00 and had 1 Property Transaction within the last 3 years.¹ SE17 1QD is a postcode in FLINT STREET located in North Walworth, an area in London, Southwark London Borough, with 13 households², where the most expensive property was sold for £315,000.00.
Properties for sale near SE17 1QD, FLINT STREET
![]()
If you are looking to sell your house, let it out, or receive a property valuation, an expert can help you.
Click the button below to get started.


Price Paid in FLINT STREET, SE17 1QD, North Walworth
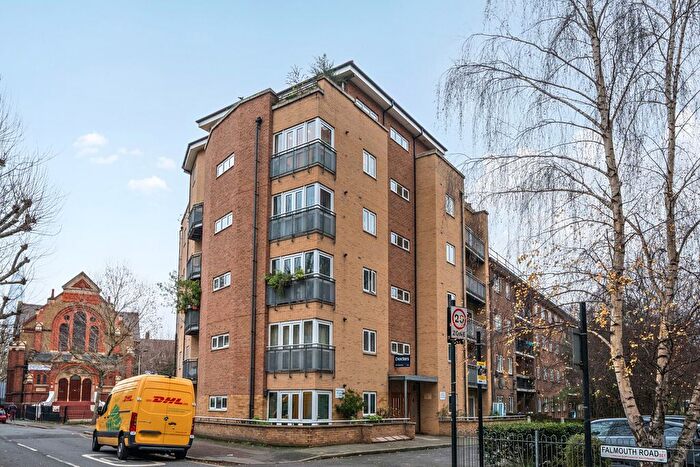
27 FIRST FLOOR FLAT FLINT STREET, SE17 1QD, North Walworth London
Property 27 FIRST FLOOR FLAT has been sold 1 time. The last time it was sold was in 17/04/2025 and the sold price was £315,000.00.
This flat, sold as a leasehold on 17/04/2025, is a 50 sqm mid-floor flat with an EPC rating of D.
| Date | Price | Property Type | Tenure | Classification |
|---|---|---|---|---|
| 17/04/2025 | £315,000.00 | Flat | leasehold | Established Building |
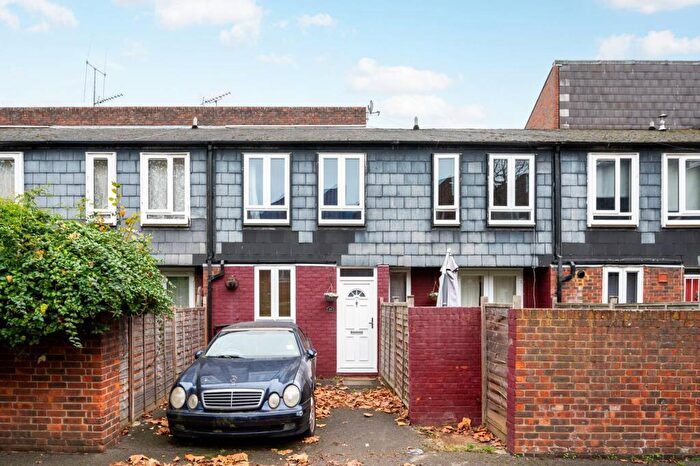
20 - 26 FLINT STREET, SE17 1QD, North Walworth London
Property 20 - 26 has been sold 1 time. The last time it was sold was in 30/11/1999 and the sold price was £50,000.00.
This is a Semi Detached House which was sold as a freehold in 30/11/1999
| Date | Price | Property Type | Tenure | Classification |
|---|---|---|---|---|
| 30/11/1999 | £50,000.00 | Semi Detached House | freehold | Established Building |
Postcodes in FLINT STREET, North Walworth
Navigate through other locations in FLINT STREET, North Walworth, London to see more property listings for sale or to rent.
Transport near SE17 1QD, FLINT STREET
-

 Elephant and Castle Station
 -
Kennington Station
-
Borough Station
-
London Bridge Station
-
Bermondsey Station
-
Lambeth North Station
-
Southwark Station
-
Oval Station
-
Waterloo (East) Station
-
South Bermondsey Station
House price paid reports for SE17 1QD, FLINT STREET
Click on the buttons below to see price paid reports by year or property price:
- Price Paid By Year
- Property Type Price
Property Price Paid in SE17 1QD, FLINT STREET by Year
The average sold property price by year was:
| Year | Average Sold Price | Price Change |
Sold Properties
|
|---|---|---|---|
| 2025 | £315,000 | 84% |
1 Property |
| 1999 | £50,000 | - |
1 Property |
Property Price per Property Type in SE17 1QD, FLINT STREET
Here you can find historic sold price data in order to help with your property search.
The average Property Paid Price for specific property types in the last three years are:
| Property Type | Average Sold Price | Sold Properties |
|---|---|---|
| Flat | £315,000.00 | 1 Flat |