
Houses for sale & to rent in Peckham Rye, London
House Prices in Peckham Rye
Properties in this part of Peckham Rye within London have an average house price of £697,833.00 and had 680 Property Transactions within the last 3 years¹. This area has 5,463 households² , where the most expensive property was sold for £3,375,000.00.
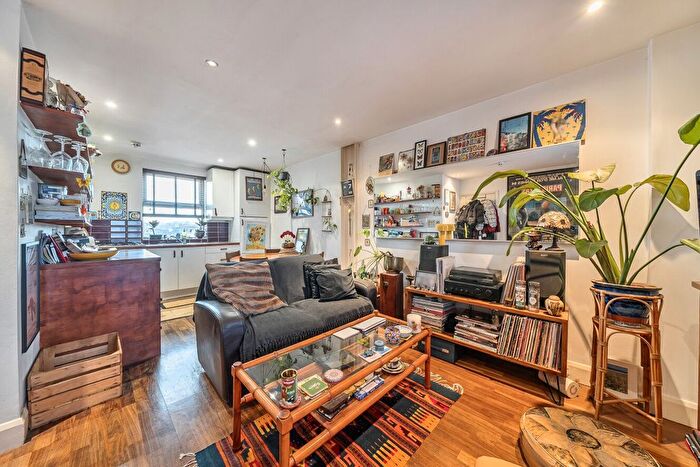
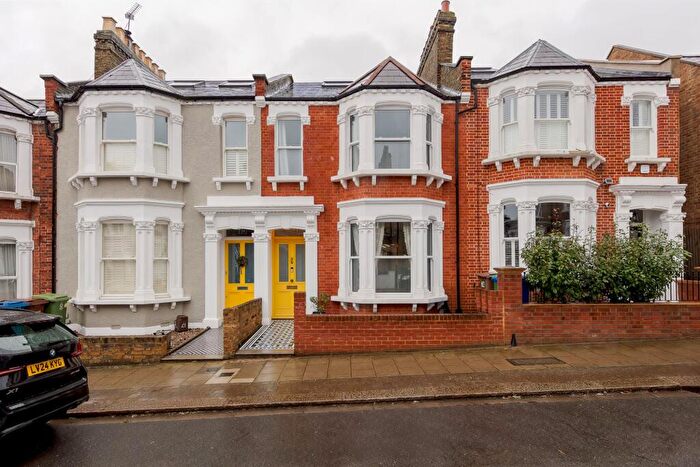
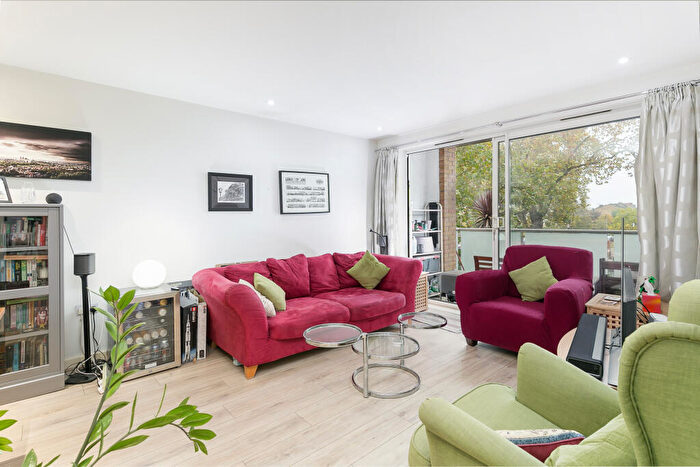
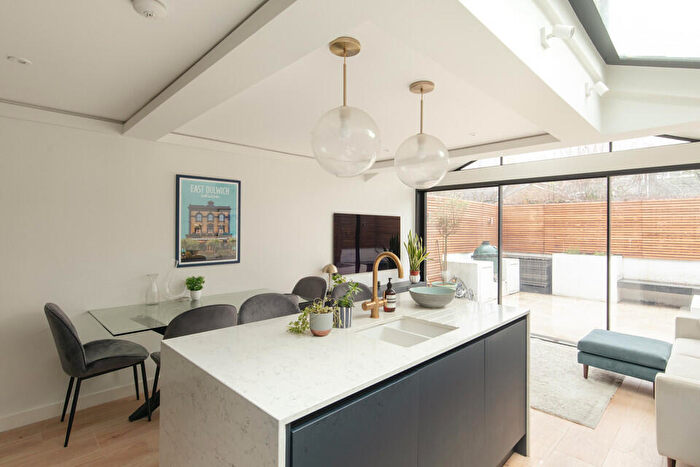
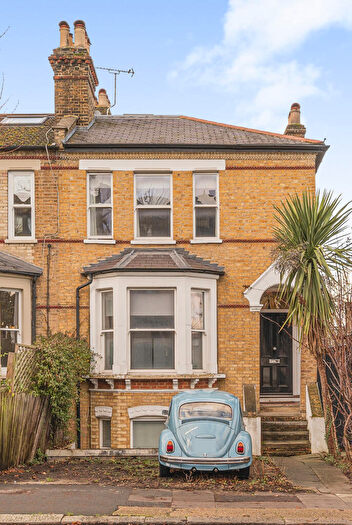
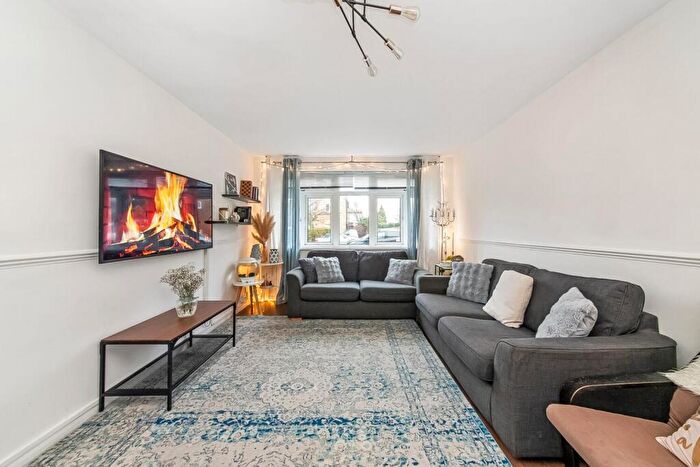
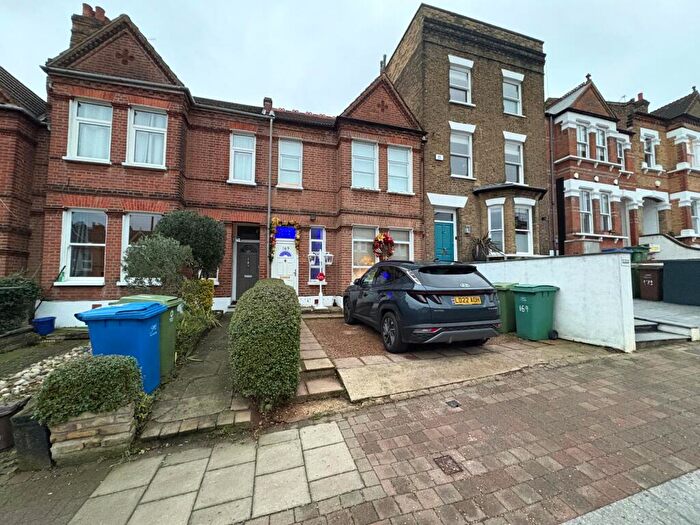
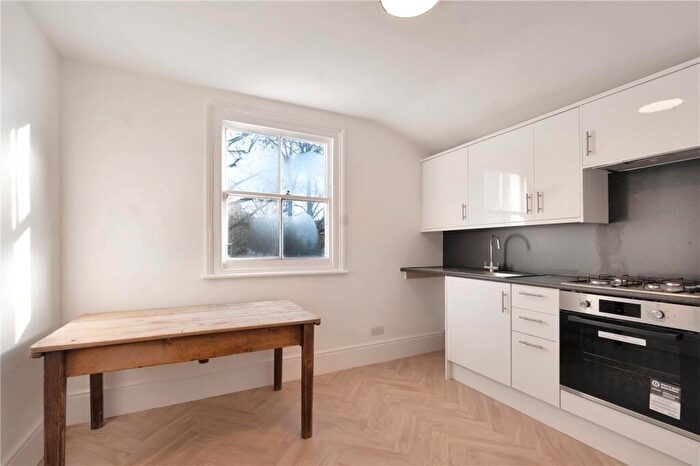
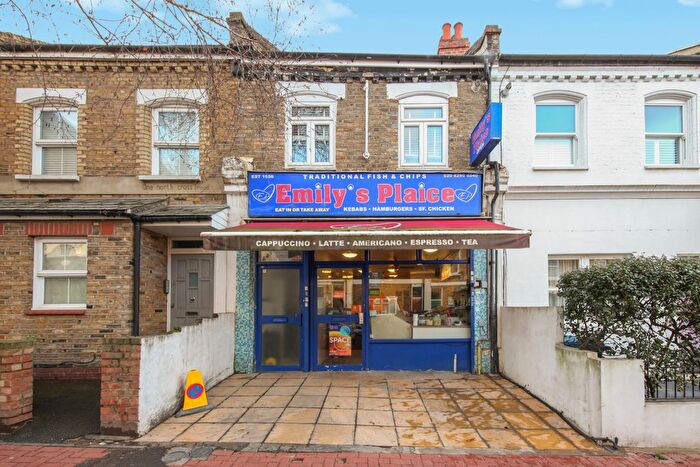
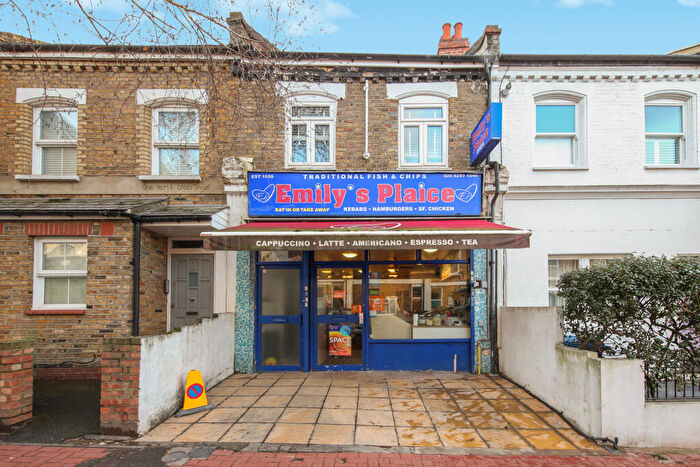
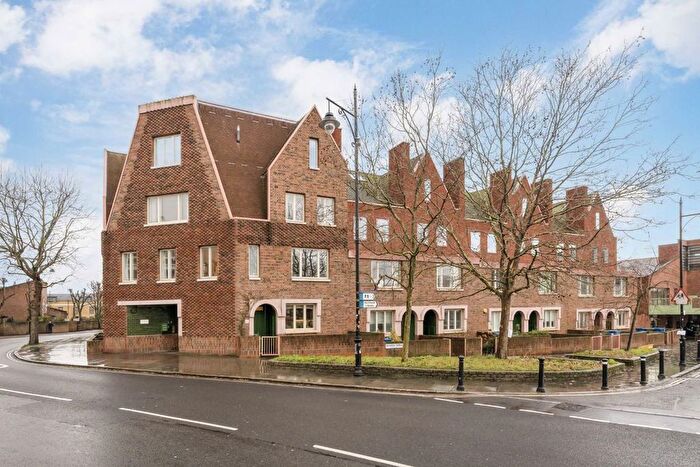
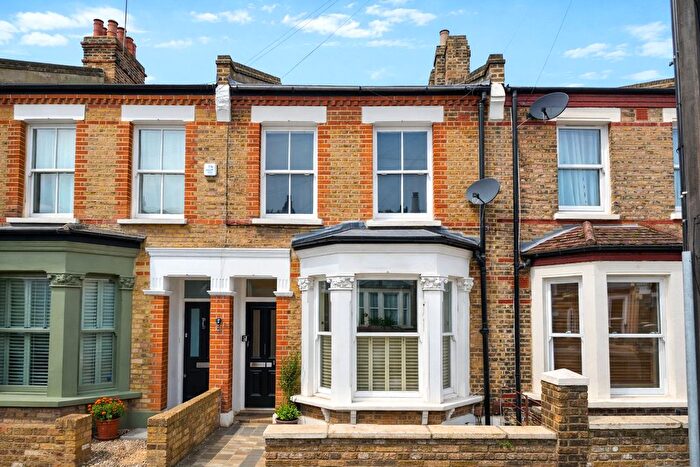
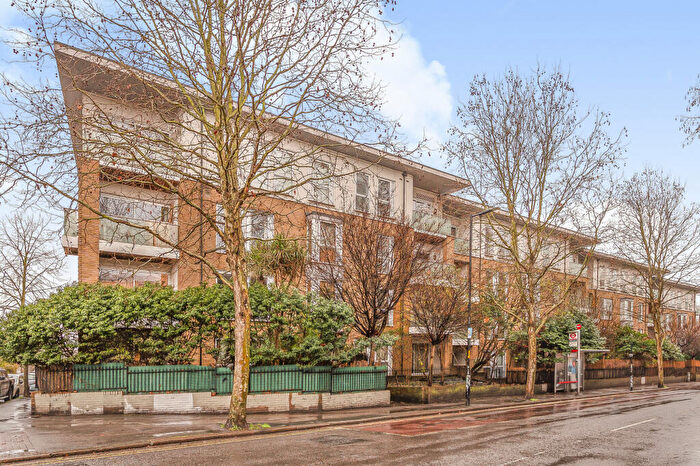
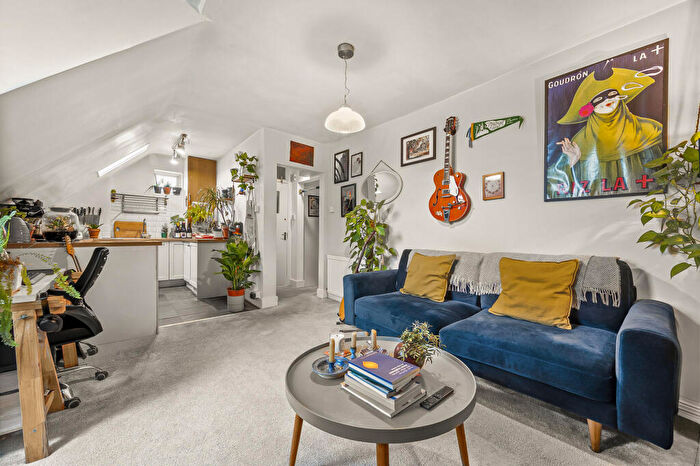
Properties for sale in Peckham Rye

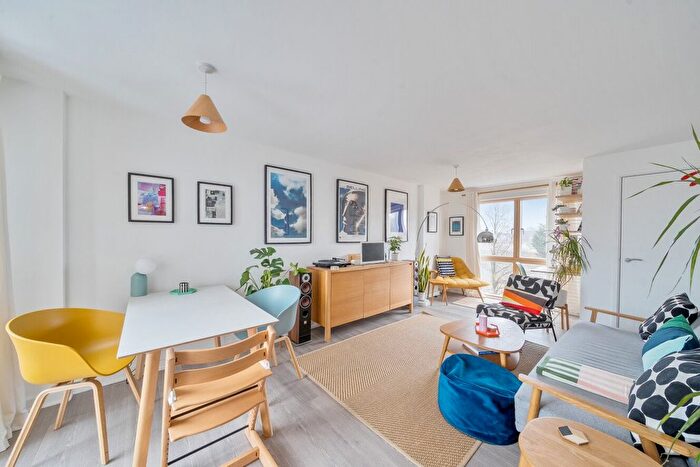
![]()
If you are looking to sell your house, let it out, or receive a property valuation, an expert can help you.
Click the button below to get started.


Roads and Postcodes in Peckham Rye
Navigate through our locations to find the location of your next house in Peckham Rye, London for sale or to rent.
Transport near Peckham Rye
-
 Nunhead Station
 -
 Honor Oak Park Station
 -
East Dulwich Station
-
Peckham Rye Station
-
Crofton Park Station
-
Brockley Station
-
Queen's Road Peckham Station
-
Forest Hill Station
-
North Dulwich Station
-
New Cross Gate Station
- FAQ
- Price Paid By Year
- Property Type Price
Frequently asked questions about Peckham Rye
What is the average price for a property for sale in Peckham Rye?
The average price for a property for sale in Peckham Rye is £697,833. This amount is 6% higher than the average price in London. There are 4,110 property listings for sale in Peckham Rye.
What streets have the most expensive properties for sale in Peckham Rye?
The streets with the most expensive properties for sale in Peckham Rye are Shelbury Road at an average of £1,500,000, Marmora Road at an average of £1,280,611 and Scutari Road at an average of £1,194,166.
What streets have the most affordable properties for sale in Peckham Rye?
The streets with the most affordable properties for sale in Peckham Rye are Solomons Passage at an average of £328,333, Brenchley Gardens at an average of £397,833 and Rye Hill Park at an average of £412,037.
Which train stations are available in or near Peckham Rye?
Some of the train stations available in or near Peckham Rye are Nunhead, Honor Oak Park and East Dulwich.
Property Price Paid in Peckham Rye by Year
The average sold property price by year was:
| Year | Average Sold Price | Price Change |
Sold Properties
|
|---|---|---|---|
| 2025 | £689,877 | -6% |
123 Properties |
| 2024 | £731,762 | 11% |
182 Properties |
| 2023 | £650,031 | -9% |
153 Properties |
| 2022 | £707,368 | 4% |
222 Properties |
| 2021 | £677,085 | 4% |
280 Properties |
| 2020 | £652,483 | 5% |
176 Properties |
| 2019 | £620,377 | -1% |
182 Properties |
| 2018 | £627,936 | 8% |
200 Properties |
| 2017 | £575,945 | 6% |
230 Properties |
| 2016 | £542,638 | 5% |
219 Properties |
| 2015 | £517,733 | 3% |
248 Properties |
| 2014 | £503,969 | 17% |
251 Properties |
| 2013 | £417,693 | 3% |
282 Properties |
| 2012 | £405,708 | 12% |
199 Properties |
| 2011 | £356,623 | 3% |
218 Properties |
| 2010 | £345,458 | 12% |
207 Properties |
| 2009 | £305,377 | -4% |
165 Properties |
| 2008 | £319,000 | -1% |
119 Properties |
| 2007 | £323,470 | 19% |
315 Properties |
| 2006 | £262,296 | 4% |
384 Properties |
| 2005 | £252,256 | 9% |
340 Properties |
| 2004 | £230,634 | 11% |
367 Properties |
| 2003 | £205,144 | 5% |
270 Properties |
| 2002 | £195,092 | 18% |
336 Properties |
| 2001 | £159,611 | 12% |
312 Properties |
| 2000 | £140,546 | 23% |
315 Properties |
| 1999 | £108,520 | 15% |
346 Properties |
| 1998 | £91,962 | 21% |
306 Properties |
| 1997 | £72,778 | 18% |
306 Properties |
| 1996 | £59,668 | -3% |
212 Properties |
| 1995 | £61,225 | - |
160 Properties |
Property Price per Property Type in Peckham Rye
Here you can find historic sold price data in order to help with your property search.
The average Property Paid Price for specific property types in the last three years are:
| Property Type | Average Sold Price | Sold Properties |
|---|---|---|
| Flat | £472,406.00 | 415 Flats |
| Semi Detached House | £1,266,448.00 | 70 Semi Detached Houses |
| Detached House | £1,142,500.00 | 16 Detached Houses |
| Terraced House | £958,360.00 | 179 Terraced Houses |