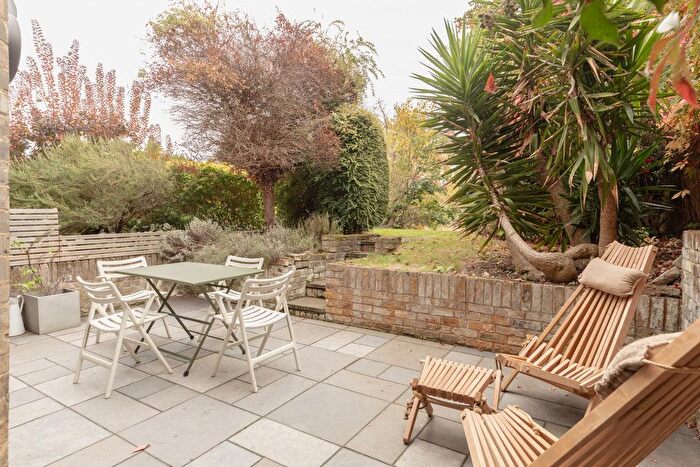
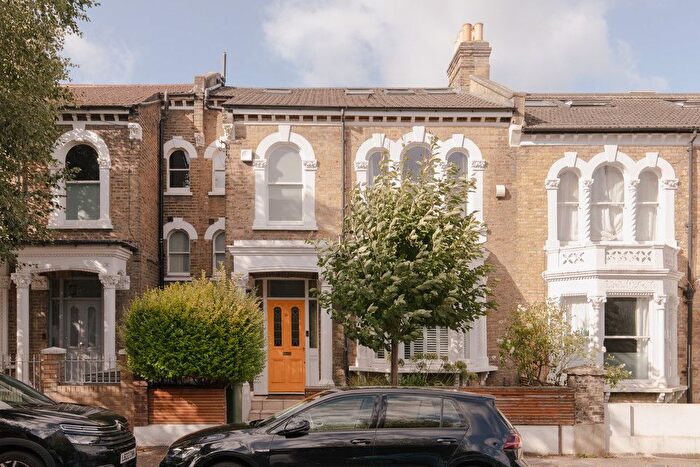
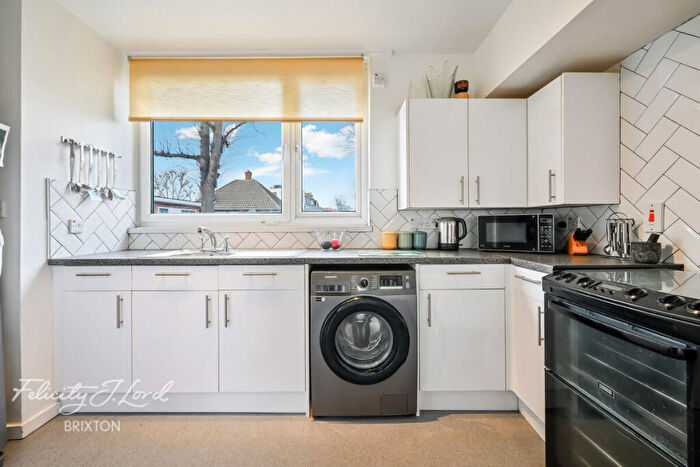
Houses for sale & to rent in South Camberwell, London
House Prices in South Camberwell
Properties in this part of South Camberwell within London have an average house price of £654,445.00 and had 592 Property Transactions within the last 3 years¹. This area has 4,910 households² , where the most expensive property was sold for £4,300,000.00.
Properties for sale in South Camberwell
Roads and Postcodes in South Camberwell
Navigate through our locations to find the location of your next house in South Camberwell, London for sale or to rent.
| Streets | Postcodes |
|---|---|
| Abbotswood Road | SE22 8DJ SE22 8DL SE22 8DN |
| Adys Road | SE15 4DZ |
| Albrighton Road | SE22 8AD SE22 8AE SE22 8AF SE22 8AG SE22 8AP SE22 8AQ SE22 8AW |
| Anderton Close | SE5 8BU |
| Arnould Avenue | SE5 8AU |
| Avondale Rise | SE15 4AJ |
| Basingdon Way | SE5 8EP SE5 8ER SE5 8HB SE5 8HD |
| Beaulieu Close | SE5 8BA |
| Bellenden Road | SE15 4BY SE15 4DG SE15 4DQ |
| Besant Place | SE22 8DA |
| Blanchedowne | SE5 8HL SE5 8HT |
| Bromar Road | SE5 8DL |
| Burrow Road | SE22 8DU SE22 8DW |
| Buxted Road | SE22 8DQ |
| Camberwell Grove | SE5 8JS SE5 8JU SE5 8RH SE5 8RJ SE5 8RQ |
| Canning Cross | SE5 8BH |
| Champion Grove | SE5 8BN SE5 8BW |
| Champion Hill | SE5 8AH SE5 8AL SE5 8AP SE5 8AY SE5 8BS SE5 8DR SE5 8TG SE5 8TH SE5 8TL SE5 8TN SE5 8TQ |
| Champion Hill Estate | SE5 8DP SE5 8DW |
| Champion Park | SE5 8TD SE5 8TE |
| Copleston Road | SE15 4AF SE15 4AG SE15 4AH SE15 4AQ |
| Crossthwaite Avenue | SE5 8ET SE5 8EY |
| Denmark Hill | SE5 8EH SE5 8EJ SE5 8EN |
| Denmark Hill Estate | SE5 8ES SE5 8HG SE5 8HH SE5 8HJ SE5 8HQ SE5 8HS SE5 8HU SE5 8HX |
| Dog Kennel Hill | SE22 8AA SE22 8BF |
| Dog Kennel Hill Estate | SE22 8AL SE22 8BP SE22 8BY SE22 8BZ |
| Domett Close | SE5 8AR |
| Dowson Close | SE5 8AS |
| Dylways | SE5 8HN SE5 8HR SE5 8HW |
| East Dulwich Estate | SE22 8BU |
| East Dulwich Road | SE22 9AT |
| Everthorpe Road | SE15 4DA |
| Green Dale | SE5 8JZ |
| Grove Hill Road | SE5 8DF SE5 8DG |
| Grove Lane | SE5 8BG SE5 8BJ SE5 8BP SE5 8DA |
| Grove Park | SE5 8LD SE5 8LE SE5 8LF SE5 8LG SE5 8LH SE5 8LP SE5 8LR SE5 8LS SE5 8LT |
| Grove Vale | SE22 8EF SE22 8EN SE22 8EQ SE22 8ET |
| Grovelands Close | SE5 8JN |
| Gylcote Close | SE5 8EU |
| Harfield Gardens | SE5 8DB |
| Hayes Grove | SE22 8DF |
| Hillcrest | SE24 9PZ |
| Hunter Court | SE5 8HA |
| Ivanhoe Road | SE5 8DH SE5 8DJ |
| Langford Green | SE5 8BX |
| Linwood Close | SE5 8UT SE5 8UU SE5 8UX SE5 8UY |
| Maldon Close | SE5 8DD |
| Malfort Road | SE5 8DQ |
| Marsden Road | SE15 4EE |
| Maxted Road | SE15 4LL |
| Monclar Road | SE5 8AX |
| Muschamp Road | SE15 4EF SE15 4EG |
| Nairne Grove | SE24 9PU |
| Oglander Road | SE15 4DB SE15 4DD SE15 4EL SE15 4EN |
| Ondine Road | SE15 4EA SE15 4EB SE15 4ED |
| Oxenford Street | SE15 4DE SE15 4DF |
| Pelham Close | SE5 8LW |
| Pirie Close | SE5 8TF |
| Pytchley Road | SE22 8AN SE22 8BT SE22 8DB |
| Quorn Road | SE22 8BJ SE22 8BL SE22 8BN |
| Red Post Hill | SE24 9JQ |
| Shaw Road | SE22 8DP |
| Soames Street | SE15 4BZ |
| Spring Hill Close | SE5 8AJ |
| St Francis Road | SE22 8DE |
| Stories Mews | SE5 8JJ |
| Sunray Avenue | SE24 9PT SE24 9PX |
| Talbot Road | SE22 8EH |
| The Birches | SE5 8LL |
| The Hamlet | SE5 8AW |
| The Limes | SE5 8LN |
| Turner Court | SE5 8EZ |
| Wanley Road | SE5 8AT |
| Woodfarrs | SE5 8EX |
Transport near South Camberwell
-
East Dulwich Station
-
Denmark Hill Station
-
North Dulwich Station
-
Peckham Rye Station
-
Loughborough Junction Station
-
Herne Hill Station
-
Nunhead Station
-
Queen's Road Peckham Station
-
Brixton Station
-
West Dulwich Station
- FAQ
- Price Paid By Year
- Property Type Price
Frequently asked questions about South Camberwell
What is the average price for a property for sale in South Camberwell?
The average price for a property for sale in South Camberwell is £654,445. This amount is 0.45% lower than the average price in London. There are 4,408 property listings for sale in South Camberwell.
What streets have the most expensive properties for sale in South Camberwell?
The streets with the most expensive properties for sale in South Camberwell are Red Post Hill at an average of £2,245,000, Stories Mews at an average of £1,620,000 and The Hamlet at an average of £1,210,833.
What streets have the most affordable properties for sale in South Camberwell?
The streets with the most affordable properties for sale in South Camberwell are Hillcrest at an average of £302,500, Pytchley Road at an average of £323,791 and Dog Kennel Hill Estate at an average of £324,272.
Which train stations are available in or near South Camberwell?
Some of the train stations available in or near South Camberwell are East Dulwich, Denmark Hill and North Dulwich.
Which tube stations are available in or near South Camberwell?
The tube station available in or near South Camberwell is Brixton.
Property Price Paid in South Camberwell by Year
The average sold property price by year was:
| Year | Average Sold Price | Price Change |
Sold Properties
|
|---|---|---|---|
| 2025 | £646,461 | 5% |
118 Properties |
| 2024 | £617,073 | -5% |
167 Properties |
| 2023 | £649,652 | -7% |
116 Properties |
| 2022 | £694,965 | 5% |
191 Properties |
| 2021 | £658,137 | 13% |
198 Properties |
| 2020 | £572,242 | -14% |
137 Properties |
| 2019 | £652,348 | 7% |
148 Properties |
| 2018 | £605,896 | 9% |
122 Properties |
| 2017 | £554,074 | -0,2% |
156 Properties |
| 2016 | £555,015 | -2% |
150 Properties |
| 2015 | £567,837 | 17% |
216 Properties |
| 2014 | £472,460 | 3% |
200 Properties |
| 2013 | £457,233 | 15% |
220 Properties |
| 2012 | £390,018 | 12% |
180 Properties |
| 2011 | £341,343 | 5% |
172 Properties |
| 2010 | £323,153 | 13% |
177 Properties |
| 2009 | £281,006 | -9% |
151 Properties |
| 2008 | £307,094 | -3% |
121 Properties |
| 2007 | £315,788 | 15% |
266 Properties |
| 2006 | £266,956 | 3% |
238 Properties |
| 2005 | £259,911 | 6% |
198 Properties |
| 2004 | £244,340 | 11% |
220 Properties |
| 2003 | £216,640 | 5% |
233 Properties |
| 2002 | £205,614 | 12% |
230 Properties |
| 2001 | £180,356 | 23% |
218 Properties |
| 2000 | £138,914 | 18% |
195 Properties |
| 1999 | £113,484 | 10% |
260 Properties |
| 1998 | £102,497 | 11% |
237 Properties |
| 1997 | £90,826 | 18% |
311 Properties |
| 1996 | £74,464 | 1% |
150 Properties |
| 1995 | £73,615 | - |
115 Properties |
Property Price per Property Type in South Camberwell
Here you can find historic sold price data in order to help with your property search.
The average Property Paid Price for specific property types in the last three years are:
| Property Type | Average Sold Price | Sold Properties |
|---|---|---|
| Semi Detached House | £1,374,477.00 | 26 Semi Detached Houses |
| Terraced House | £1,004,584.00 | 131 Terraced Houses |
| Flat | £462,818.00 | 424 Flats |
| Detached House | £2,169,084.00 | 11 Detached Houses |

