
Houses for sale in Bold, Widnes
House Prices in Bold
Properties in Bold have an average house price of £488k and had 10 Property Transactions within the last 3 years¹.
Bold is an area in Widnes, St. Helens with 134 households², where the most expensive property was sold for £950k.
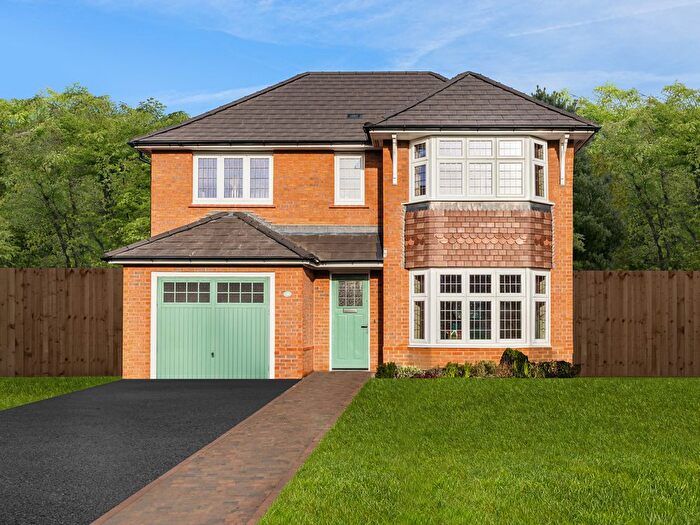
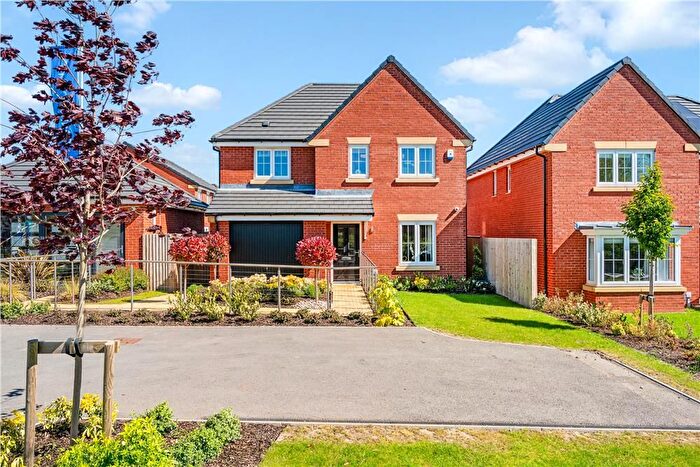
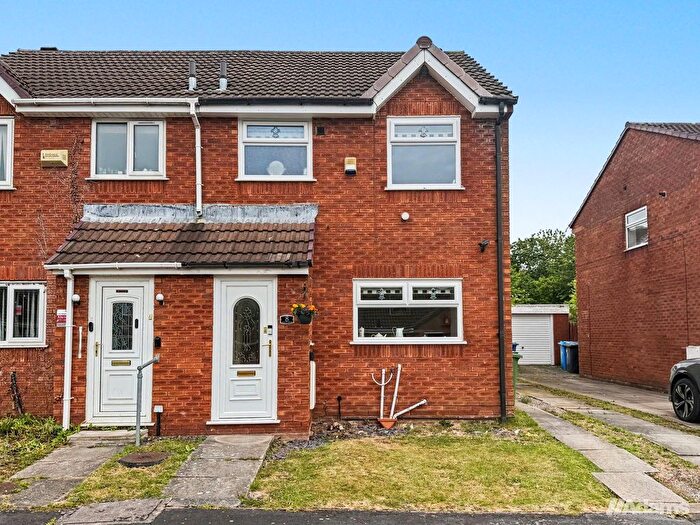
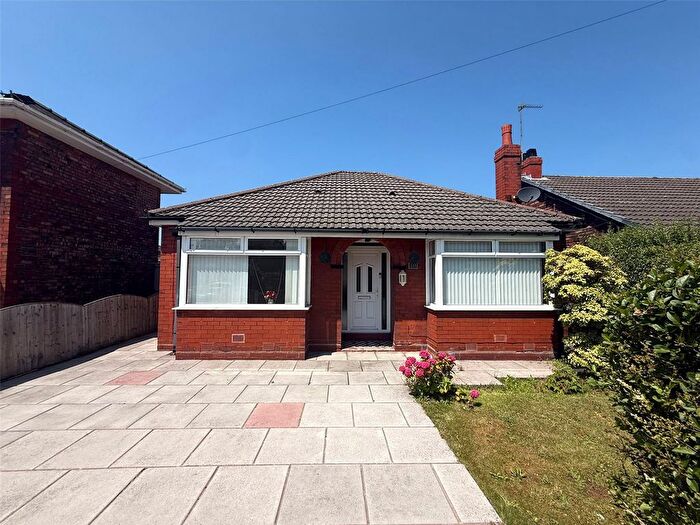
Properties for sale in Bold
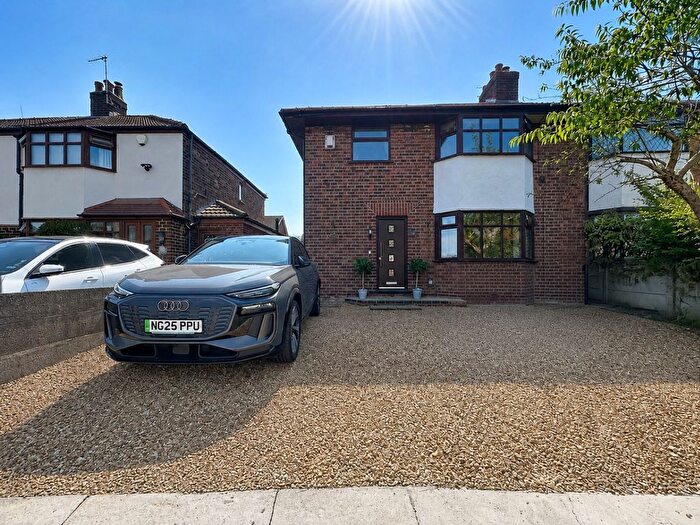
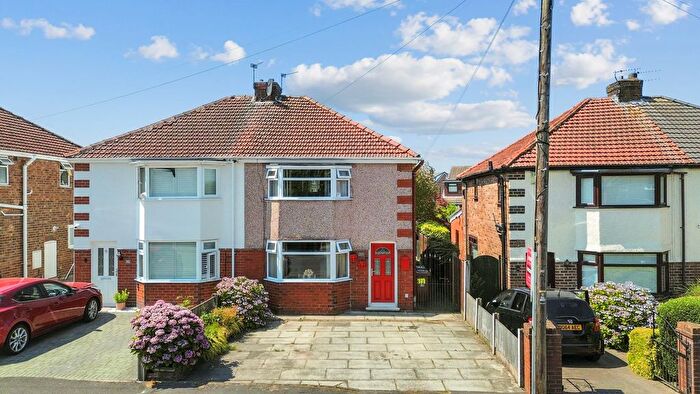
![]()
If you are looking to sell your house, let it out, or receive a property valuation, an expert can help you.
Click the button below to get started.
Roads and Postcodes in Bold
Navigate through our locations to find the location of your next house in Bold, Widnes for sale or to rent.
| Streets | Postcodes |
|---|---|
| Clock Face Road | WA8 3XX WA8 3XH |
| Clockface Road | WA8 3UY |
| Ferndale Close | WA8 3XU |
| Finger House Lane | WA8 3XE WA8 3XF |
| Joy Lane | WA8 3TR |
| Jubits Lane | WA8 5UZ |
| Mill Lane | WA8 3UU |
| Sandy Lane | WA8 3XP WA8 3XR |
| School Lane | WA8 3UZ |
| South Lane | WA8 3TX WA8 3TY |
| Tibbs Cross Lane | WA8 3XB WA8 3XD |
| Twyford Lane | WA8 3UT |
| Union Bank Lane | WA8 5XA WA8 5XB |
| Warrington Road | WA8 3UX WA8 3XA WA8 3XJ WA8 3XL WA8 3XN WA8 3XS WA8 3XT WA8 3XW WA8 5UT WA8 5UX |
Property price trends in Bold
According to the latest Land Registry data, the average home in Bold sold for £190,000 in 2026. That figure comes from 92 sales logged over the past 31 years.
Prices have fallen back over the last three years. Compared with 2023, when the typical sale came in around £473,750, that's a fall of roughly 59.9%.
Looking back five years, average prices are down about 58.7% since 2021, a drop of around £270,000 in cash terms.
Zoom out to the past decade for the fuller picture. Back in 2016, homes here averaged £239,362, so the typical sold price has fallen about 20.6% since then, around 2.3% a year lower. Stretch the view to fifteen years and that annual pace edges up closer to -1.7%.
Frequently asked questions about Bold
What is the average price for a property for sale in Bold?
The average price for a property for sale in Bold is £488,300. There are 645 property listings for sale in Bold.
What streets have the most expensive properties for sale in Bold?
The streets with the most expensive properties for sale in Bold are South Lane at an average of £700,000 and Warrington Road at an average of £529,000.
What streets have the most affordable properties for sale in Bold?
The street with the most affordable properties for sale in Bold is Union Bank Lane at an average of £184,000.
Which train stations are available in or near Bold?
Some of the train stations available in or near Bold are Widnes, Lea Green and Sankey For Penketh.
Property Price Paid in Bold by Year
The average sold property price by year was:
| Year | Average Sold Price | Price Change |
Sold Properties
|
|---|---|---|---|
| 2026 | £190,000 | -92% |
1 Property |
| 2025 | £364,000 | -90% |
2 Properties |
| 2024 | £690,000 | 31% |
3 Properties |
| 2023 | £473,750 | -7% |
4 Properties |
| 2022 | £506,500 | 9% |
2 Properties |
| 2021 | £460,000 | 25% |
1 Property |
| 2019 | £346,250 | 12% |
4 Properties |
| 2018 | £303,100 | -10% |
5 Properties |
| 2017 | £334,625 | 28% |
8 Properties |
| 2016 | £239,362 | 36% |
4 Properties |
Property Price per Property Type in Bold
Here you can find historic sold price data in order to help with your property search.
The average Property Paid Price for specific property types in the last three years are:
| Property Type | Average Sold Price | Sold Properties |
|---|---|---|
| Semi Detached House | £194,500.00 | 4 Semi Detached Houses |
| Detached House | £684,166.00 | 6 Detached Houses |
