
Houses for sale & to rent in TS17 0TG, Whinchat Close, Ingleby Barwick East, Stockton-on-tees
House Prices in TS17 0TG, Whinchat Close, Ingleby Barwick East
Properties in TS17 0TG have no sales history available within the last 3 years. TS17 0TG is a postcode in Whinchat Close located in Ingleby Barwick East, an area in Stockton-on-tees, Stockton-on-Tees, with 8 households².
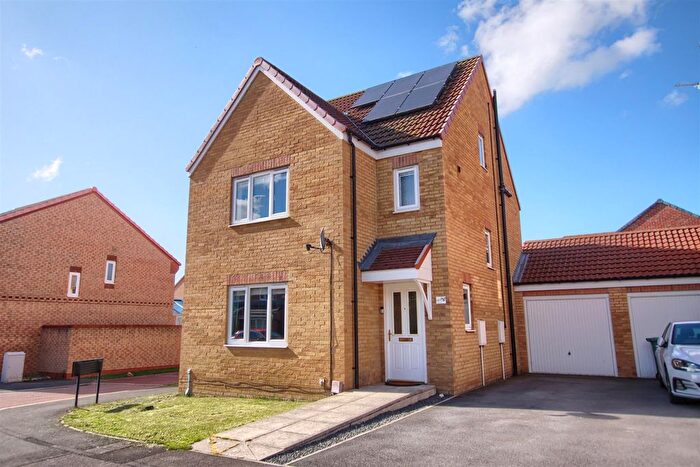
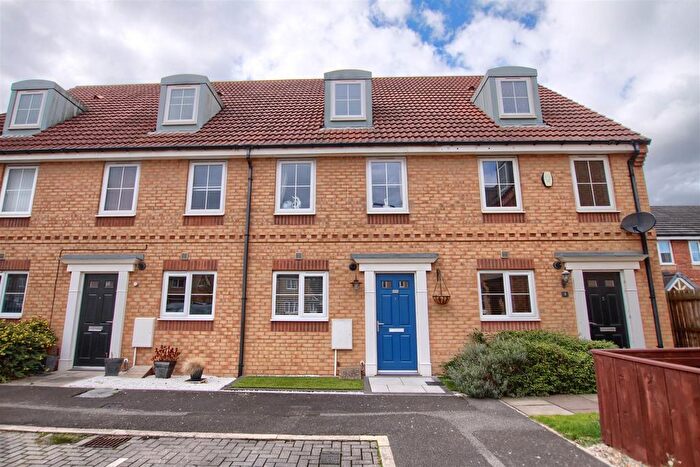
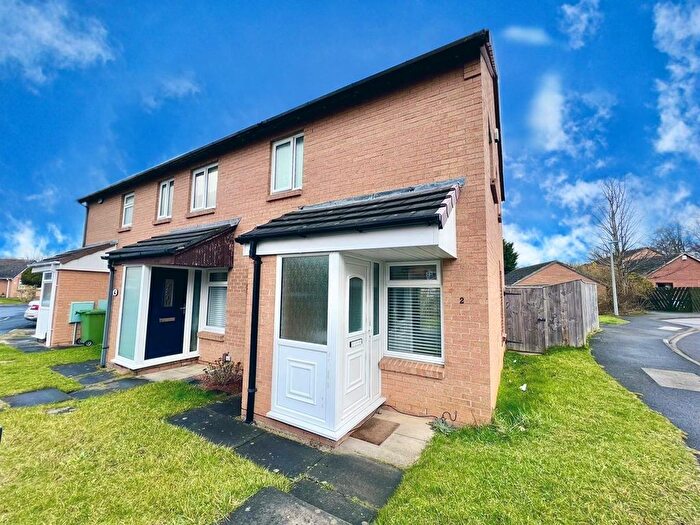
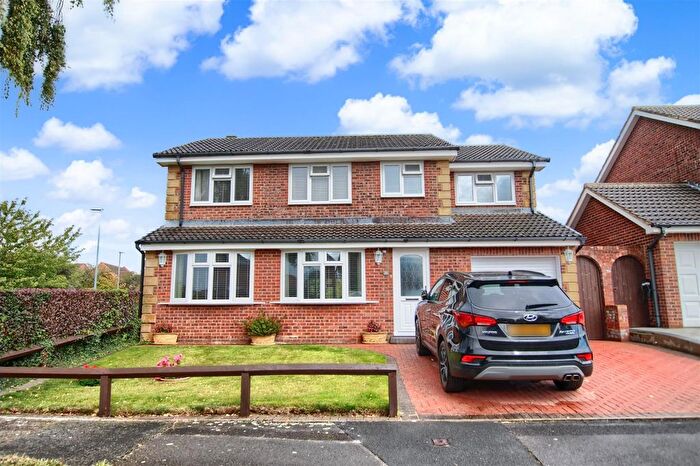
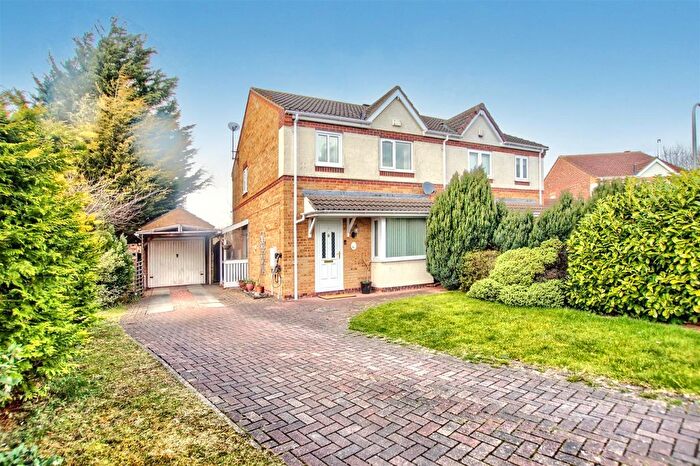
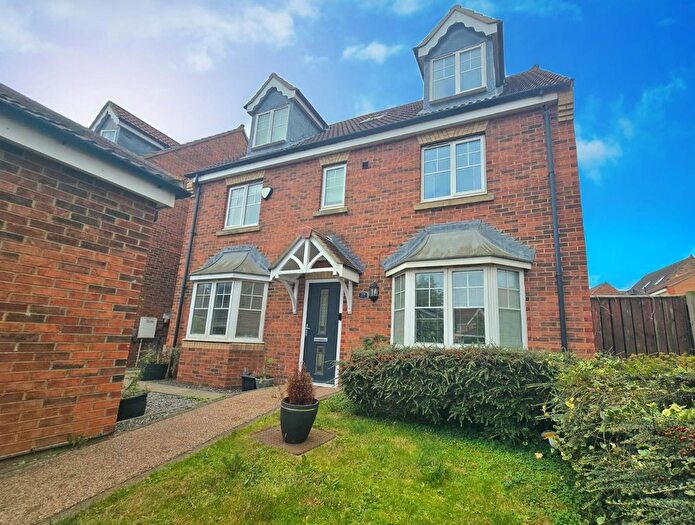
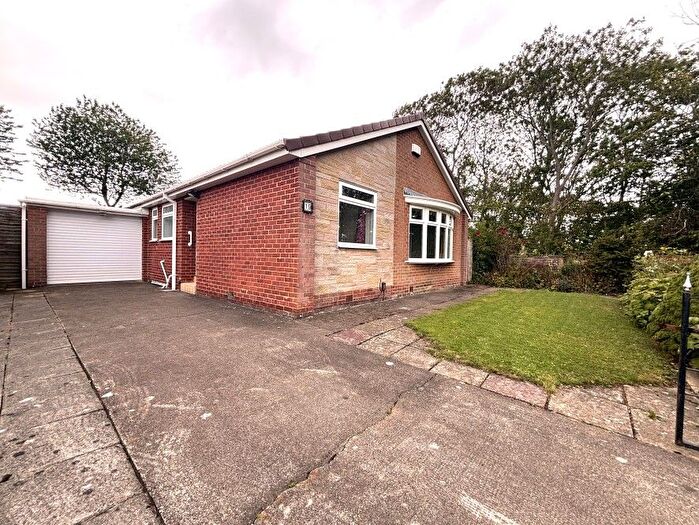
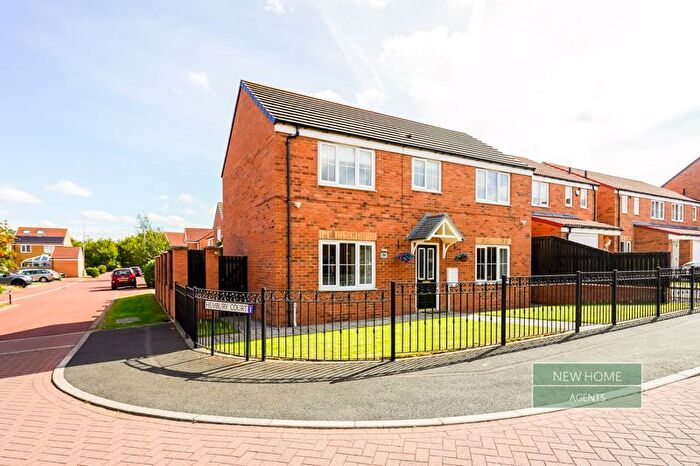
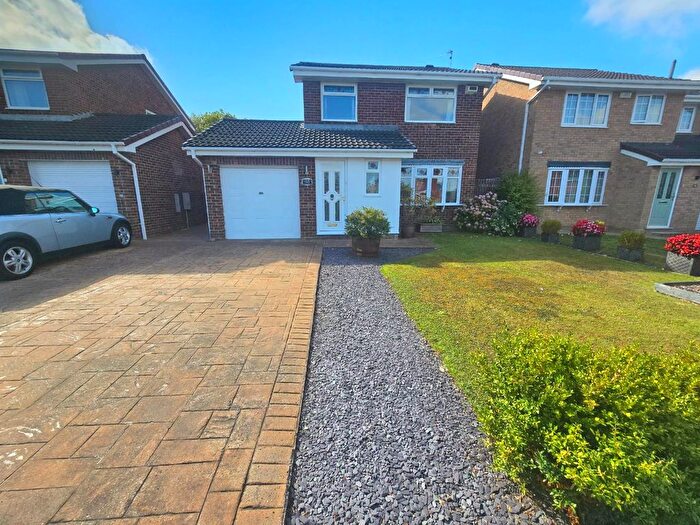
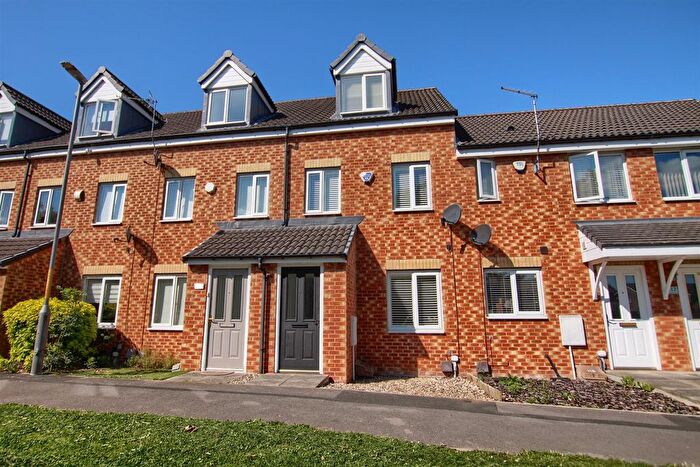
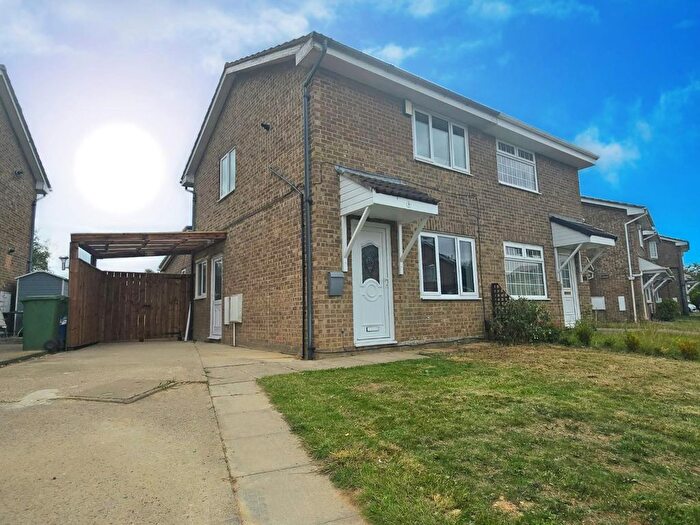
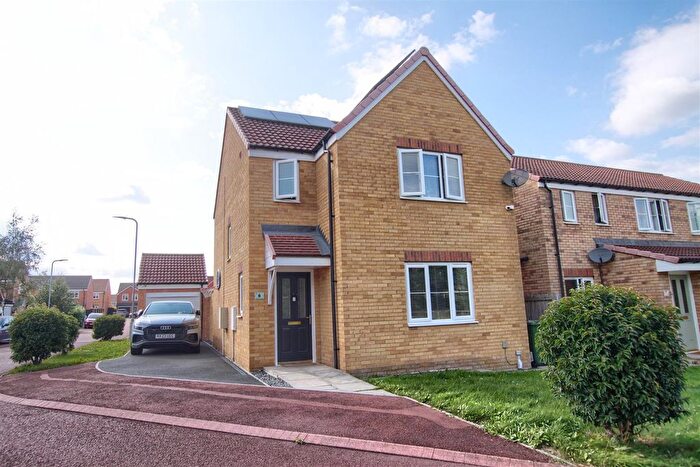
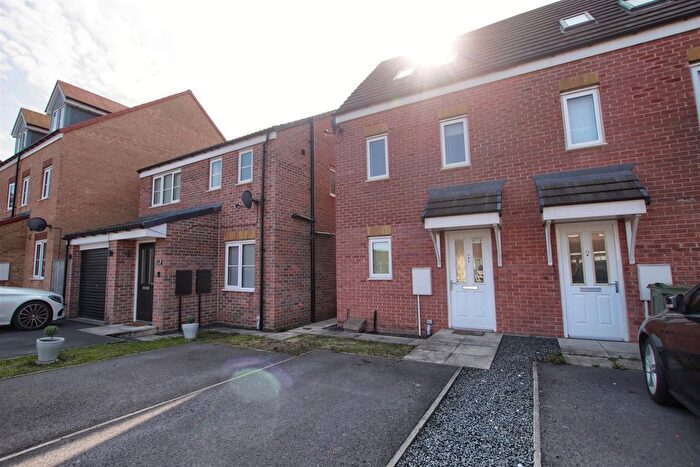
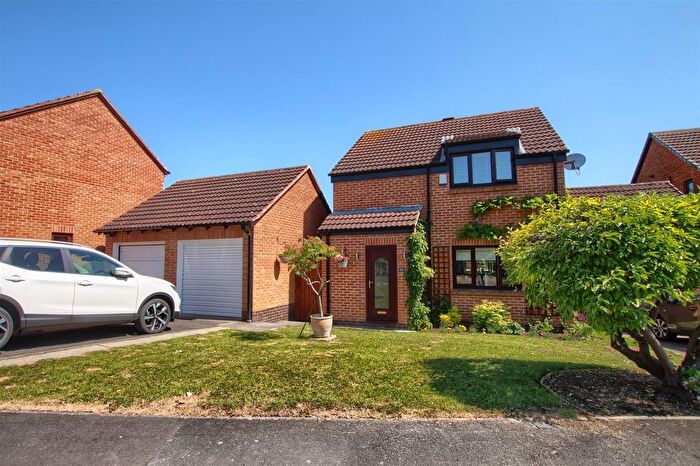
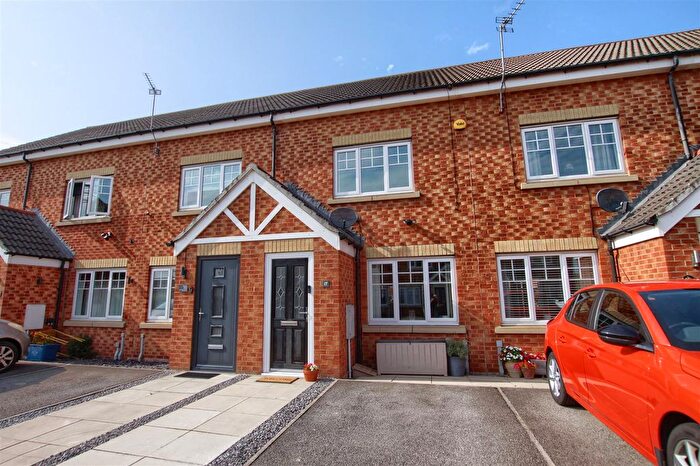
Properties for sale near TS17 0TG, Whinchat Close


![]()
If you are looking to sell your house, let it out, or receive a property valuation, an expert can help you.
Click the button below to get started.


Price Paid in Whinchat Close, TS17 0TG, Ingleby Barwick East
1 Whinchat Close, TS17 0TG, Ingleby Barwick East Stockton-on-tees
Property 1 has been sold 4 times. The last time it was sold was in 02/11/2012 and the sold price was £160,000.00.
This detached house, sold as a freehold on 02/11/2012, is a 101 sqm detached house with an EPC rating of D.
| Date | Price | Property Type | Tenure | Classification |
|---|---|---|---|---|
| 02/11/2012 | £160,000.00 | Detached House | freehold | Established Building |
| 14/09/2011 | £130,000.00 | Detached House | freehold | Established Building |
| 27/06/2002 | £84,950.00 | Detached House | freehold | Established Building |
| 10/03/1995 | £54,000.00 | Detached House | freehold | Established Building |
5 Whinchat Close, TS17 0TG, Ingleby Barwick East Stockton-on-tees
Property 5 has been sold 3 times. The last time it was sold was in 02/10/2012 and the sold price was £139,000.00.
This detached house, sold as a freehold on 02/10/2012, is a 74 sqm detached house with an EPC rating of D.
| Date | Price | Property Type | Tenure | Classification |
|---|---|---|---|---|
| 02/10/2012 | £139,000.00 | Detached House | freehold | Established Building |
| 05/10/1999 | £57,500.00 | Detached House | freehold | Established Building |
| 29/11/1996 | £57,000.00 | Detached House | freehold | Established Building |
Transport near TS17 0TG, Whinchat Close

House price paid reports for TS17 0TG, Whinchat Close
Click on the buttons below to see price paid reports by year or property price:
- Price Paid By Year
Property Price Paid in TS17 0TG, Whinchat Close by Year
The average sold property price by year was:
| Year | Average Sold Price | Price Change |
Sold Properties
|
|---|---|---|---|
| 2012 | £149,500 | 13% |
2 Properties |
| 2011 | £130,000 | 35% |
1 Property |
| 2002 | £84,950 | 32% |
1 Property |
| 1999 | £57,500 | 1% |
1 Property |
| 1996 | £57,000 | 5% |
1 Property |
| 1995 | £54,000 | - |
1 Property |