
Houses for sale & to rent in Newtown, Stockton-on-tees
House Prices in Newtown
Properties in Newtown have an average house price of £99,956.00 and had 308 Property Transactions within the last 3 years¹.
Newtown is an area in Stockton-on-tees, Stockton-on-Tees with 2,983 households², where the most expensive property was sold for £400,000.00.
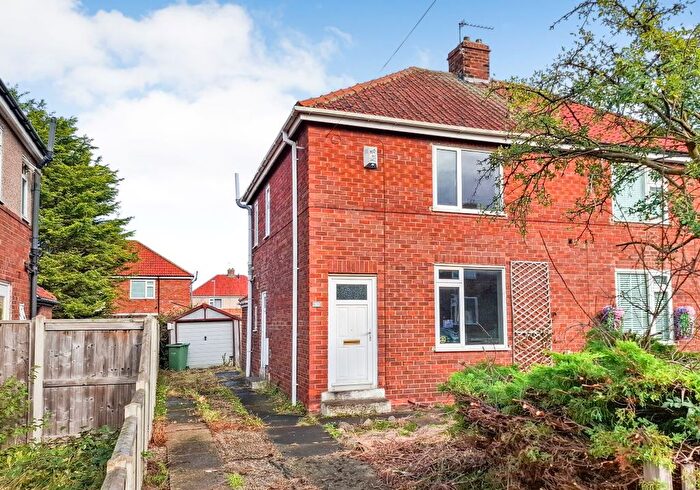
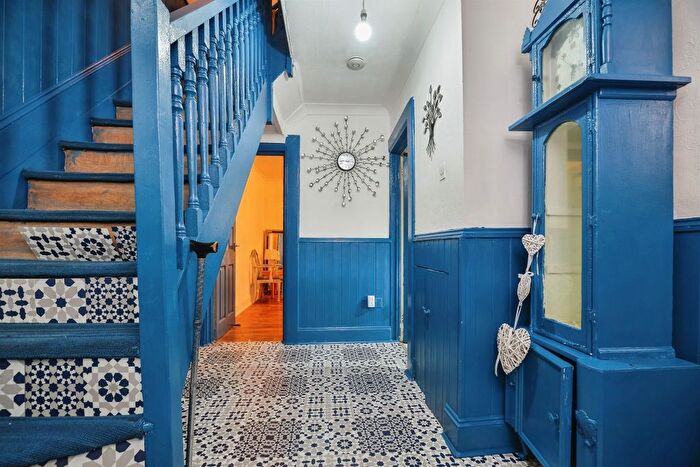
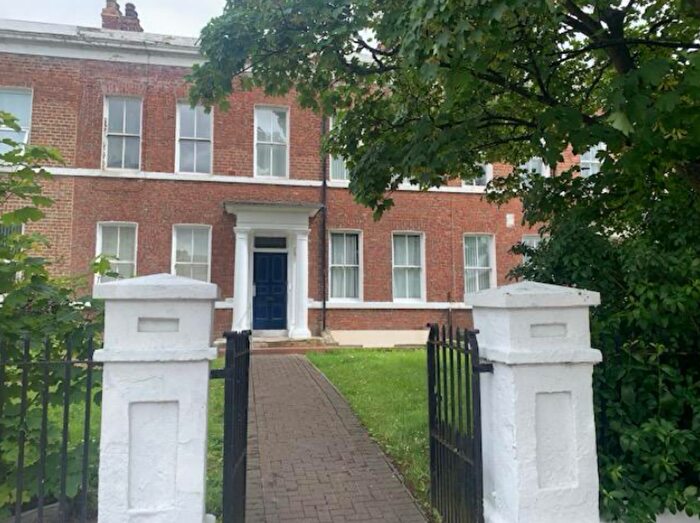
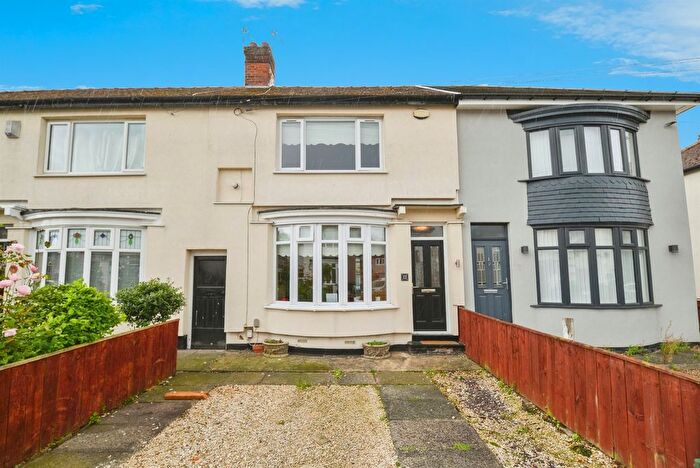
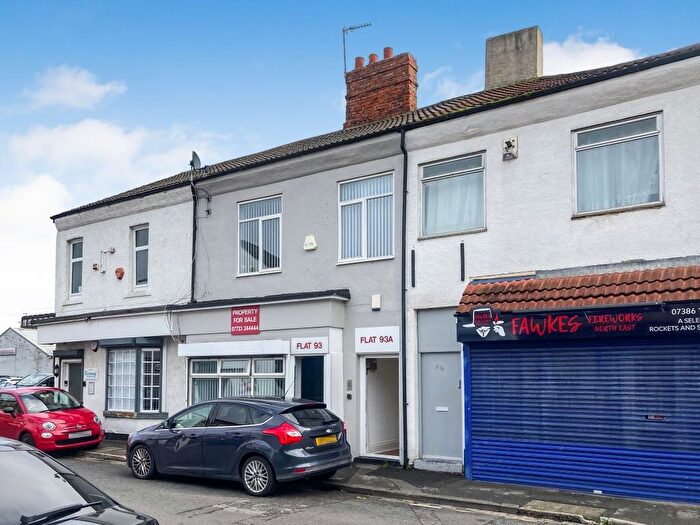
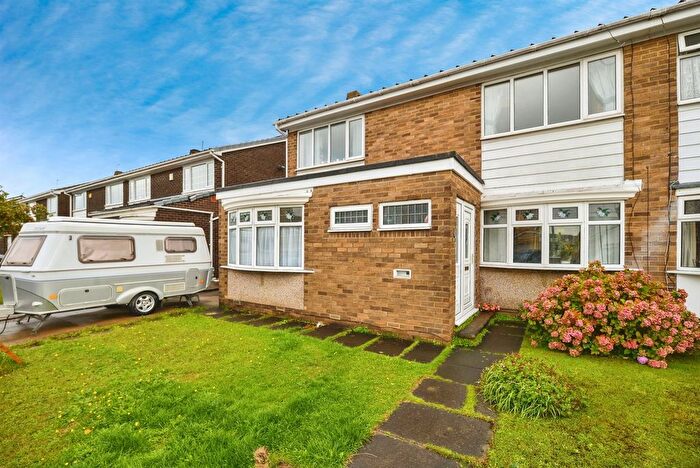
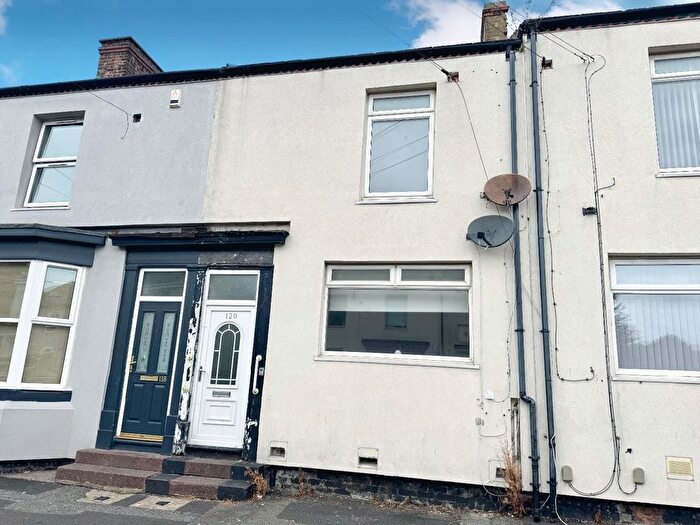
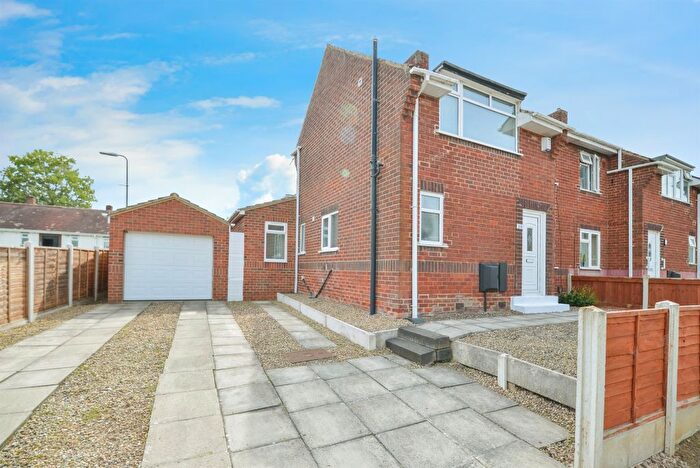
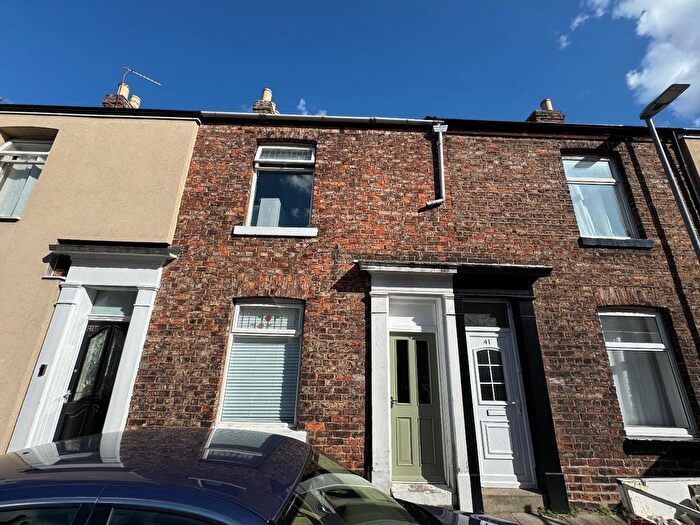
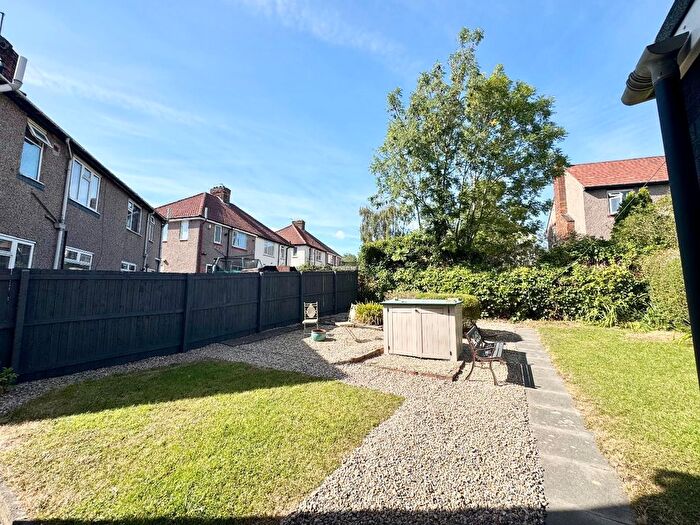
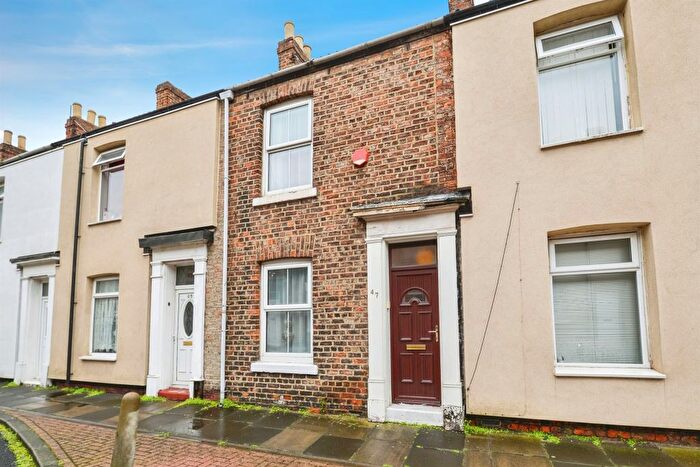
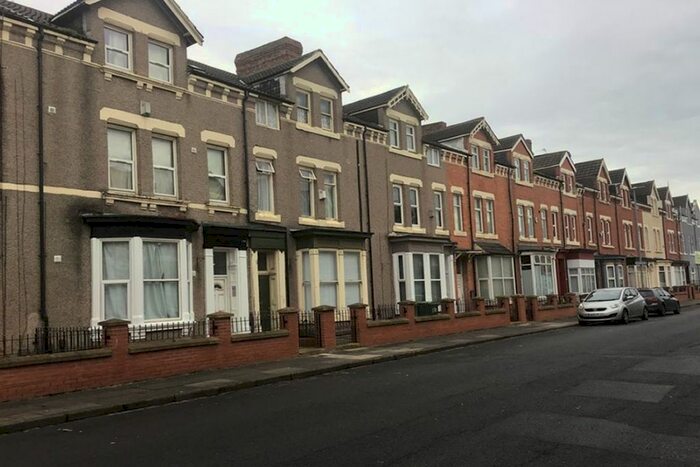
Properties for sale in Newtown
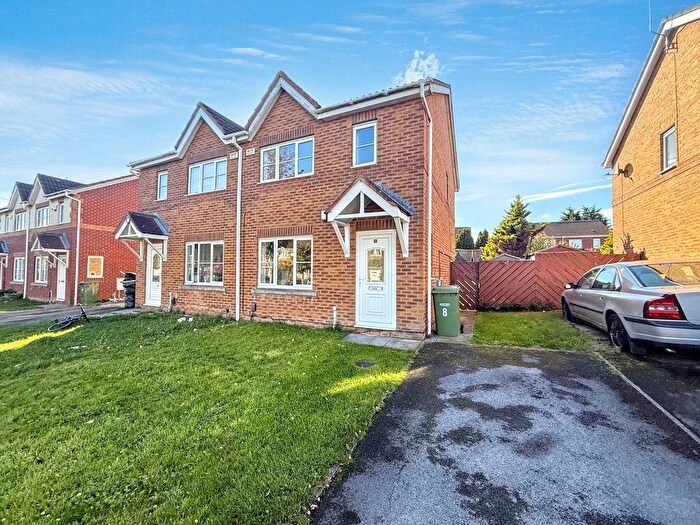
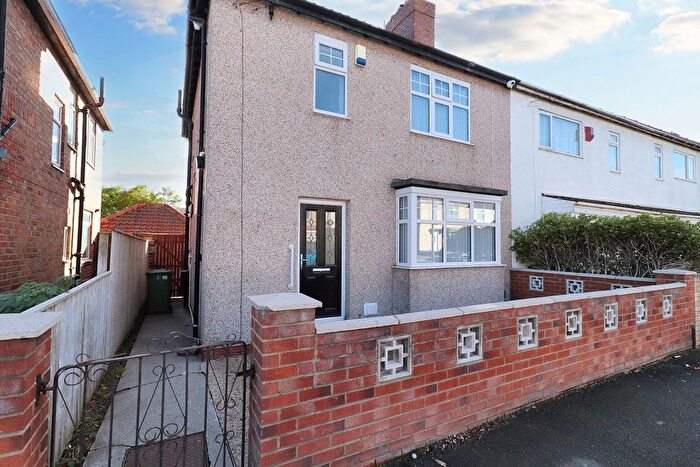
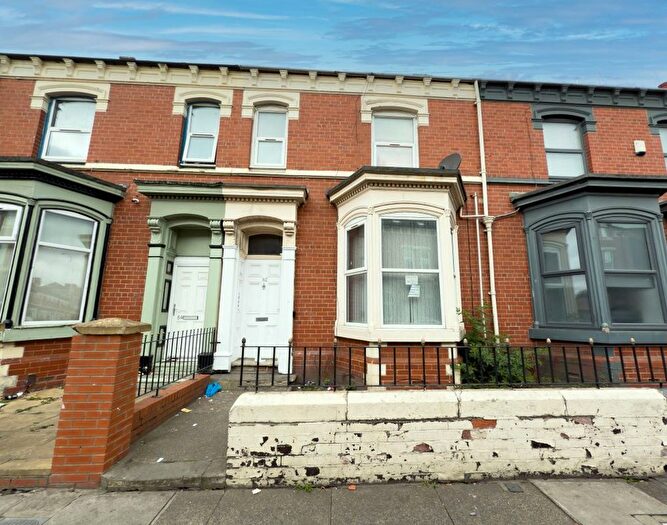
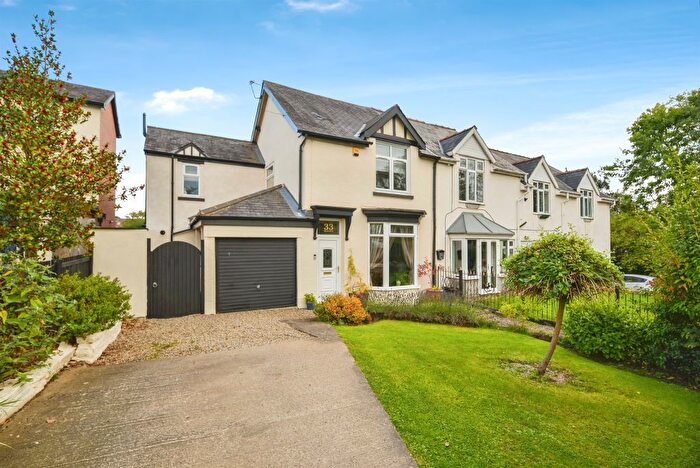
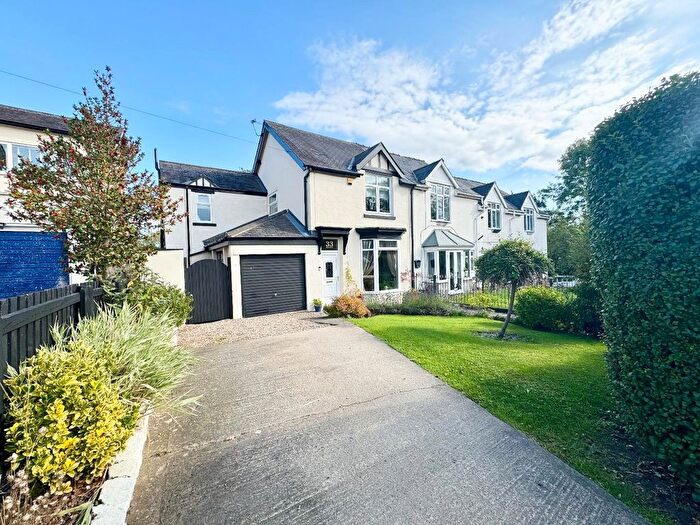

![]()
If you are looking to sell your house, let it out, or receive a property valuation, an expert can help you.
Click the button below to get started.


Roads and Postcodes in Newtown
Navigate through our locations to find the location of your next house in Newtown, Stockton-on-tees for sale or to rent.
Transport near Newtown

- FAQ
- Price Paid By Year
- Property Type Price
Frequently asked questions about Newtown
What is the average price for a property for sale in Newtown?
The average price for a property for sale in Newtown is £99,956. This amount is 40% lower than the average price in Stockton-on-tees. There are 827 property listings for sale in Newtown.
What streets have the most expensive properties for sale in Newtown?
The streets with the most expensive properties for sale in Newtown are Allendale Road at an average of £254,166, Del Strother Avenue at an average of £221,750 and Coniston Road at an average of £221,000.
What streets have the most affordable properties for sale in Newtown?
The streets with the most affordable properties for sale in Newtown are Samuel Street at an average of £49,399, Bedford Street at an average of £53,583 and St Pauls Street at an average of £54,666.
Which train stations are available in or near Newtown?
Some of the train stations available in or near Newtown are Stockton, Thornaby and Billingham.
Property Price Paid in Newtown by Year
The average sold property price by year was:
| Year | Average Sold Price | Price Change |
Sold Properties
|
|---|---|---|---|
| 2025 | £101,851 | 4% |
37 Properties |
| 2024 | £97,982 | -3% |
77 Properties |
| 2023 | £100,972 | 1% |
103 Properties |
| 2022 | £99,705 | -3% |
91 Properties |
| 2021 | £102,312 | 21% |
100 Properties |
| 2020 | £80,684 | -3% |
93 Properties |
| 2019 | £83,056 | 2% |
81 Properties |
| 2018 | £81,668 | 7% |
60 Properties |
| 2017 | £75,877 | -12% |
84 Properties |
| 2016 | £84,603 | 12% |
76 Properties |
| 2015 | £74,401 | -0,1% |
69 Properties |
| 2014 | £74,480 | -22% |
70 Properties |
| 2013 | £90,694 | 10% |
45 Properties |
| 2012 | £81,252 | -0,1% |
38 Properties |
| 2011 | £81,340 | -13% |
61 Properties |
| 2010 | £91,841 | 3% |
55 Properties |
| 2009 | £89,050 | -4% |
45 Properties |
| 2008 | £92,944 | 2% |
75 Properties |
| 2007 | £91,507 | 8% |
146 Properties |
| 2006 | £84,212 | 2% |
159 Properties |
| 2005 | £82,455 | 21% |
140 Properties |
| 2004 | £65,410 | 29% |
169 Properties |
| 2003 | £46,179 | 18% |
160 Properties |
| 2002 | £37,731 | 2% |
184 Properties |
| 2001 | £37,124 | 4% |
139 Properties |
| 2000 | £35,564 | -2% |
124 Properties |
| 1999 | £36,343 | -2% |
123 Properties |
| 1998 | £36,952 | -1% |
107 Properties |
| 1997 | £37,389 | 17% |
82 Properties |
| 1996 | £31,086 | -9% |
98 Properties |
| 1995 | £33,836 | - |
70 Properties |
Property Price per Property Type in Newtown
Here you can find historic sold price data in order to help with your property search.
The average Property Paid Price for specific property types in the last three years are:
| Property Type | Average Sold Price | Sold Properties |
|---|---|---|
| Semi Detached House | £124,922.00 | 128 Semi Detached Houses |
| Detached House | £258,642.00 | 7 Detached Houses |
| Terraced House | £75,063.00 | 173 Terraced Houses |