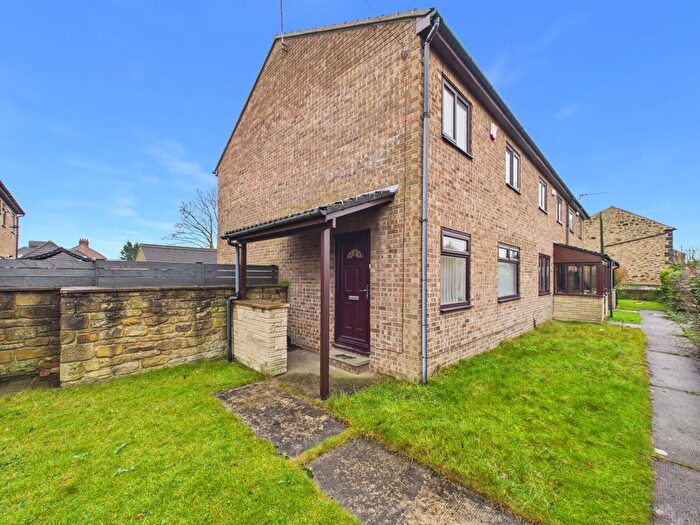
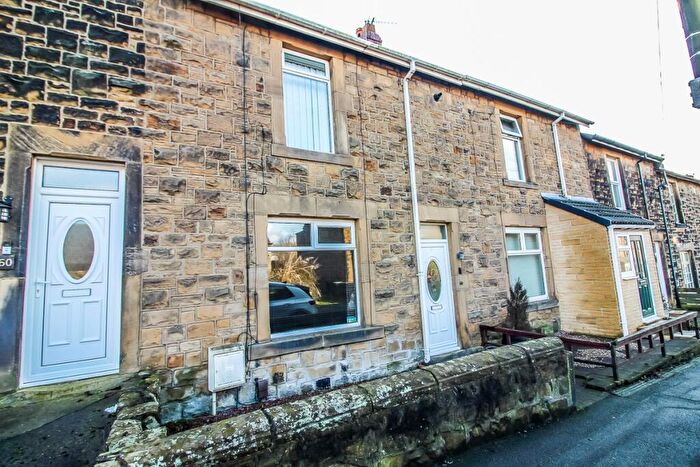
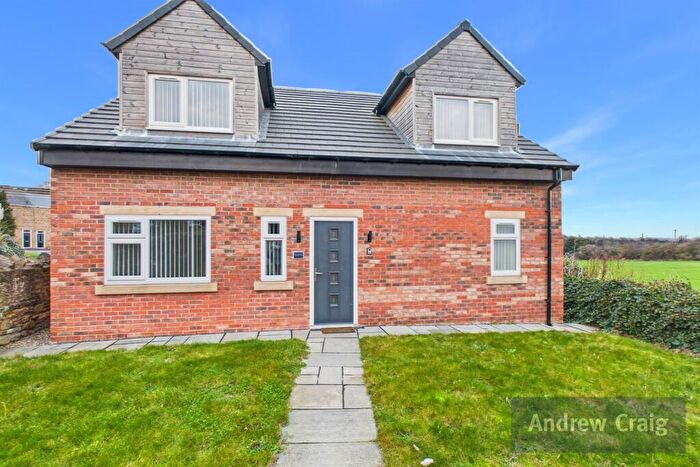
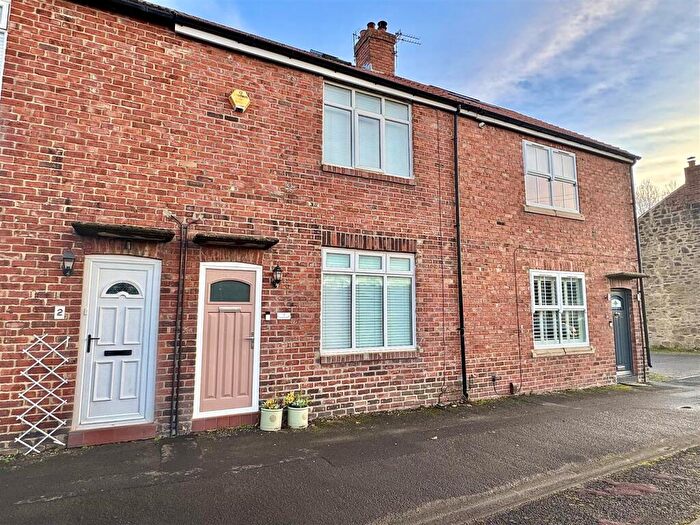
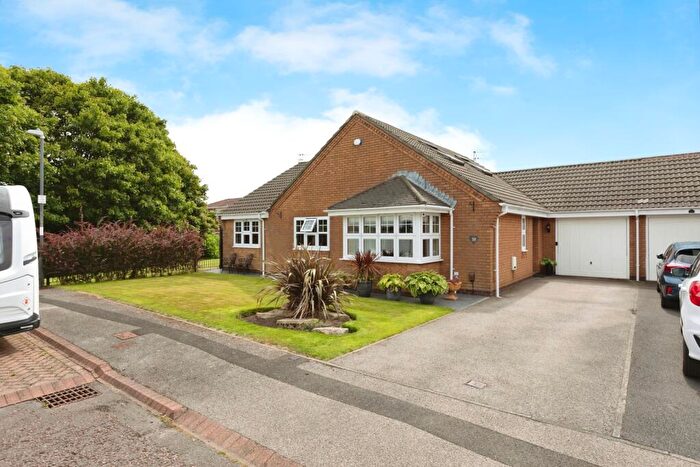
Houses for sale & to rent in Washington West, Gateshead
House Prices in Washington West
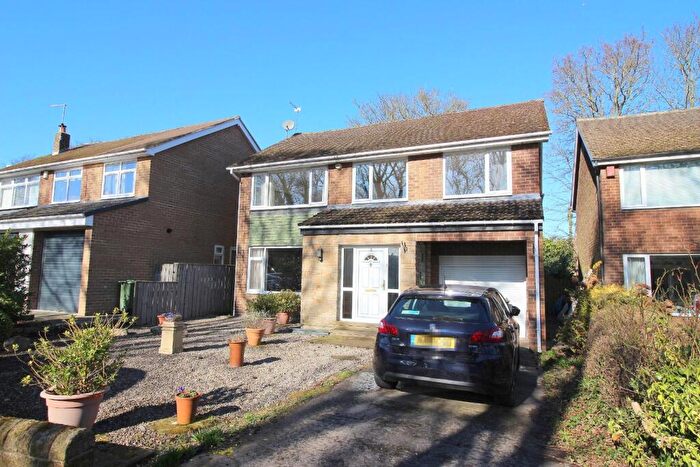
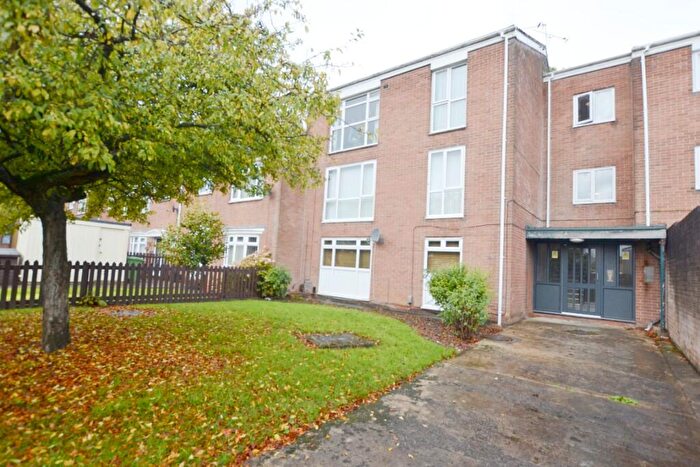
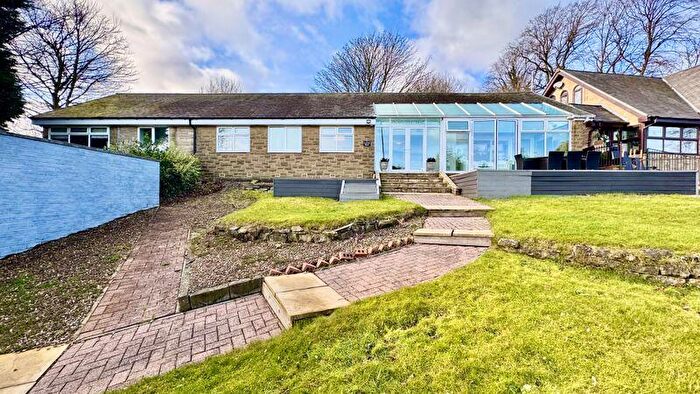
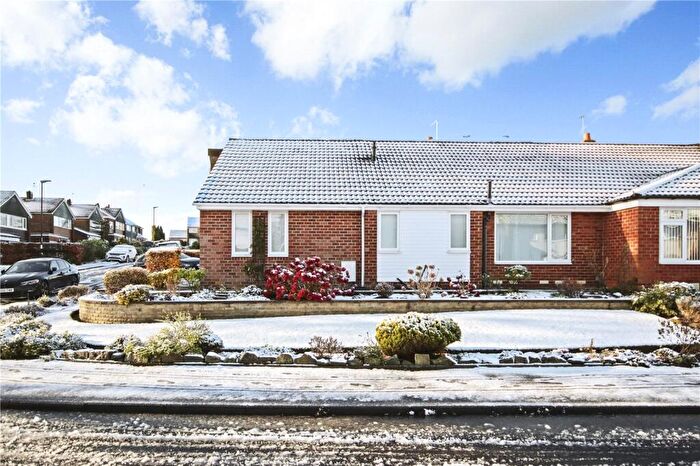
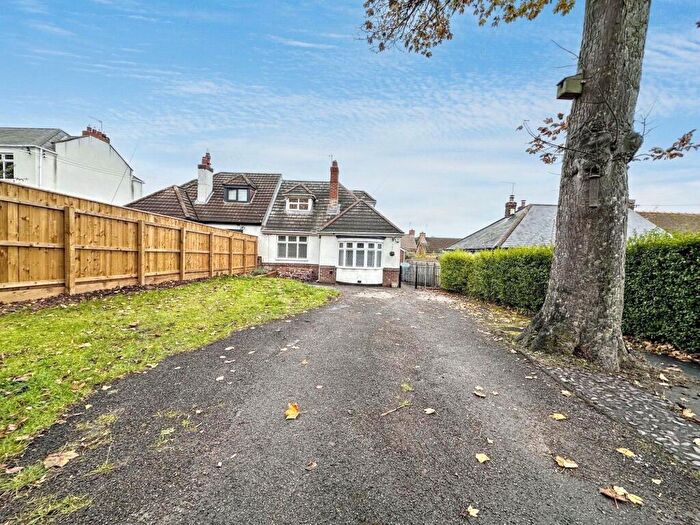
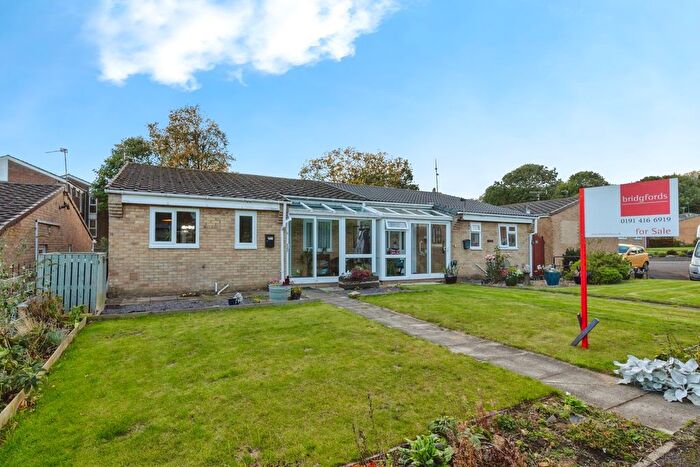
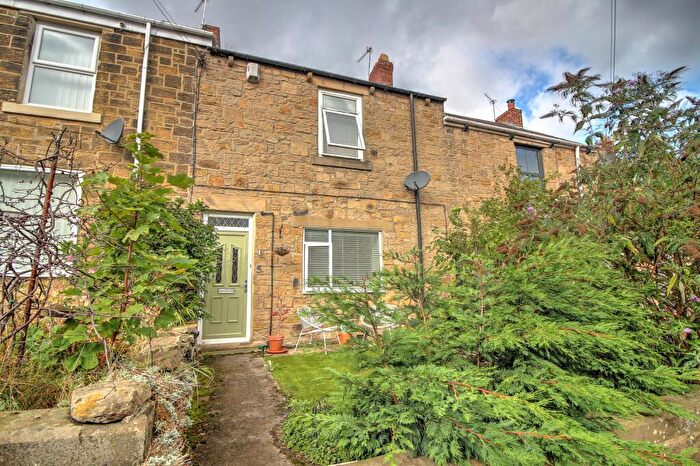
Properties in Washington West have an average house price of £173,155.00 and had 94 Property Transactions within the last 3 years¹.
Washington West is an area in Gateshead, Sunderland with 884 households², where the most expensive property was sold for £575,000.00.
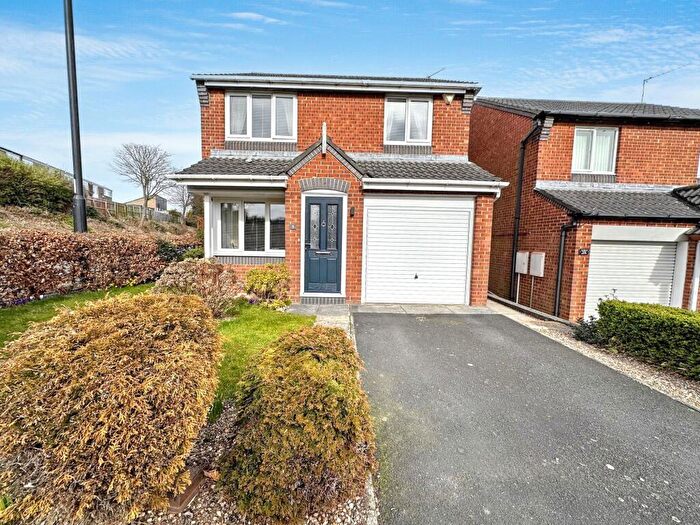
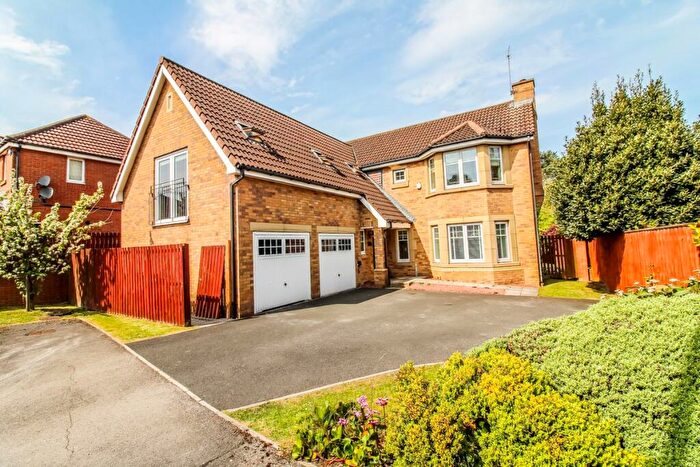
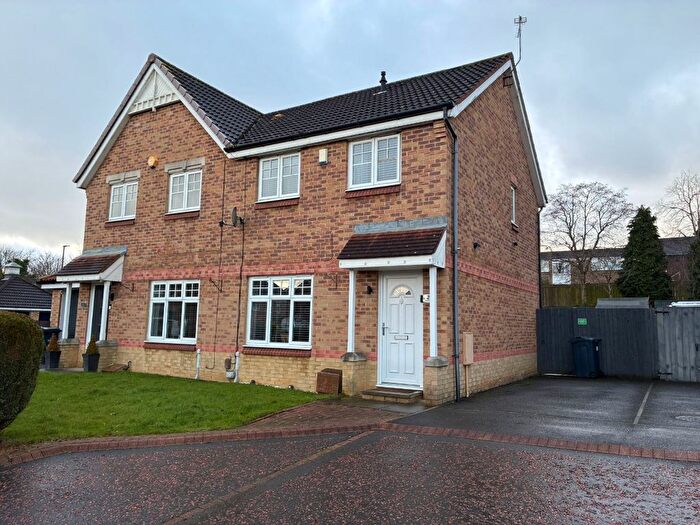
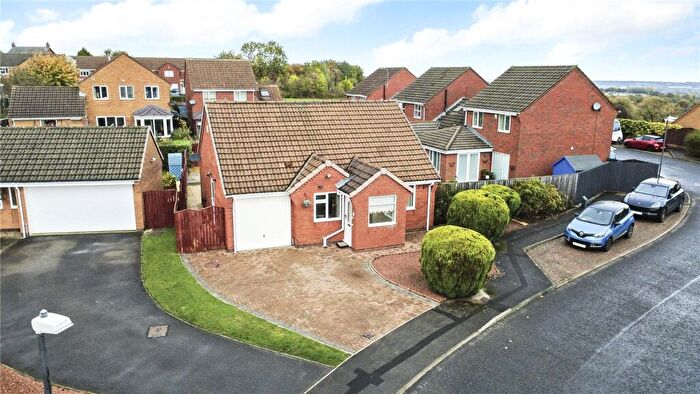
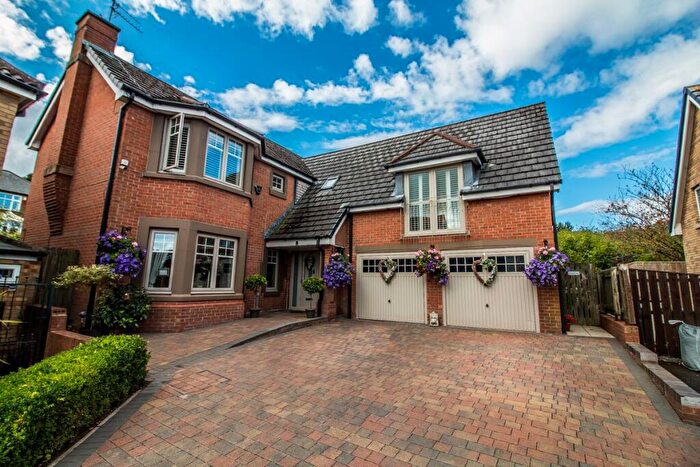
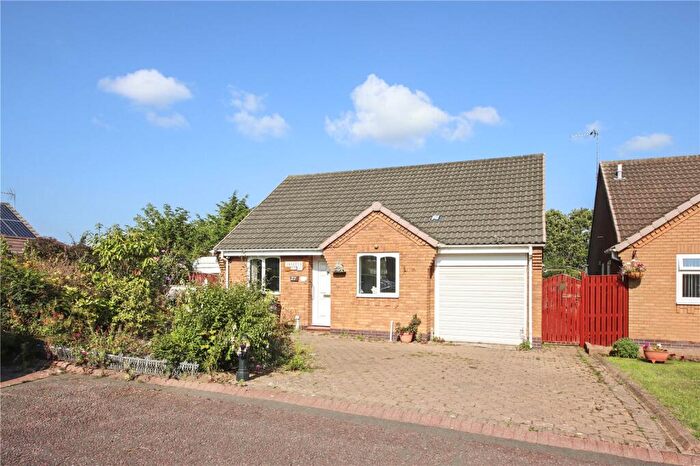
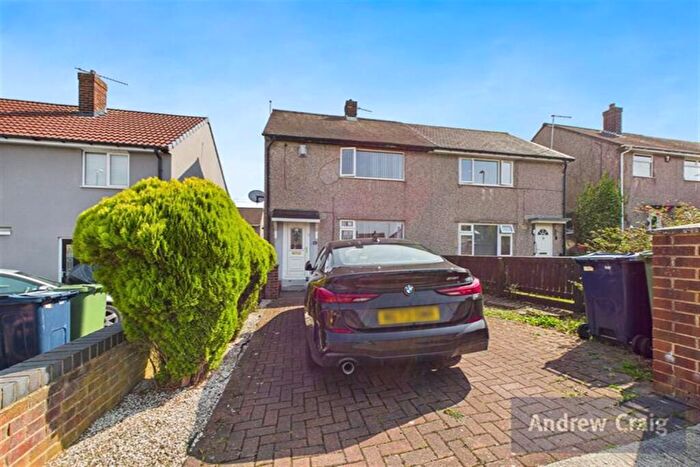
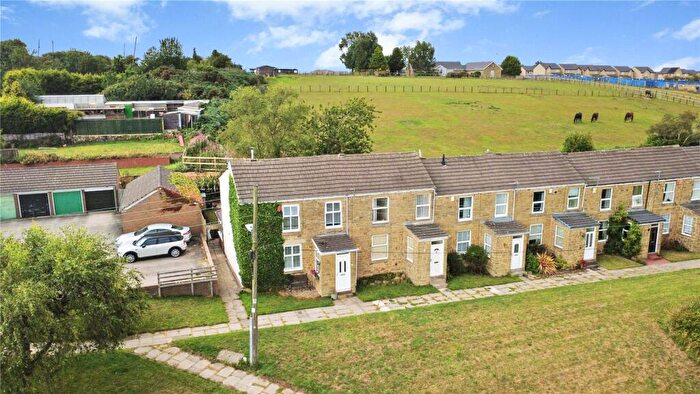
Properties for sale in Washington West
Previously listed properties in Washington West
Roads and Postcodes in Washington West
Navigate through our locations to find the location of your next house in Washington West, Gateshead for sale or to rent.
| Streets | Postcodes |
|---|---|
| Albion Terrace | NE9 7RJ |
| Aldsworth Close | NE9 7PF NE9 7PG |
| Alexandra Terrace | NE9 7PD |
| Angel Rise | NE9 7FD |
| Ashfield Terrace | NE9 7QT |
| Badger Mews | NE9 7QG |
| Beech Grove | NE9 7RD NE9 7RE |
| Belle View Terrace | NE9 7PJ |
| Belmont Terrace | NE9 7QU |
| Blackberry Cottages | NE9 7PL |
| Blackfell | DH3 1RE |
| Bowes Gardens | NE9 7NZ |
| Broom Court | NE9 7SZ |
| Carlton Terrace | NE9 7SB |
| Charlbury Close | NE9 7NL |
| Claremont Terrace | NE9 7RT |
| Clifton Court | NE9 7QH |
| Coronation Terrace | NE9 7SA |
| Daisy Hill Cottages | NE9 7PQ |
| Edgehill Villas | NE9 7NX |
| Fairhaven | NE9 7QZ |
| Fell Place | NE9 7RL |
| Fell Road | NE9 7RP |
| Ferndale Terrace | NE9 7RH |
| Hawthorn Terrace | NE9 7SN |
| Heather Hill | NE9 7QX |
| Heugh Hill | NE9 7NR NE9 7NS |
| Highbury Avenue | NE9 7PX |
| Highbury Close | NE9 7PU |
| Highworth Drive | NE9 7NN NE9 7NP NE9 7NW |
| Hunters Terrace | NE9 7RU |
| Kings Terrace | NE9 7SD |
| Linden Terrace | NE9 7PP |
| Lismore Terrace | NE9 7PS |
| Makepeace Terrace | NE9 7RR |
| Meadowfield | NE9 7QL |
| Milton Place | NE9 7RA |
| Mitchell Buildings | NE9 7NY |
| Mount House Drive | NE9 7UF |
| Mount Lane | NE9 7UQ |
| Mount Lonnen | NE9 7UZ |
| Mount Park Road | NE9 7FB |
| Oakwood Close | NE9 7SX |
| Park View | NE9 7RF |
| Peareth Edge | NE9 7RQ |
| Peareth Hall Road | NE9 7NT NE9 7NU |
| Penshaw View | NE9 7PT |
| Prospect Cottages | NE9 7PN |
| Railway Close | NE9 7RG |
| Red Bungalows | NE9 7QR |
| Rosebank Cottages | NE9 7PB |
| Shelley Avenue | NE9 7QY |
| Somerford | NE9 7QW |
| South View | NE9 7PY |
| Springfield Terrace | NE9 7PE |
| Springwell Road | NE9 7QJ NE9 7SQ NE9 7XW |
| Stafford Villas | NE9 7SL |
| Stoney Lane | NE9 7SJ |
| Sycamore Grove | NE9 7SE |
| The Bungalows | NE9 7RY |
| Underhill Terrace | NE9 7PA |
| Uplands Way | NE9 7NQ |
| Victoria Terrace | NE9 7PH |
| West View | NE9 7QQ |
| West View Back | NE9 7QP |
| Westfield Crescent | NE9 7RX |
| Westfield Terrace | NE9 7QS |
| Whitley Close | NE9 7FA |
| Windsor Terrace | NE9 7QN |
| Wingrove Terrace | NE9 7RS |
| Winston Court | NE9 7ST |
| Woodbine Cottages | NE9 7PR |
| Wordsworth Crescent | NE9 7RB |
| NE9 7RN NE9 7PZ NE9 7SH NE9 7YT NE9 7YX |
Transport near Washington West
- FAQ
- Price Paid By Year
- Property Type Price
Frequently asked questions about Washington West
What is the average price for a property for sale in Washington West?
The average price for a property for sale in Washington West is £173,155. There are 265 property listings for sale in Washington West.
What streets have the most expensive properties for sale in Washington West?
The streets with the most expensive properties for sale in Washington West are Peareth Hall Road at an average of £413,500, Uplands Way at an average of £410,000 and Fairhaven at an average of £355,000.
What streets have the most affordable properties for sale in Washington West?
The streets with the most affordable properties for sale in Washington West are Claremont Terrace at an average of £95,000, Linden Terrace at an average of £99,000 and Belle View Terrace at an average of £107,000.
Which train stations are available in or near Washington West?
Some of the train stations available in or near Washington West are Heworth, Dunston and Manors.
Property Price Paid in Washington West by Year
The average sold property price by year was:
| Year | Average Sold Price | Price Change |
Sold Properties
|
|---|---|---|---|
| 2025 | £195,534 | 15% |
24 Properties |
| 2024 | £166,992 | 2% |
39 Properties |
| 2023 | £163,585 | -7% |
31 Properties |
| 2022 | £174,674 | -1% |
38 Properties |
| 2021 | £175,779 | 15% |
46 Properties |
| 2020 | £148,945 | 2% |
44 Properties |
| 2019 | £145,401 | -1% |
36 Properties |
| 2018 | £146,525 | 5% |
41 Properties |
| 2017 | £138,792 | -3% |
34 Properties |
| 2016 | £142,757 | -8% |
35 Properties |
| 2015 | £153,631 | -3% |
43 Properties |
| 2014 | £158,846 | 7% |
54 Properties |
| 2013 | £147,015 | -4% |
48 Properties |
| 2012 | £152,403 | 23% |
47 Properties |
| 2011 | £117,209 | -16% |
27 Properties |
| 2010 | £135,847 | -6% |
21 Properties |
| 2009 | £144,616 | -6% |
25 Properties |
| 2008 | £153,197 | -3% |
17 Properties |
| 2007 | £157,201 | 8% |
40 Properties |
| 2006 | £144,439 | 11% |
55 Properties |
| 2005 | £128,935 | -12% |
31 Properties |
| 2004 | £143,948 | 29% |
44 Properties |
| 2003 | £101,659 | 19% |
66 Properties |
| 2002 | £82,671 | 22% |
50 Properties |
| 2001 | £64,861 | 12% |
47 Properties |
| 2000 | £56,794 | 14% |
40 Properties |
| 1999 | £48,734 | 1% |
45 Properties |
| 1998 | £48,150 | -5% |
45 Properties |
| 1997 | £50,675 | 14% |
52 Properties |
| 1996 | £43,818 | 4% |
41 Properties |
| 1995 | £41,893 | - |
34 Properties |
Property Price per Property Type in Washington West
Here you can find historic sold price data in order to help with your property search.
The average Property Paid Price for specific property types in the last three years are:
| Property Type | Average Sold Price | Sold Properties |
|---|---|---|
| Semi Detached House | £164,869.00 | 31 Semi Detached Houses |
| Detached House | £336,416.00 | 12 Detached Houses |
| Terraced House | £141,440.00 | 47 Terraced Houses |
| Flat | £120,250.00 | 4 Flats |

