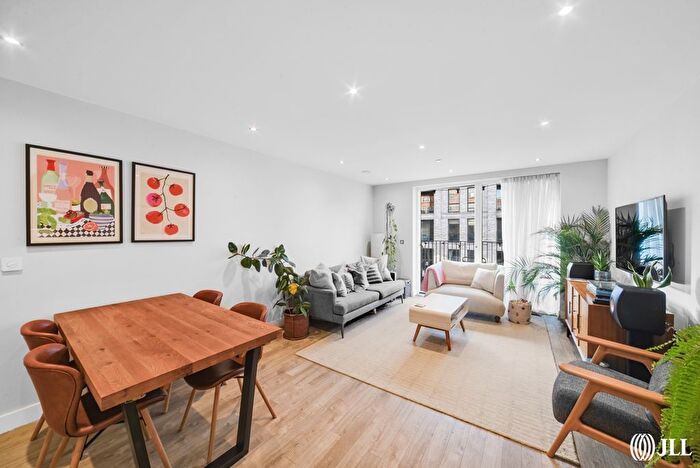
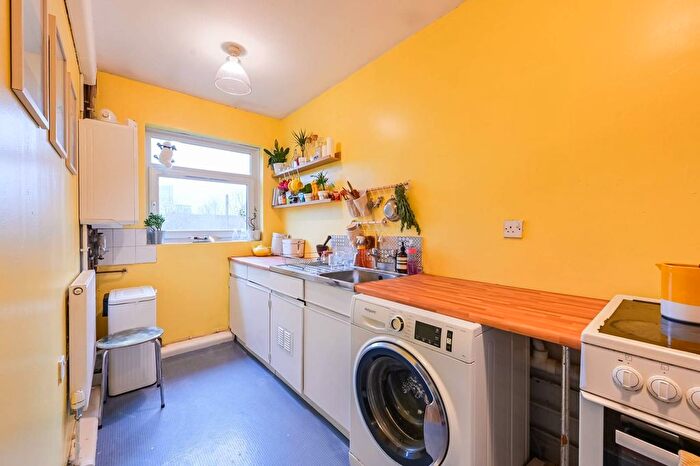
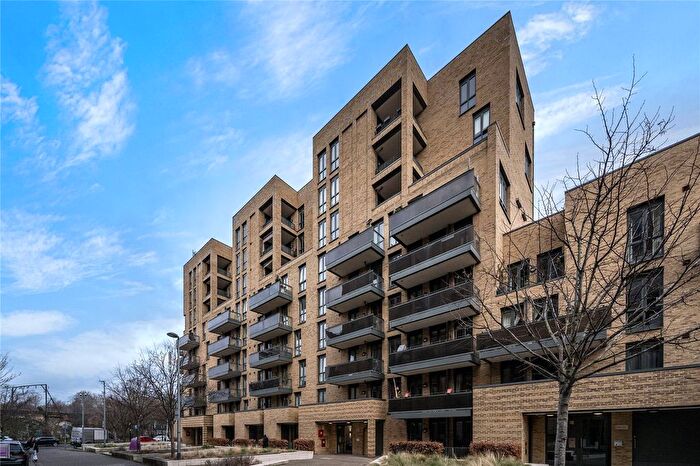
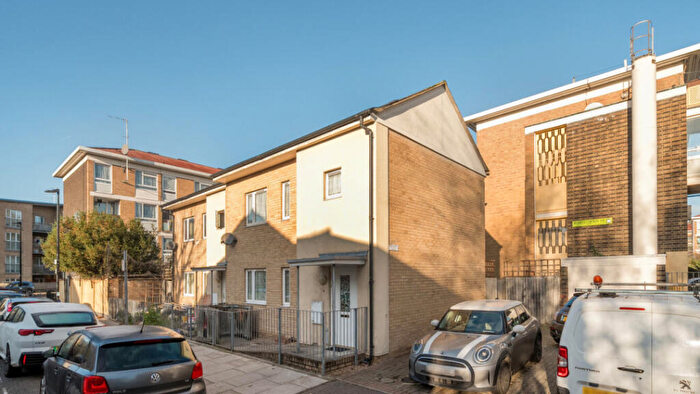
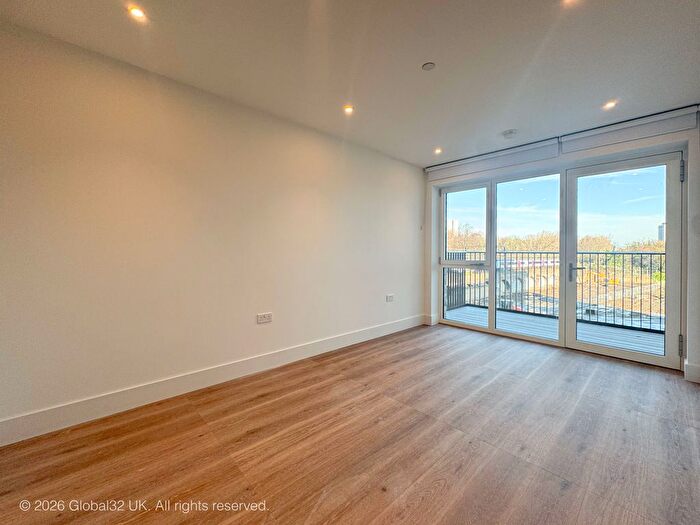
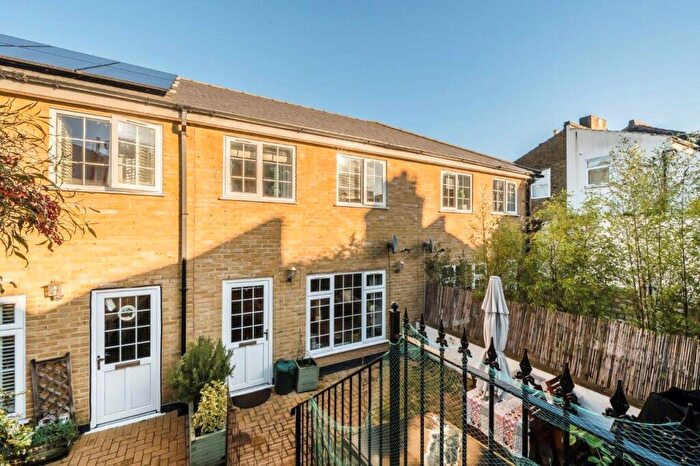
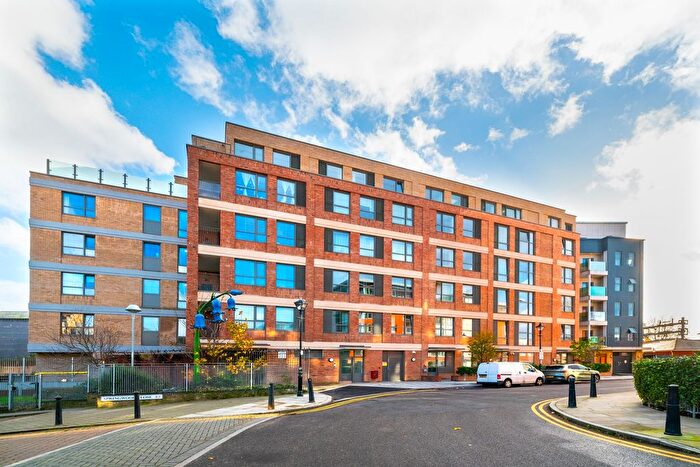
Houses for sale & to rent in Bromley South, London
House Prices in Bromley South
Properties in this part of Bromley South within London have an average house price of £362,613.00 and had 407 Property Transactions within the last 3 years¹. This area has 3,026 households² , where the most expensive property was sold for £815,000.00.
Properties for sale in Bromley South
Roads and Postcodes in Bromley South
Navigate through our locations to find the location of your next house in Bromley South, London for sale or to rent.
Transport near Bromley South
-
Devons Road Station
-
Langdon Park Station
-
Bromley-by-Bow Station
-
Bow Church Station
-
Bow Road Station
-
Mile End Station
-
All Saints Station
-
Westferry Station
-
Pudding Mill Lane Station
-
Poplar Station
- FAQ
- Price Paid By Year
- Property Type Price
Frequently asked questions about Bromley South
What is the average price for a property for sale in Bromley South?
The average price for a property for sale in Bromley South is £362,613. This amount is 31% lower than the average price in London. There are 7,136 property listings for sale in Bromley South.
What streets have the most expensive properties for sale in Bromley South?
The streets with the most expensive properties for sale in Bromley South are Swaton Road at an average of £530,608, Reeves Road at an average of £521,000 and Knapp Road at an average of £483,249.
What streets have the most affordable properties for sale in Bromley South?
The streets with the most affordable properties for sale in Bromley South are Devas Street at an average of £219,750, Watts Grove at an average of £222,210 and Chiltern Road at an average of £223,149.
Which tube stations are available in or near Bromley South?
Some of the tube stations available in or near Bromley South are Bromley-by-Bow, Bow Church and Bow Road.
Property Price Paid in Bromley South by Year
The average sold property price by year was:
| Year | Average Sold Price | Price Change |
Sold Properties
|
|---|---|---|---|
| 2025 | £386,904 | 6% |
63 Properties |
| 2024 | £361,919 | 0,4% |
124 Properties |
| 2023 | £360,297 | 2% |
113 Properties |
| 2022 | £351,562 | 2% |
107 Properties |
| 2021 | £344,904 | -9% |
144 Properties |
| 2020 | £377,487 | 3% |
62 Properties |
| 2019 | £365,355 | -2% |
103 Properties |
| 2018 | £374,236 | -3% |
164 Properties |
| 2017 | £385,538 | 8% |
198 Properties |
| 2016 | £355,397 | 4% |
300 Properties |
| 2015 | £340,296 | 5% |
200 Properties |
| 2014 | £321,706 | 9% |
289 Properties |
| 2013 | £291,907 | 3% |
309 Properties |
| 2012 | £282,859 | 10% |
300 Properties |
| 2011 | £253,410 | 2% |
215 Properties |
| 2010 | £249,099 | -6% |
136 Properties |
| 2009 | £265,065 | 13% |
91 Properties |
| 2008 | £231,743 | 4% |
56 Properties |
| 2007 | £223,404 | -1% |
72 Properties |
| 2006 | £225,760 | 17% |
205 Properties |
| 2005 | £186,586 | 3% |
106 Properties |
| 2004 | £180,068 | 8% |
90 Properties |
| 2003 | £165,299 | 19% |
65 Properties |
| 2002 | £133,108 | 11% |
73 Properties |
| 2001 | £118,946 | 18% |
51 Properties |
| 2000 | £97,870 | 14% |
27 Properties |
| 1999 | £84,109 | 39% |
37 Properties |
| 1998 | £51,032 | 2% |
31 Properties |
| 1997 | £49,940 | 6% |
32 Properties |
| 1996 | £46,791 | 3% |
29 Properties |
| 1995 | £45,476 | - |
21 Properties |
Property Price per Property Type in Bromley South
Here you can find historic sold price data in order to help with your property search.
The average Property Paid Price for specific property types in the last three years are:
| Property Type | Average Sold Price | Sold Properties |
|---|---|---|
| Flat | £347,738.00 | 386 Flats |
| Terraced House | £636,026.00 | 21 Terraced Houses |

