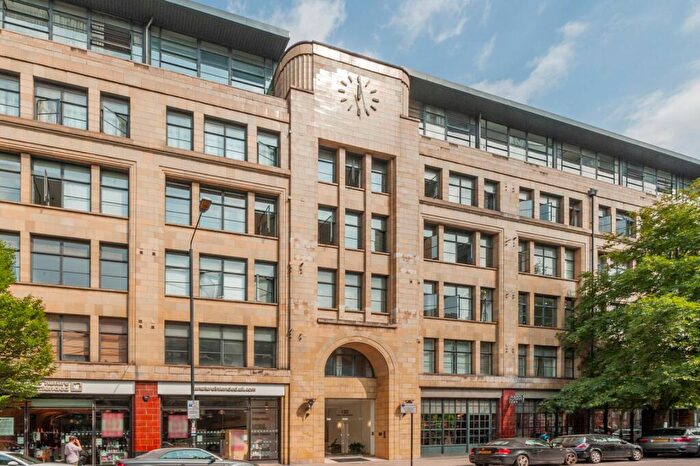
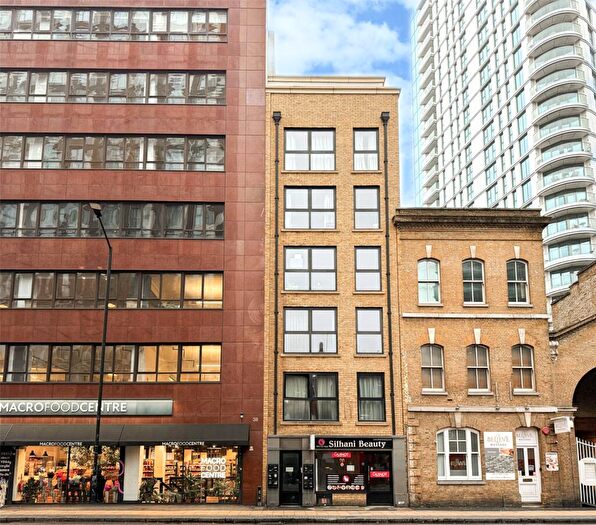
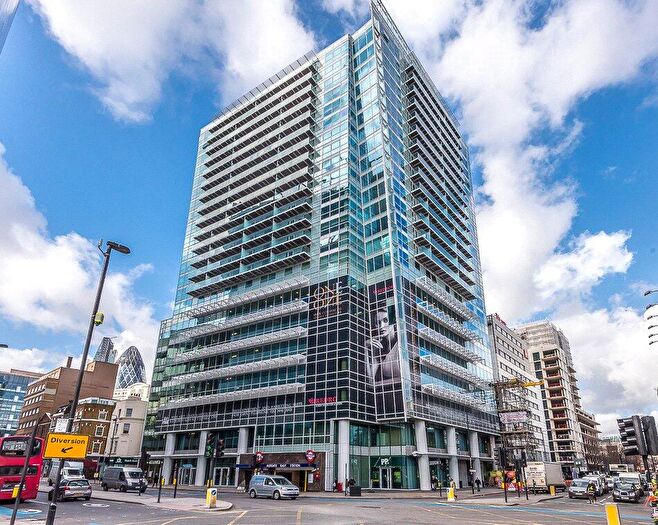
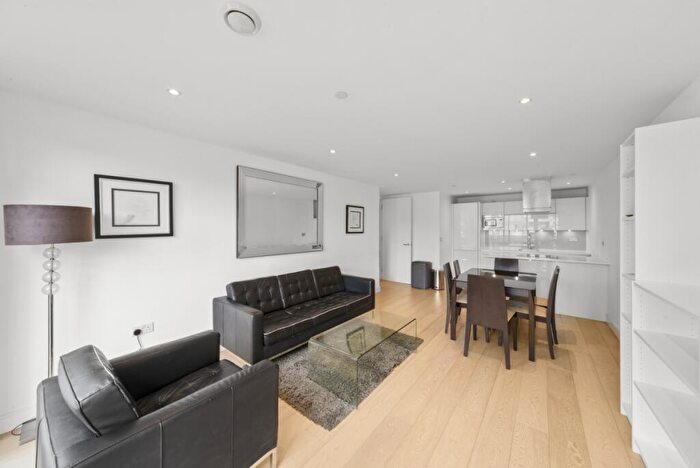
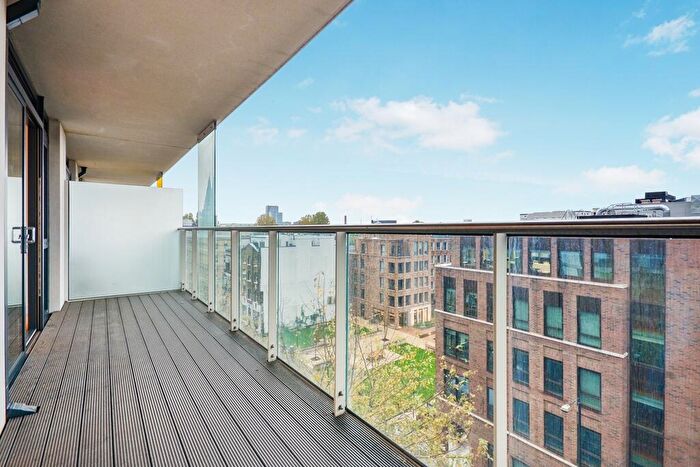
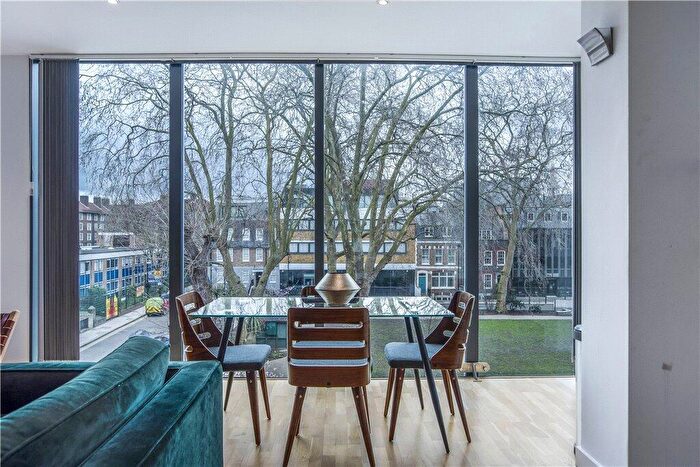
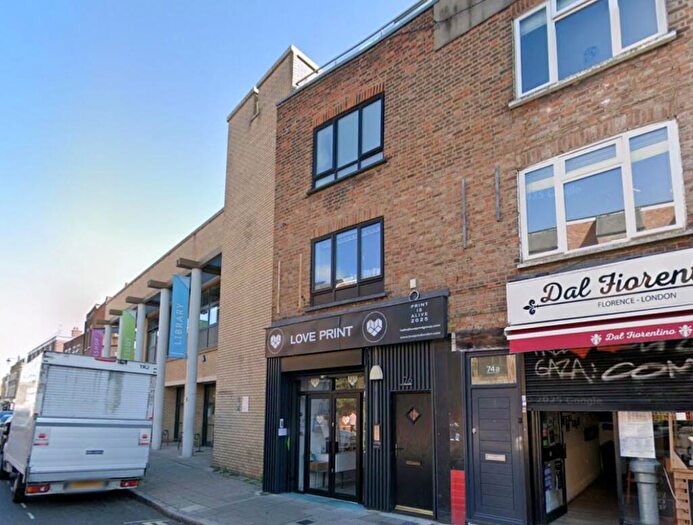
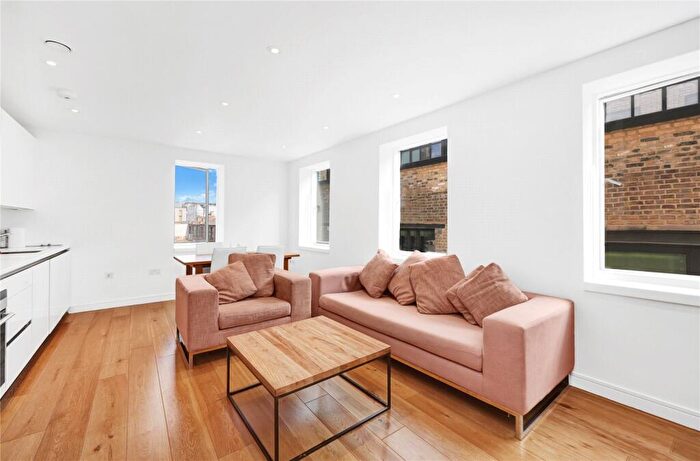
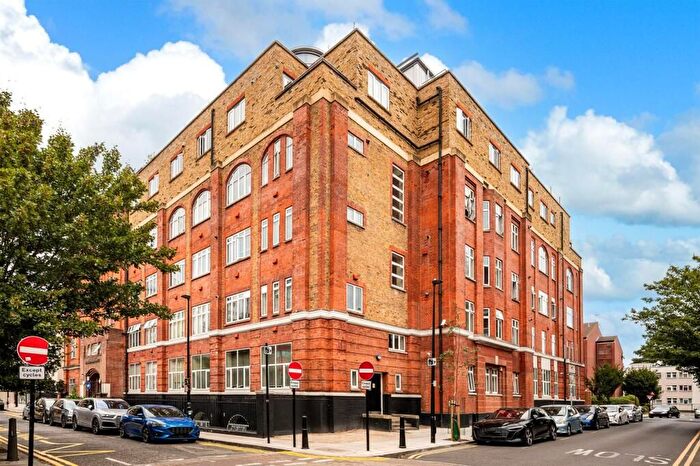
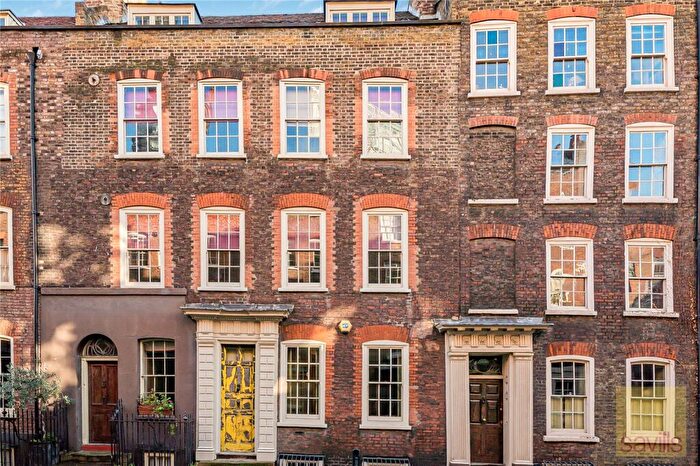
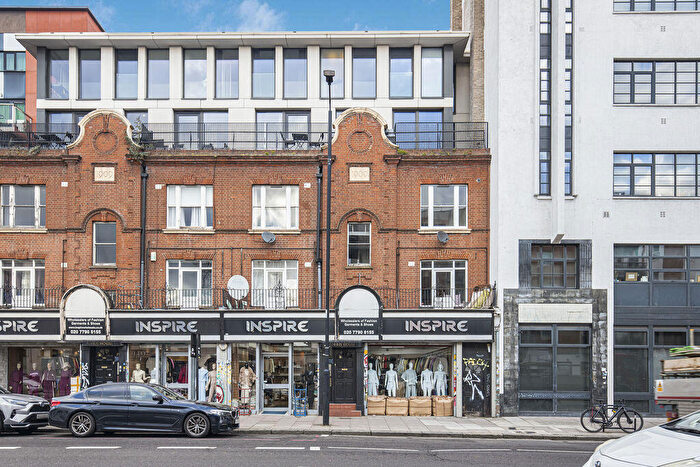
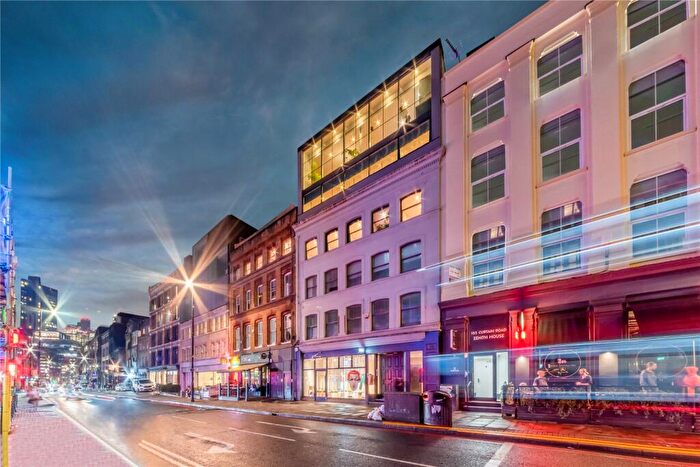
Houses for sale & to rent in Spitalfields And Banglatown, London
House Prices in Spitalfields And Banglatown
Properties in this part of Spitalfields And Banglatown within London have an average house price of £665,980.00 and had 199 Property Transactions within the last 3 years¹. This area has 3,833 households² , where the most expensive property was sold for £3,975,000.00.
Properties for sale in Spitalfields And Banglatown
Roads and Postcodes in Spitalfields And Banglatown
Navigate through our locations to find the location of your next house in Spitalfields And Banglatown, London for sale or to rent.
| Streets | Postcodes |
|---|---|
| Albion Yard | E1 1BW |
| Artillery Lane | E1 7LP |
| Artillery Passage | E1 7LJ |
| Bell Lane | E1 7LA E1 7LH E1 7NP E1 7NW |
| Bishops Square | E1 6GH |
| Brady Street | E1 5DG |
| Brick Lane | E1 6PU E1 6QL E1 6RF E1 6RL E1 6RU |
| Brune Street | E1 7ND E1 7NH E1 7NN E1 7NZ |
| Brushfield Street | E1 6AA E1 6AG E1 6AT |
| Buxton Street | E1 5AS E1 5AT E1 5EH E1 5EJ |
| Calvin Street | E1 6HF E1 6NW |
| Casson Street | E1 5LA |
| Chicksand Street | E1 5LB E1 5LD E1 5LH |
| Cobb Street | E1 7LB |
| Commercial Street | E1 6BD E1 6BG E1 6BJ E1 6EB E1 6LP E1 6LT E1 6LY E1 6LZ E1 6NG E1 6NQ E1 6NU |
| Coverley Close | E1 5HY |
| Crispin Street | E1 6HQ |
| Daplyn Street | E1 5JE |
| Davenant Street | E1 5AQ |
| Deal Street | E1 5AG E1 5AH |
| Durward Street | E1 5BA E1 5BB E1 5BD E1 5BE E1 5BT E1 5BZ |
| Elder Street | E1 6BT |
| Fakruddin Street | E1 5BU |
| Fashion Street | E1 6PX |
| Fleur De Lis Street | E1 6BP |
| Folgate Street | E1 6BX E1 6UJ E1 6UL E1 6UN E1 6UP E1 6UW |
| Fournier Street | E1 6QE |
| Frostic Walk | E1 5LT |
| Frying Pan Alley | E1 7HQ |
| Fulbourne Street | E1 5AA |
| Goulston Street | E1 7TS |
| Greatorex Street | E1 5EN E1 5NP E1 5NS E1 5NW |
| Green Dragon Yard | E1 5NJ |
| Gun Street | E1 6AH E1 6BS |
| Gunthorpe Street | E1 7RQ |
| Hanbury Street | E1 5JD E1 5JH E1 5JJ E1 5JP E1 5JR E1 5JS E1 5JY E1 5JZ E1 6QR |
| Hemming Street | E1 5BL |
| Heneage Street | E1 5LJ E1 5LW |
| Hobsons Place | E1 5HH |
| Hopetown Street | E1 5LE |
| Hunton Street | E1 5EZ E1 5HF |
| King's Arms Court | E1 1AQ |
| Lamb Street | E1 6EA E1 6ED |
| Leyden Street | E1 7LE E1 7LL |
| Lolesworth Close | E1 6LN |
| Lomas Street | E1 5BG |
| Middlesex Street | E1 7EX E1 7EY E1 7EZ |
| Monthope Road | E1 5LS |
| Moss Close | E1 5HT |
| New Goulston Street | E1 7PN E1 7PR |
| Norton Folgate | E1 6DB |
| Old Castle Street | E1 7NS E1 7NT E1 7NY E1 7TW |
| Old Montague Street | E1 5NA E1 5NL E1 5NT E1 5NU E1 5NX E1 5PA |
| Osborn Street | E1 6TD |
| Parliament Court | E1 7NA |
| Pecks Yard | E1 6QS |
| Princelet Street | E1 5LP E1 6QH E1 6QJ |
| Puma Court | E1 6QG |
| Quaker Street | E1 6SS E1 6ST E1 6SX E1 6SY |
| Regal Close | E1 5JB |
| Sandys Row | E1 7HW |
| Selby Street | E1 5BX |
| Sheba Place | E1 6SJ |
| Spelman Street | E1 5LG |
| Spital Square | E1 6DU E1 6DX |
| Spring Walk | E1 5JA |
| Steward Street | E1 6FQ |
| Strype Street | E1 7LF E1 7LG E1 7LQ |
| Surma Close | E1 5DD |
| Toynbee Street | E1 7NE E1 7NR |
| Trahorn Close | E1 5EL |
| Underwood Road | E1 5AW |
| Vallance Road | E1 5AB E1 5BH E1 5BJ E1 5BQ E1 5BS E1 5HR E1 5HS |
| Victoria Cottages | E1 5AJ |
| Wentworth Street | E1 7TB E1 7TD |
| Wheler Street | E1 6ND E1 6NP E1 6NR |
| Whitechapel High Street | E1 7AP E1 7AQ E1 7RA |
| Whitechapel Road | E1 1BY E1 1DB E1 1DE E1 1DT E1 1DU |
| Whites Row | E1 7NF |
| Wilkes Street | E1 6QF |
| Wodeham Gardens | E1 5BN |
| Woodseer Street | E1 5HA E1 5HD E1 5HG E1 5HQ E1 5JF |
Transport near Spitalfields And Banglatown
-
Aldgate East Station
-
Shoreditch High Street Station
-
Aldgate Station
-
Liverpool Street Station
-
Whitechapel Station
-
Bethnal Green Station
-
Fenchurch Street Station
-
Tower Gateway Station
-
Tower Hill Station
-
Moorgate Station
- FAQ
- Price Paid By Year
- Property Type Price
Frequently asked questions about Spitalfields And Banglatown
What is the average price for a property for sale in Spitalfields And Banglatown?
The average price for a property for sale in Spitalfields And Banglatown is £665,980. This amount is 27% higher than the average price in London. There are 8,788 property listings for sale in Spitalfields And Banglatown.
What streets have the most expensive properties for sale in Spitalfields And Banglatown?
The streets with the most expensive properties for sale in Spitalfields And Banglatown are Princelet Street at an average of £2,206,363, Whites Row at an average of £1,855,000 and Wentworth Street at an average of £1,005,000.
What streets have the most affordable properties for sale in Spitalfields And Banglatown?
The streets with the most affordable properties for sale in Spitalfields And Banglatown are Old Castle Street at an average of £366,500, Cobb Street at an average of £366,666 and Old Montague Street at an average of £399,928.
Which train stations are available in or near Spitalfields And Banglatown?
Some of the train stations available in or near Spitalfields And Banglatown are Shoreditch High Street, Liverpool Street and Whitechapel.
Which tube stations are available in or near Spitalfields And Banglatown?
Some of the tube stations available in or near Spitalfields And Banglatown are Aldgate East, Aldgate and Liverpool Street.
Property Price Paid in Spitalfields And Banglatown by Year
The average sold property price by year was:
| Year | Average Sold Price | Price Change |
Sold Properties
|
|---|---|---|---|
| 2025 | £617,922 | -11% |
45 Properties |
| 2024 | £683,243 | 1% |
74 Properties |
| 2023 | £677,046 | 7% |
80 Properties |
| 2022 | £632,713 | -17% |
100 Properties |
| 2021 | £741,691 | 11% |
90 Properties |
| 2020 | £657,641 | -8% |
49 Properties |
| 2019 | £707,257 | 12% |
84 Properties |
| 2018 | £624,273 | -15% |
65 Properties |
| 2017 | £719,770 | -7% |
84 Properties |
| 2016 | £766,783 | 1% |
78 Properties |
| 2015 | £759,452 | 20% |
134 Properties |
| 2014 | £607,283 | 8% |
283 Properties |
| 2013 | £559,278 | 13% |
140 Properties |
| 2012 | £485,019 | 13% |
111 Properties |
| 2011 | £422,805 | 4% |
129 Properties |
| 2010 | £406,379 | 16% |
106 Properties |
| 2009 | £340,686 | -15% |
75 Properties |
| 2008 | £392,924 | 1% |
119 Properties |
| 2007 | £387,332 | 23% |
237 Properties |
| 2006 | £298,662 | 10% |
207 Properties |
| 2005 | £268,210 | -8% |
161 Properties |
| 2004 | £290,906 | 14% |
214 Properties |
| 2003 | £248,861 | -4% |
181 Properties |
| 2002 | £257,993 | 18% |
194 Properties |
| 2001 | £212,812 | 2% |
185 Properties |
| 2000 | £209,187 | 10% |
262 Properties |
| 1999 | £188,712 | 19% |
304 Properties |
| 1998 | £153,164 | 18% |
281 Properties |
| 1997 | £126,253 | 31% |
236 Properties |
| 1996 | £86,759 | 16% |
183 Properties |
| 1995 | £72,507 | - |
87 Properties |
Property Price per Property Type in Spitalfields And Banglatown
Here you can find historic sold price data in order to help with your property search.
The average Property Paid Price for specific property types in the last three years are:
| Property Type | Average Sold Price | Sold Properties |
|---|---|---|
| Flat | £579,881.00 | 179 Flats |
| Terraced House | £1,362,184.00 | 19 Terraced Houses |
| Semi Detached House | £2,850,000.00 | 1 Semi Detached House |

