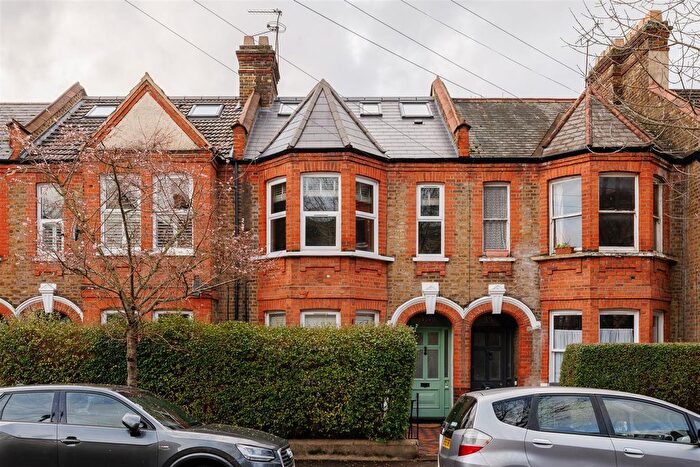
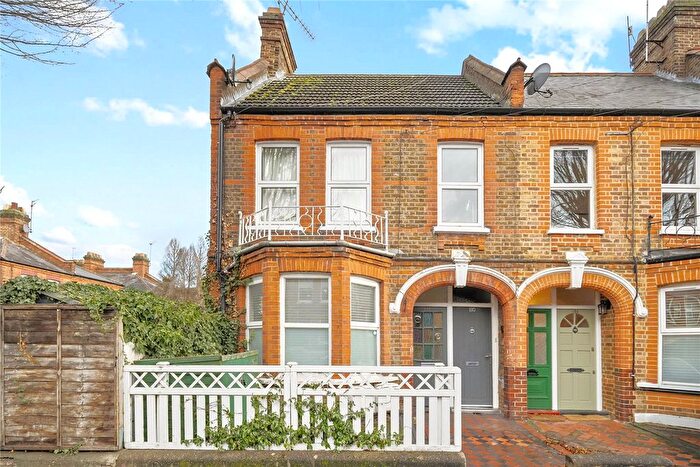
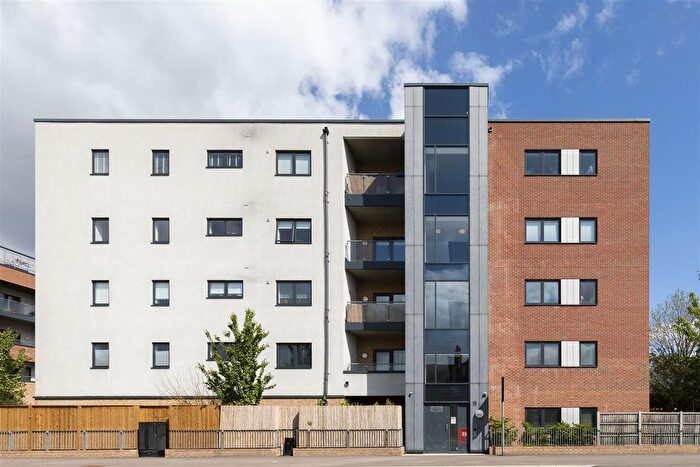
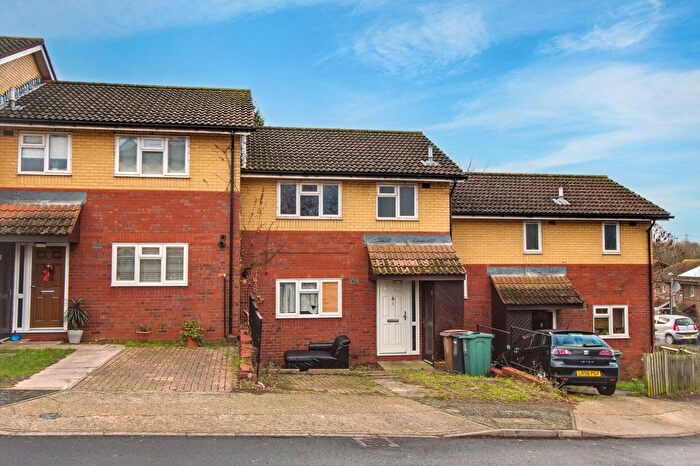
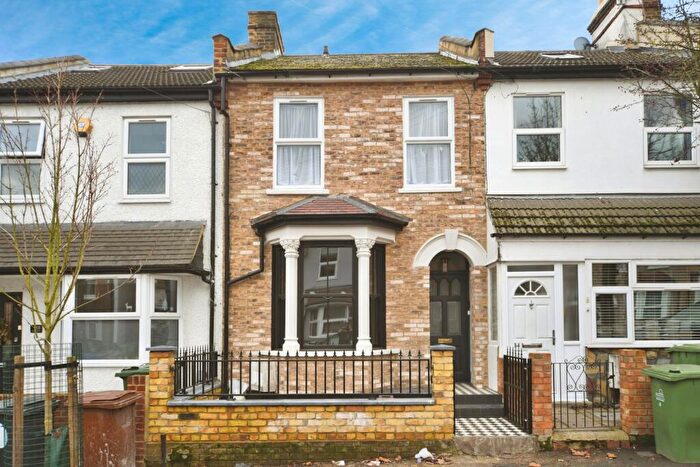
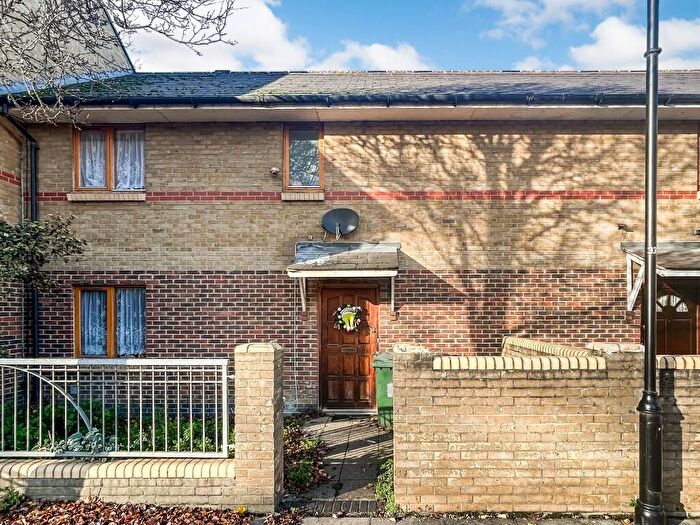
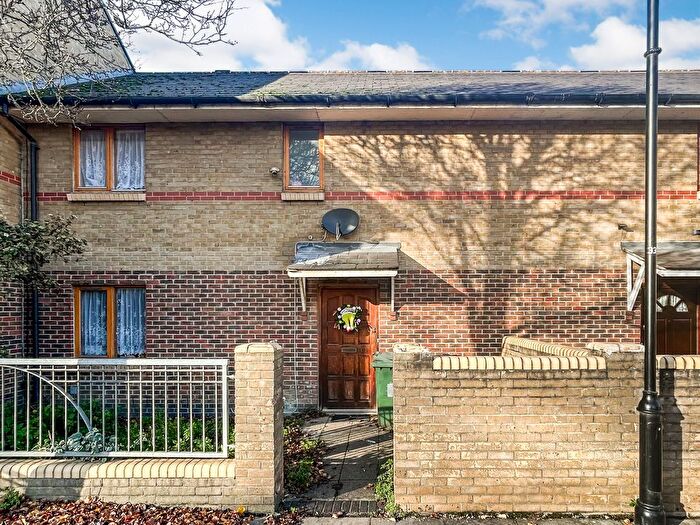
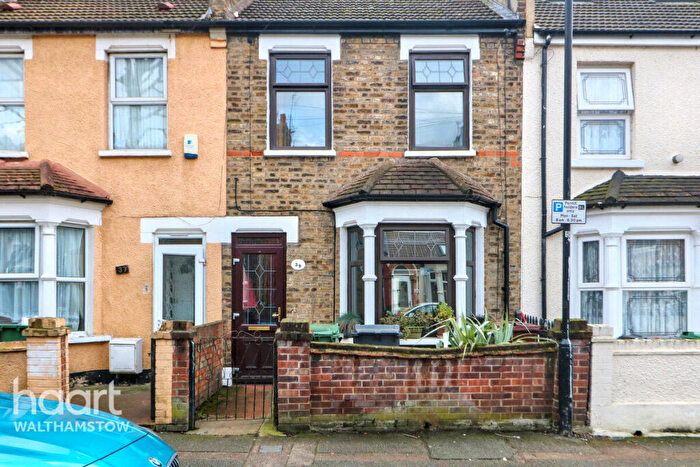
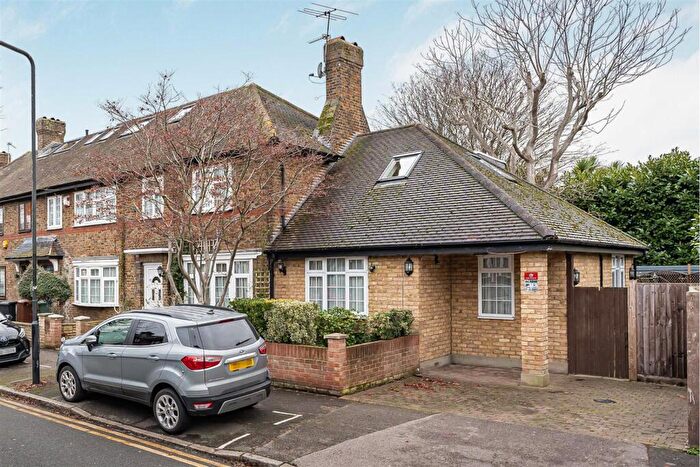
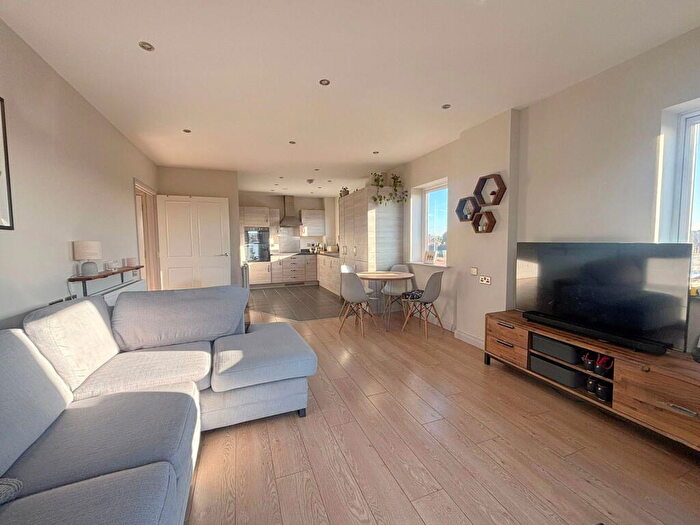
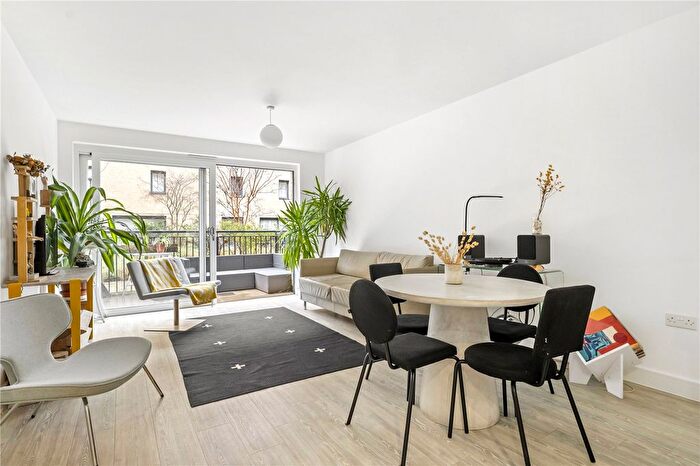
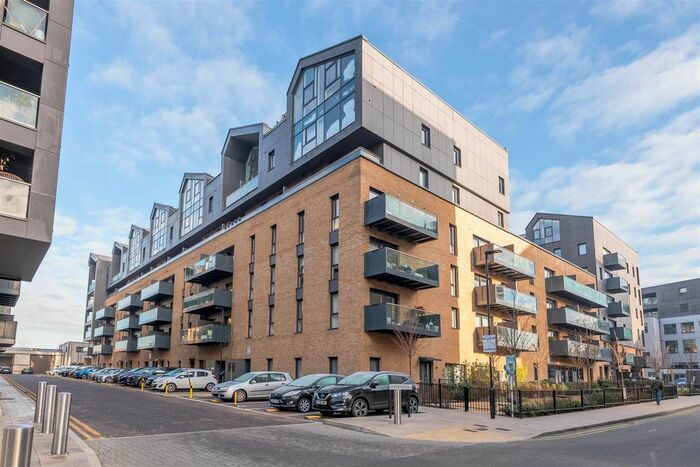
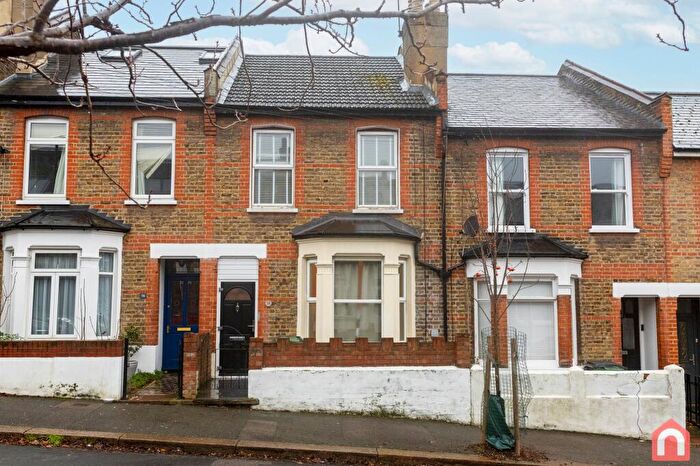
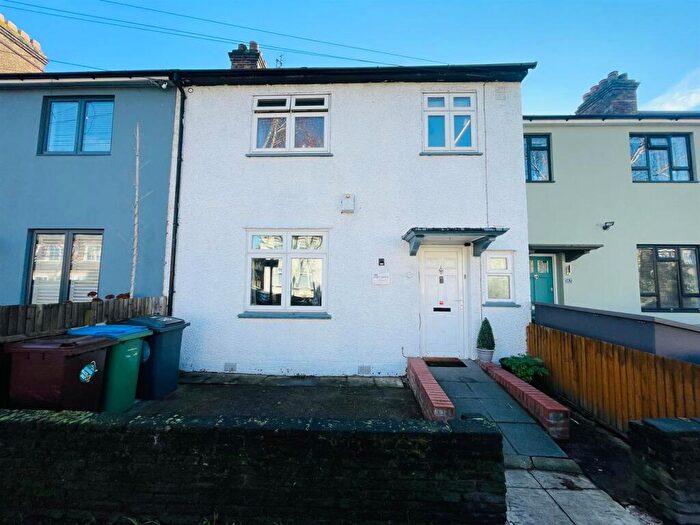
Houses for sale & to rent in Higham Hill, London
House Prices in Higham Hill
Properties in this part of Higham Hill within London have an average house price of £483,171.00 and had 357 Property Transactions within the last 3 years¹. This area has 4,868 households² , where the most expensive property was sold for £910,000.00.
Properties for sale in Higham Hill
Roads and Postcodes in Higham Hill
Navigate through our locations to find the location of your next house in Higham Hill, London for sale or to rent.
| Streets | Postcodes |
|---|---|
| Academy Way | E17 5BF |
| Amber Avenue | E17 5PA |
| Ascham End | E17 5EB |
| Banbury Road | E17 5SZ E17 5SY |
| Beaumans Drive | E17 5FQ |
| Billet Road | E17 5DN E17 5DS E17 5DX E17 5DY E17 5HE E17 5HF E17 5HG E17 5NS E17 5PH E17 5PJ E17 5PU E17 5PX E17 5DT |
| Blackhorse Lane | E17 5QH E17 6AA E17 6AD E17 6DJ E17 5QU E17 5QZ |
| Blackhorse Mews | E17 6SL |
| Bosworth Close | E17 5HP |
| Bramley Close | E17 6EG |
| Broughton Place | E17 5FF E17 5FL |
| Carlton Road | E17 5RA E17 5RE |
| Cavalry Place | E17 6GZ |
| Chamberlain Place | E17 6AY E17 6AZ |
| Cheney Row | E17 5ED |
| Church Road | E17 6AR |
| Claremont Road | E17 5RJ |
| Clarence Road | E17 6AG E17 6AQ |
| Cogan Avenue | E17 5PP |
| Colville Road | E17 6EL |
| Cooper Avenue | E17 5PN |
| Cormorant Close | E17 5SR |
| Cumberland Road | E17 5RR |
| Durban Road | E17 5EA |
| Fairfield Road | E17 6EW |
| Fairview Close | E17 5HJ |
| Faulkner Mews | E17 5DQ |
| Fleeming Close | E17 5BB |
| Folly Lane | E17 5NT |
| Forest Trading Estate | E17 6AL |
| Garnett Way | E17 5PE |
| Gloucester Road | E17 6AE E17 6AF |
| Goldsmith Road | E17 6AN E17 6AW |
| Grebe Close | E17 5ST |
| Green Pond Close | E17 6EE E17 6EF |
| Green Pond Road | E17 6EB E17 6EN |
| Greenshank Close | E17 5SS |
| Guildsway | E17 5JA |
| Gurney Close | E17 5PR |
| Hamilton Road | E17 6EH |
| Hecham Close | E17 5QT |
| Heron Close | E17 5HR |
| Higham Hill Road | E17 5QX E17 5QY E17 5RG E17 5RQ E17 6EJ E17 6EP E17 5RX E17 5SA E17 6ED E17 6FU |
| Higham Place | E17 6DD |
| Higham Street | E17 6BW E17 6BY E17 6DA |
| Highams Lodge Business Centre | E17 6SH |
| Hillyfield | E17 6EQ E17 6BZ E17 6EZ |
| Hookers Road | E17 6DP |
| Keith Road | E17 5BX |
| Kelmscott Close | E17 5HW |
| Kimberley Road | E17 5EE |
| Lancaster Road | E17 6AH E17 6AJ |
| Lawrence Avenue | E17 5PG E17 5PQ |
| Lee Close | E17 5QG |
| Lockwood Way | E17 5RB |
| Lowther Road | E17 6AP |
| Lyne Crescent | E17 5HY E17 5HZ |
| Manor Close | E17 5RT |
| Manor Road | E17 5RY E17 5RZ E17 5SB |
| Mayfield Road | E17 5RH |
| Mcentee Avenue | E17 5NU E17 5NX |
| Millfield Avenue | E17 5HH E17 5HL E17 5HN |
| Mount Pleasant Road | E17 5RS E17 5RU |
| Norfolk Road | E17 5QS |
| North Countess Road | E17 5HS E17 5HT |
| Oakfield Road | E17 5RL E17 5RN E17 5RW E17 5RP |
| Oatland Rise | E17 6DG E17 6GY |
| Osprey Close | E17 5SW |
| Papermill Place | E17 6GG E17 6GH E17 6GJ E17 6GL |
| Peacock Close | E4 8TX |
| Priors Croft | E17 5NH E17 5NJ |
| Riverhead Close | E17 5PY |
| Robinswood Gardens | E17 5FN E17 5FP |
| Rodney Place | E17 5NN |
| Romany Gardens | E17 5PB |
| Rowntree Mews | E17 5FX |
| Rushbrook Crescent | E17 5BZ |
| Sandpiper Close | E17 5SP |
| Shakespeare Road | E17 6AS |
| Shaw Square | E17 5JB |
| Sinnott Road | E17 5PL E17 5QB |
| Southend Road | E4 8TA |
| St Andrews Road | E17 6AX E17 6BA E17 6BB E17 6BD E17 6BQ E17 6FF E17 6NZ |
| Stirling Road | E17 6BS E17 6BT |
| Stow Crescent | E17 5EG |
| Sutherland House | E17 6BU |
| Sutherland Road | E17 6BJ E17 6BH E17 6FA E17 6GS E17 6GT E17 6GU E17 6JW E17 6SS E17 6LW |
| Sutherland Road Path | E17 6BX |
| Sutton Road | E17 5QA |
| Swan Close | E17 5SX |
| Swansland Gardens | E17 5PD |
| Swift Close | E17 5SU |
| The Mile End | E17 5QE E17 5QF |
| Thornbury Way | E17 5FR E17 5FS E17 5FT E17 5FU |
| Thorpe Crescent | E17 5BY |
| Travers Close | E17 5PT |
| Unity Place | E17 6SR |
| Uplands Avenue | E17 6DH |
| Uplands Business Park | E17 5QJ E17 5QN |
| Valognes Avenue | E17 5PW |
| Waltham Park Way | E17 5DU |
| Warwick Road | E17 5NP |
| Waterhall Close | E17 5PS |
| Wigmore Place | E17 6GP |
| Wigton Road | E17 5HU |
| Williams Avenue | E17 5HX |
| Windsor Avenue | E17 5NL |
| Woolston Close | E17 5PZ E17 5QQ |
| Worcester Road | E17 5QR |
Transport near Higham Hill
-
Blackhorse Road Station
-
Northumberland Park Station
-
St.James' Street Station
-
St James Street Station
-
Walthamstow Central Station
-
Walthamstow Queens Road Station
-
Tottenham Hale Station
-
Angel Road Station
-
Wood Street Station
-
Bruce Grove Station
- FAQ
- Price Paid By Year
- Property Type Price
Frequently asked questions about Higham Hill
What is the average price for a property for sale in Higham Hill?
The average price for a property for sale in Higham Hill is £483,171. This amount is 11% lower than the average price in London. There are 3,101 property listings for sale in Higham Hill.
What streets have the most expensive properties for sale in Higham Hill?
The streets with the most expensive properties for sale in Higham Hill are The Mile End at an average of £825,000, Worcester Road at an average of £769,500 and Lancaster Road at an average of £726,537.
What streets have the most affordable properties for sale in Higham Hill?
The streets with the most affordable properties for sale in Higham Hill are Broughton Place at an average of £173,437, Green Pond Close at an average of £244,738 and Manor Close at an average of £266,833.
Which train stations are available in or near Higham Hill?
Some of the train stations available in or near Higham Hill are Blackhorse Road, Northumberland Park and St.James' Street.
Which tube stations are available in or near Higham Hill?
Some of the tube stations available in or near Higham Hill are Blackhorse Road, Walthamstow Central and Tottenham Hale.
Property Price Paid in Higham Hill by Year
The average sold property price by year was:
| Year | Average Sold Price | Price Change |
Sold Properties
|
|---|---|---|---|
| 2025 | £519,094 | 8% |
106 Properties |
| 2024 | £475,074 | 3% |
139 Properties |
| 2023 | £459,221 | -6% |
112 Properties |
| 2022 | £485,117 | 6% |
144 Properties |
| 2021 | £456,064 | 5% |
178 Properties |
| 2020 | £431,489 | 9% |
88 Properties |
| 2019 | £392,273 | -6% |
149 Properties |
| 2018 | £416,159 | -2% |
178 Properties |
| 2017 | £422,516 | 6% |
188 Properties |
| 2016 | £397,090 | 13% |
157 Properties |
| 2015 | £347,148 | 15% |
164 Properties |
| 2014 | £295,609 | 16% |
140 Properties |
| 2013 | £248,648 | 14% |
127 Properties |
| 2012 | £215,053 | 13% |
91 Properties |
| 2011 | £188,071 | -7% |
113 Properties |
| 2010 | £200,476 | 7% |
108 Properties |
| 2009 | £187,130 | -12% |
78 Properties |
| 2008 | £209,107 | -3% |
108 Properties |
| 2007 | £215,014 | 8% |
234 Properties |
| 2006 | £197,837 | 5% |
241 Properties |
| 2005 | £187,474 | 5% |
232 Properties |
| 2004 | £177,422 | 8% |
241 Properties |
| 2003 | £163,999 | 17% |
247 Properties |
| 2002 | £136,142 | 20% |
244 Properties |
| 2001 | £109,046 | 17% |
232 Properties |
| 2000 | £90,725 | 16% |
245 Properties |
| 1999 | £76,077 | 11% |
226 Properties |
| 1998 | £67,415 | 11% |
187 Properties |
| 1997 | £59,876 | 15% |
199 Properties |
| 1996 | £50,683 | 2% |
177 Properties |
| 1995 | £49,822 | - |
128 Properties |
Property Price per Property Type in Higham Hill
Here you can find historic sold price data in order to help with your property search.
The average Property Paid Price for specific property types in the last three years are:
| Property Type | Average Sold Price | Sold Properties |
|---|---|---|
| Flat | £342,086.00 | 152 Flats |
| Semi Detached House | £549,400.00 | 20 Semi Detached Houses |
| Detached House | £570,000.00 | 3 Detached Houses |
| Terraced House | £592,291.00 | 182 Terraced Houses |

