
Houses for sale & to rent in Tooting, London
House Prices in Tooting
Properties in this part of Tooting within London have an average house price of £629k and had 560 Property Transactions within the last 3 years¹. This area has 6,021 households² , where the most expensive property was sold for £1.4M.
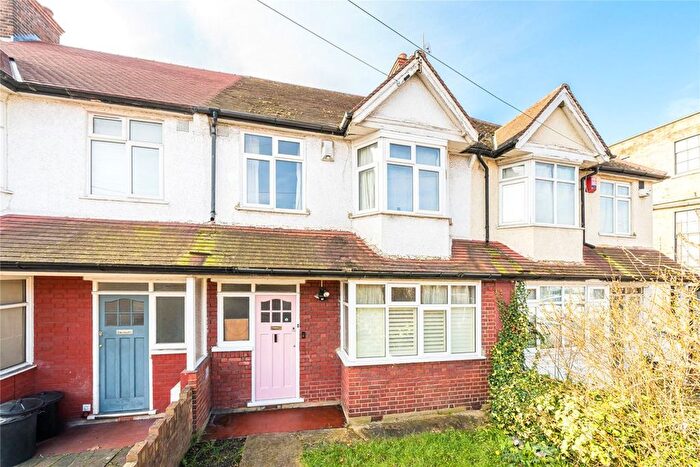
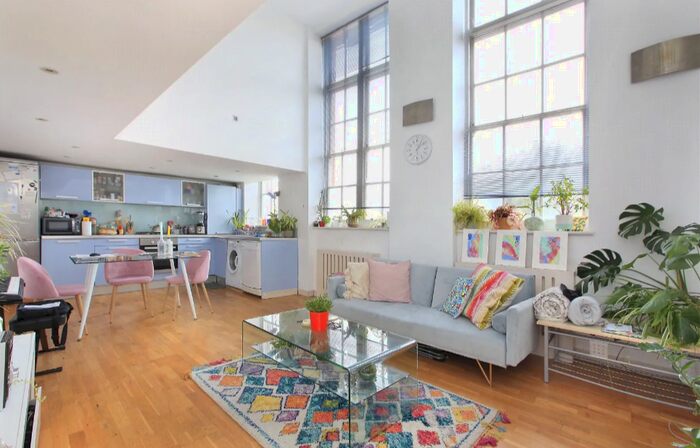
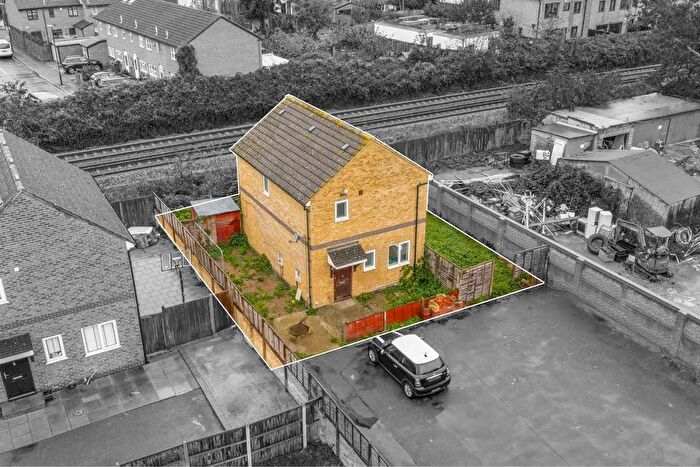
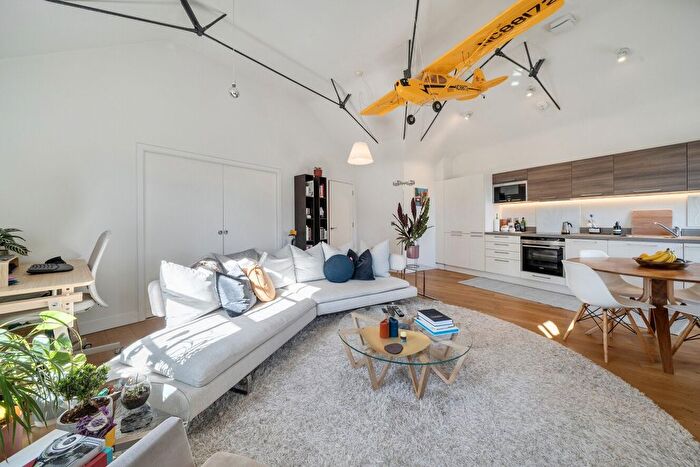
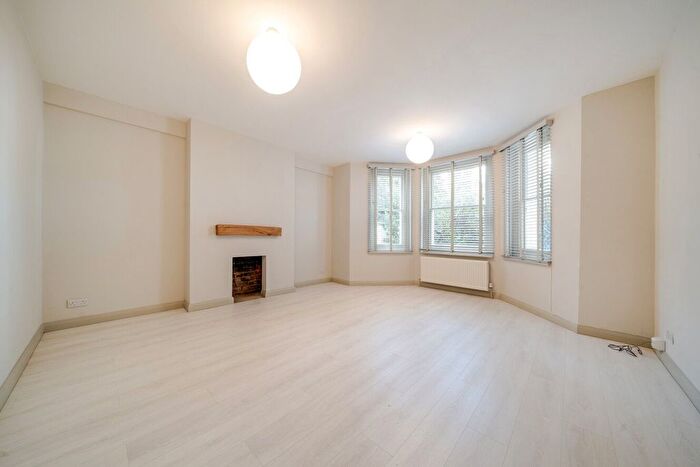
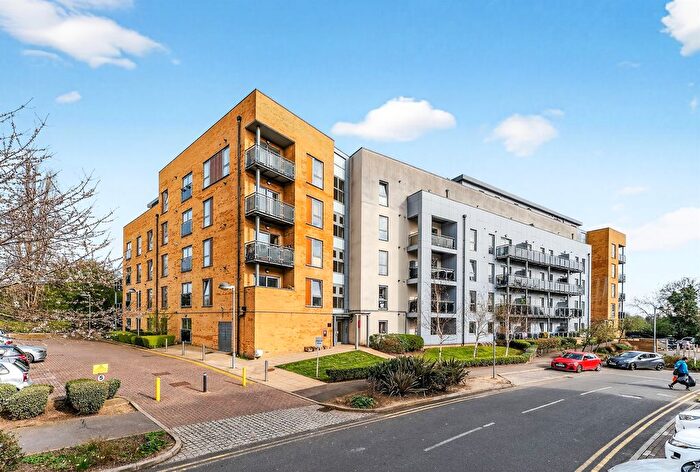
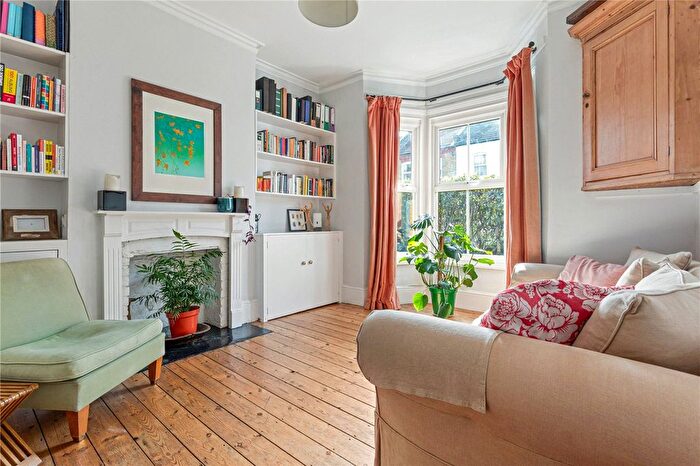
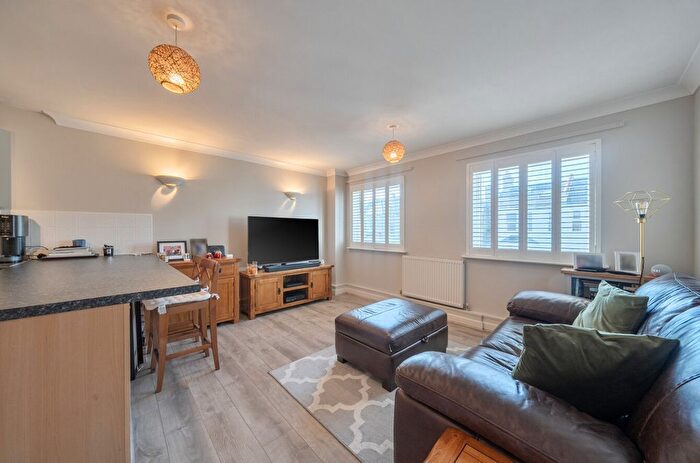
Properties for sale in Tooting
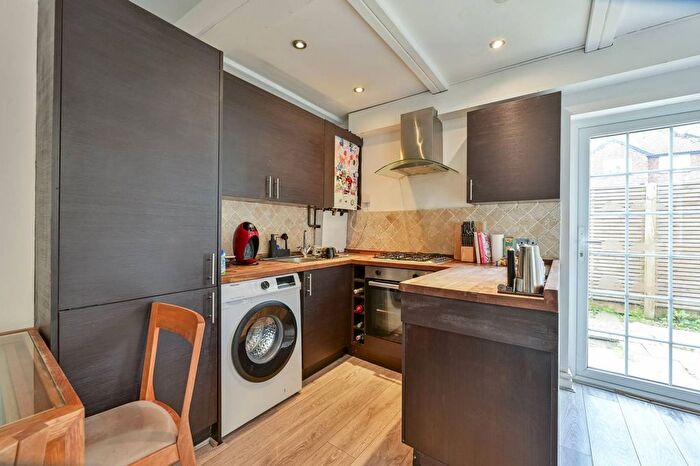
![]()
If you are looking to sell your house, let it out, or receive a property valuation, an expert can help you.
Click the button below to get started.
Roads and Postcodes in Tooting
Navigate through our locations to find the location of your next house in Tooting, London for sale or to rent.
Transport near Tooting
-
 Tooting Broadway Station
 -
Tooting Bec Station
-
 Tooting Station
 -
Colliers Wood Station
-
Haydons Road Station
-
Earlsfield Station
-
Wandsworth Common Station
-
Balham Station
-
Wimbledon Park Station
-
South Wimbledon Station
- FAQ
- Price Paid By Year
- Property Type Price
Frequently asked questions about Tooting
What is the average price for a property for sale in Tooting?
The average price for a property for sale in Tooting is £629,414. This amount is 22% lower than the average price in London. There are 4,523 property listings for sale in Tooting.
What streets have the most expensive properties for sale in Tooting?
The streets with the most expensive properties for sale in Tooting are Mandrake Road at an average of £1,132,187, Fircroft Road at an average of £1,029,645 and Glenburnie Road at an average of £926,250.
What streets have the most affordable properties for sale in Tooting?
The streets with the most affordable properties for sale in Tooting are Burfield Close at an average of £285,000, Franciscan Road at an average of £321,000 and Hazelhurst Road at an average of £334,214.
Which train stations are available in or near Tooting?
Some of the train stations available in or near Tooting are Tooting, Haydons Road and Earlsfield.
Which tube stations are available in or near Tooting?
Some of the tube stations available in or near Tooting are Tooting Broadway, Tooting Bec and Colliers Wood.
Property Price Paid in Tooting by Year
The average sold property price by year was:
| Year | Average Sold Price | Price Change |
Sold Properties
|
|---|---|---|---|
| 2026 | £745,000 | 11% |
2 Properties |
| 2025 | £660,629 | 8% |
167 Properties |
| 2024 | £608,573 | -3% |
215 Properties |
| 2023 | £623,941 | -3% |
176 Properties |
| 2022 | £640,274 | 5% |
221 Properties |
| 2021 | £605,176 | -1% |
251 Properties |
| 2020 | £608,368 | 5% |
169 Properties |
| 2019 | £578,041 | 4% |
160 Properties |
| 2018 | £552,911 | -4% |
181 Properties |
| 2017 | £573,451 | -7% |
152 Properties |
| 2016 | £614,498 | 16% |
206 Properties |
| 2015 | £517,456 | 10% |
229 Properties |
| 2014 | £465,108 | 18% |
230 Properties |
| 2013 | £380,003 | 4% |
205 Properties |
| 2012 | £363,718 | 9% |
183 Properties |
| 2011 | £330,056 | 9% |
183 Properties |
| 2010 | £300,541 | 2% |
187 Properties |
| 2009 | £296,030 | -7% |
120 Properties |
| 2008 | £315,884 | -0,2% |
143 Properties |
| 2007 | £316,471 | 14% |
291 Properties |
| 2006 | £272,769 | 8% |
307 Properties |
| 2005 | £250,736 | 6% |
230 Properties |
| 2004 | £235,353 | 8% |
263 Properties |
| 2003 | £216,014 | 5% |
312 Properties |
| 2002 | £205,703 | 15% |
313 Properties |
| 2001 | £175,209 | 13% |
297 Properties |
| 2000 | £152,568 | 23% |
327 Properties |
| 1999 | £117,889 | 13% |
348 Properties |
| 1998 | £102,344 | 19% |
316 Properties |
| 1997 | £82,669 | 13% |
343 Properties |
| 1996 | £71,510 | 9% |
256 Properties |
| 1995 | £65,144 | - |
214 Properties |
Property Price per Property Type in Tooting
Here you can find historic sold price data in order to help with your property search.
The average Property Paid Price for specific property types in the last three years are:
| Property Type | Average Sold Price | Sold Properties |
|---|---|---|
| Flat | £467,162.00 | 258 Flats |
| Semi Detached House | £778,968.00 | 16 Semi Detached Houses |
| Detached House | £977,500.00 | 2 Detached Houses |
| Terraced House | £765,935.00 | 284 Terraced Houses |