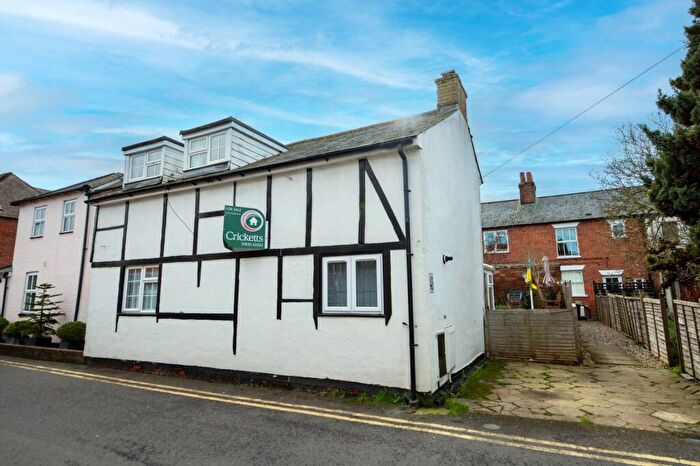
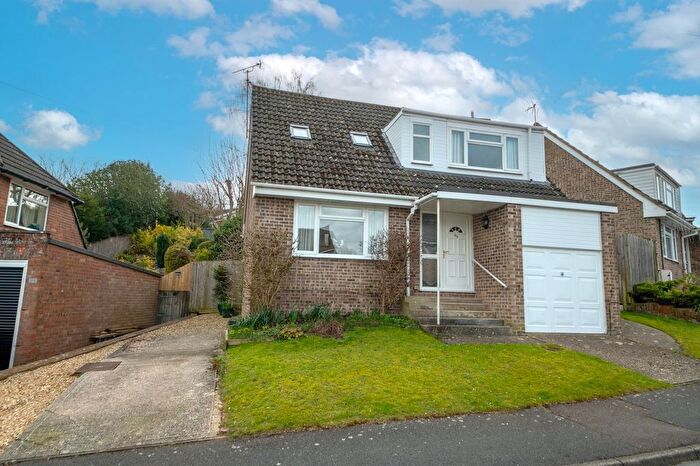
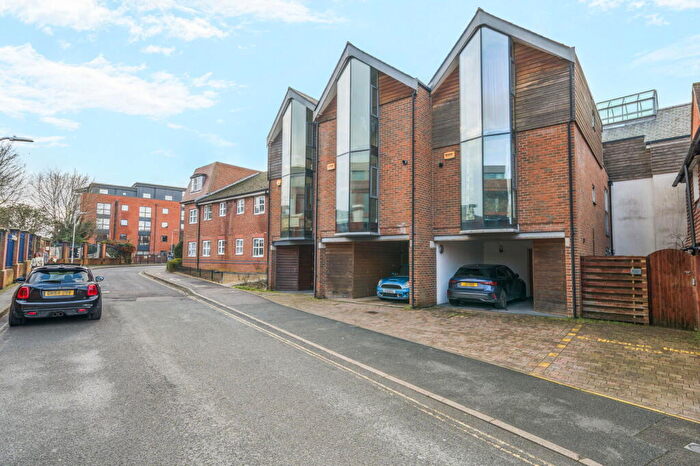
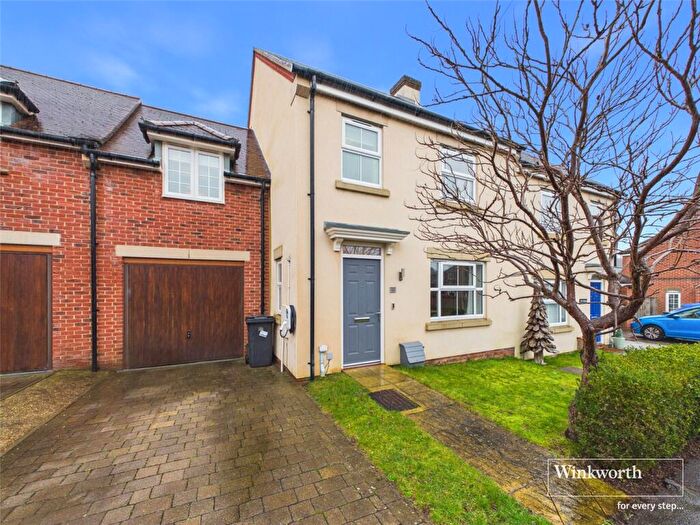
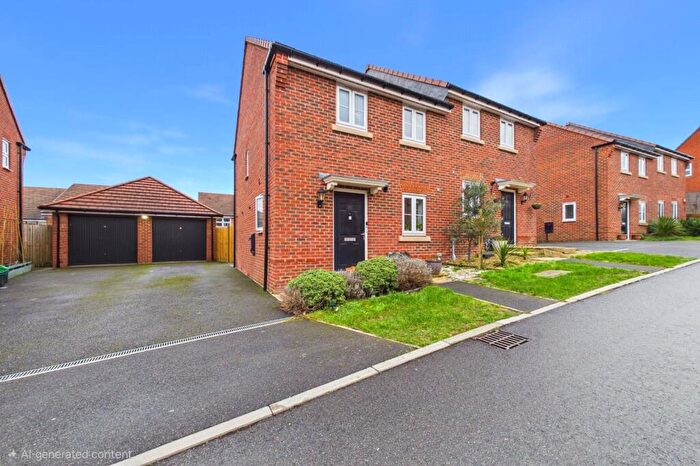
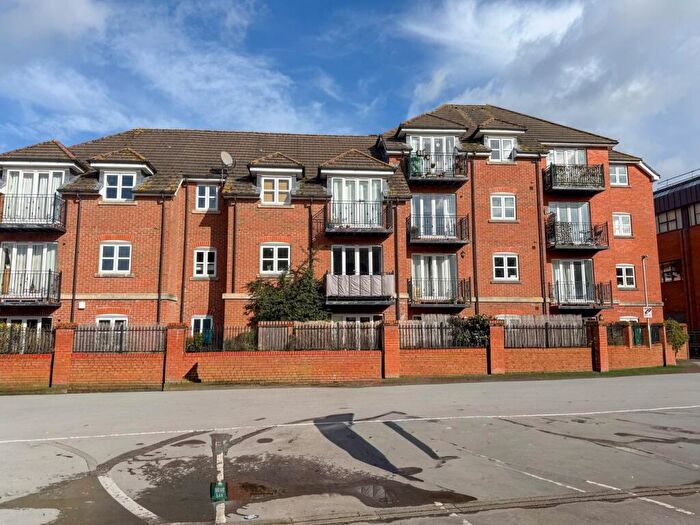
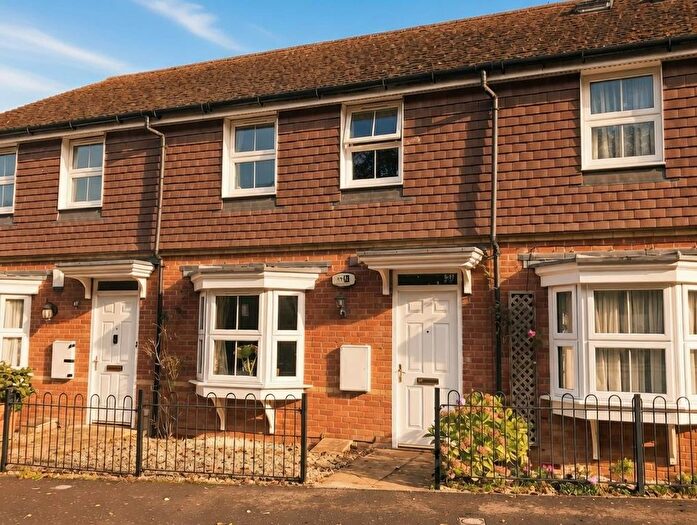
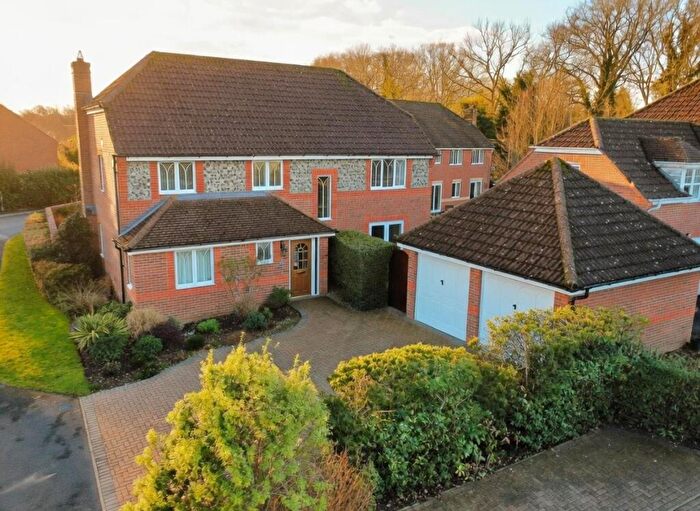
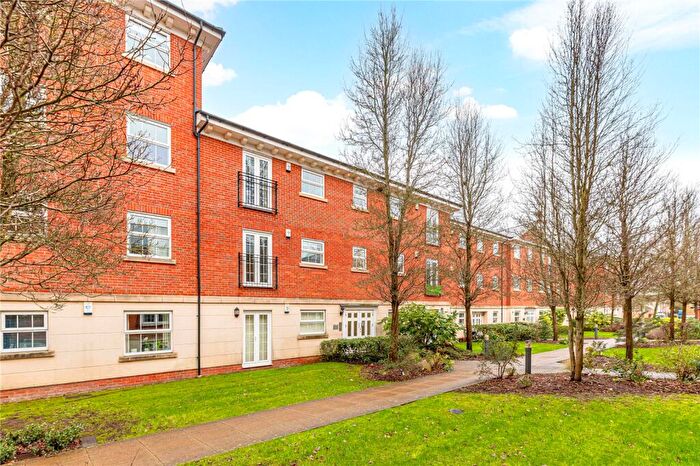
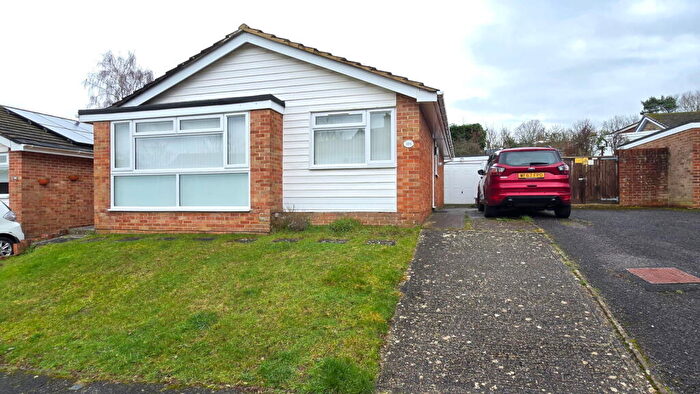
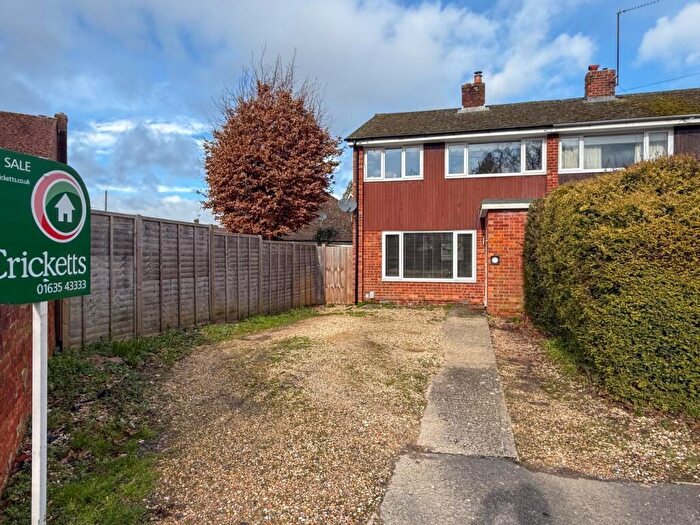
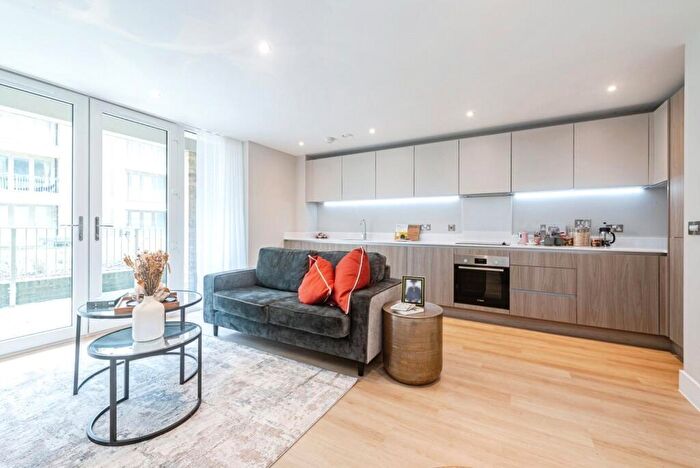
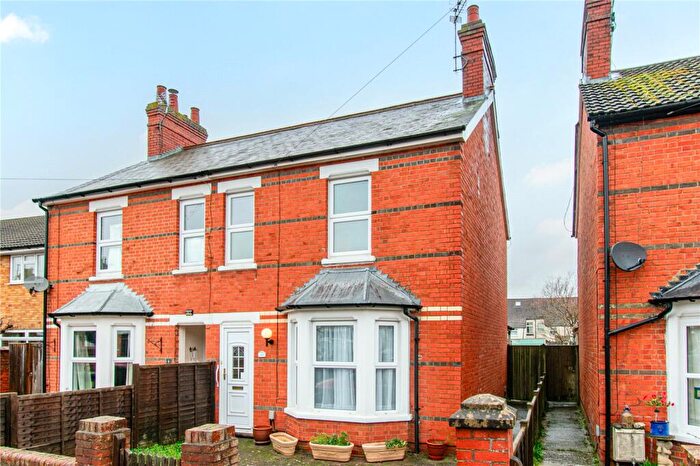
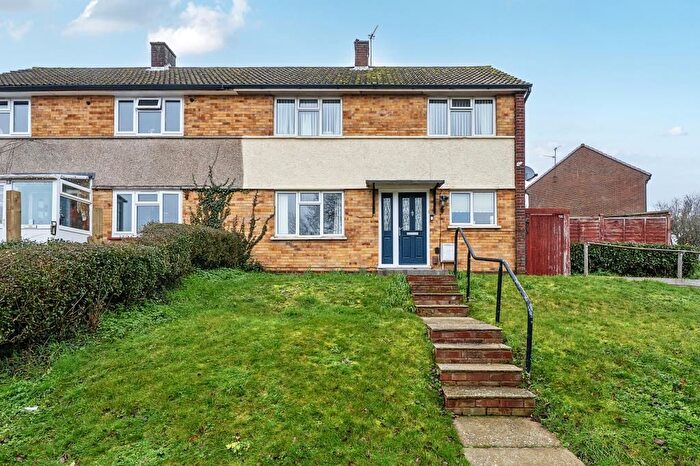
Houses for sale & to rent in Greenham, Newbury
House Prices in Greenham
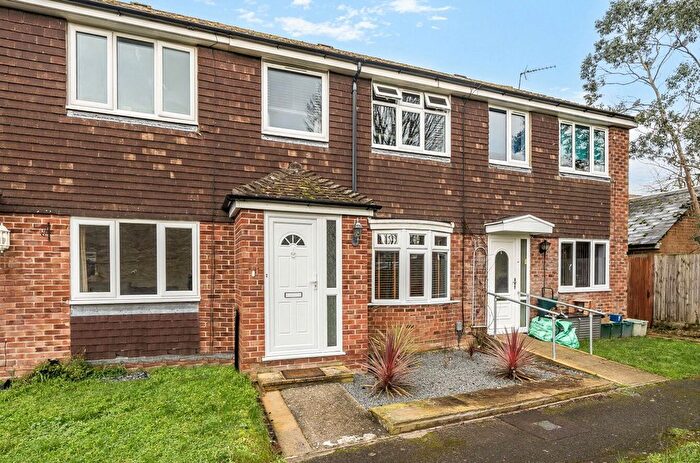
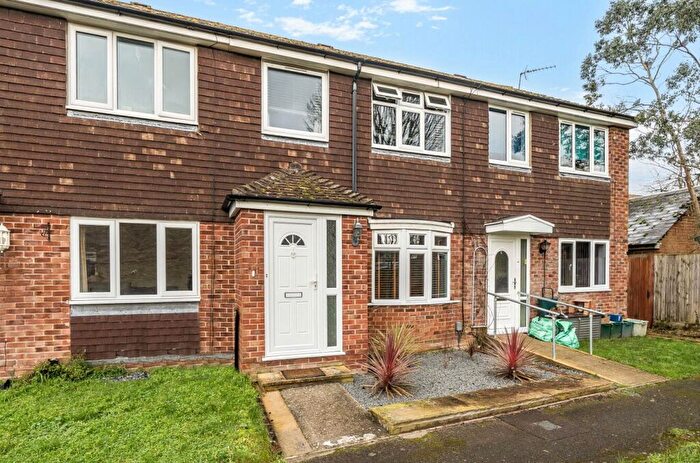
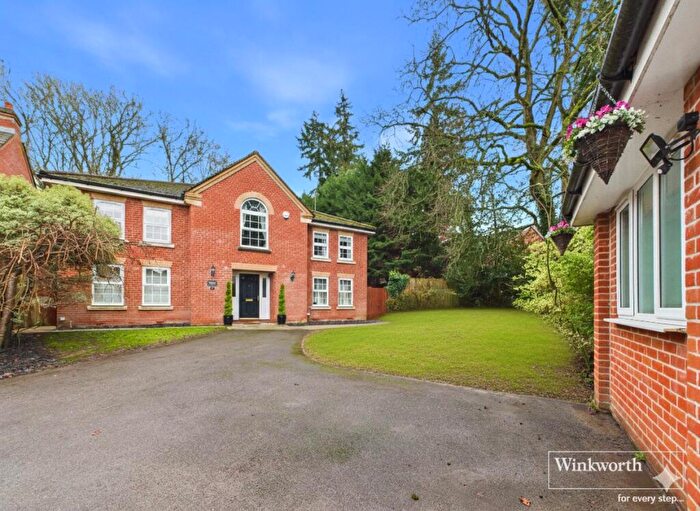
Properties in Greenham have an average house price of £371,776.00 and had 158 Property Transactions within the last 3 years¹.
Greenham is an area in Newbury, West Berkshire with 1,561 households², where the most expensive property was sold for £840,000.00.
Properties for sale in Greenham
Roads and Postcodes in Greenham
Navigate through our locations to find the location of your next house in Greenham, Newbury for sale or to rent.
| Streets | Postcodes |
|---|---|
| Aintree Close | RG14 7TX |
| Ascot Close | RG14 7TW |
| Austen Gardens | RG14 7UB |
| Basingstoke Road | RG14 7HQ |
| Bishops Green | RG20 4HS RG20 4HT |
| Bronte Rise | RG14 7UG |
| Charlottown | RG14 7WG |
| Cheriton Close | RG14 7JT |
| Chester Close | RG14 7RR |
| Christie Heights | RG14 7UR |
| Coppice Close | RG14 7JX |
| Cormorant Wood | RG14 7WH |
| Courtlands Road | RG14 7LA |
| Dalby Crescent | RG14 7JR RG14 7LB |
| Denman Drive | RG14 7GD |
| Dickens Walk | RG14 7UQ |
| Eeklo Place | RG14 7HW |
| Elm View | RG14 7JG |
| Epsom Crescent | RG14 7TR |
| Equine Way | RG14 7XB |
| Ewing Way | RG14 7UF |
| Fontwell Road | RG14 7TS |
| Gaskell Mews | RG14 7UP |
| Goodwood Way | RG14 7RT |
| Greenham Road | RG14 7HY RG14 7JE RG14 7JL RG14 7SY RG14 7TA |
| Greenlands Road | RG14 7JS RG14 7JU |
| Hambridge Lane | RG14 5TH RG14 5UG |
| Hamilton Court | RG14 7UH |
| Hennessy Crescent | RG14 7GB |
| Horseshoe End | RG14 7XE |
| Kempton Close | RG14 7RS |
| Kersten Close | RG14 7WF |
| Lamtarra Way | RG14 7WB |
| Lingfield Road | RG14 7SE |
| Mandarin Court | RG14 5SQ |
| Mandarin Drive | RG14 7WE |
| New Road | RG14 7RU RG14 7RX RG14 7RY |
| Newtown Road | RG14 7HA |
| Plumpton Road | RG14 7TU |
| Porter End | RG14 7JP |
| Pound Cottages | RG14 7JH |
| Pyle Hill | RG14 7JJ RG14 7SJ |
| Racecourse Road | RG14 7GA |
| Robertson Close | RG14 7SQ |
| Rosyth Gardens | RG14 7WD |
| Sandown Way | RG14 7SB RG14 7SD |
| Sayers Close | RG14 7UU |
| Sedgefield Road | RG14 7TZ |
| Springfield Lane | RG14 7SU |
| Starting Gate | RG14 7RP |
| Stirrup Close | RG14 7XD |
| The Baxendales | RG14 7SA |
| The Cedars | RG14 7AA |
| The Folly | RG14 7JF |
| The Halters | RG14 7XF |
| The Nightingales | RG14 7UJ RG14 7UL RG14 7UT |
| Wallis Gardens | RG14 7SF |
| Warwick Drive | RG14 7TT |
| Westlands Road | RG14 7JY |
| Westwood Road | RG14 7JN RG14 7LD RG14 7TH RG14 7TJ RG14 7TL RG14 7TN RG14 7TP |
| Windsor Rise | RG14 7TY |
| Winfield Drive | RG14 7JW |
Transport near Greenham
- FAQ
- Price Paid By Year
- Property Type Price
Frequently asked questions about Greenham
What is the average price for a property for sale in Greenham?
The average price for a property for sale in Greenham is £371,776. This amount is 9% lower than the average price in Newbury. There are 3,097 property listings for sale in Greenham.
What streets have the most expensive properties for sale in Greenham?
The streets with the most expensive properties for sale in Greenham are Greenlands Road at an average of £840,000, Bishops Green at an average of £630,000 and Windsor Rise at an average of £607,475.
What streets have the most affordable properties for sale in Greenham?
The streets with the most affordable properties for sale in Greenham are Eeklo Place at an average of £153,555, Christie Heights at an average of £170,166 and Cormorant Wood at an average of £202,500.
Which train stations are available in or near Greenham?
Some of the train stations available in or near Greenham are Newbury Racecourse, Newbury and Thatcham.
Property Price Paid in Greenham by Year
The average sold property price by year was:
| Year | Average Sold Price | Price Change |
Sold Properties
|
|---|---|---|---|
| 2025 | £406,199 | 14% |
49 Properties |
| 2024 | £349,559 | -4% |
58 Properties |
| 2023 | £363,970 | -19% |
51 Properties |
| 2022 | £431,828 | 17% |
66 Properties |
| 2021 | £359,961 | 4% |
68 Properties |
| 2020 | £344,000 | -2% |
49 Properties |
| 2019 | £349,728 | 3% |
35 Properties |
| 2018 | £339,805 | 6% |
59 Properties |
| 2017 | £319,154 | -7% |
58 Properties |
| 2016 | £342,036 | 7% |
54 Properties |
| 2015 | £316,809 | 5% |
85 Properties |
| 2014 | £301,619 | 6% |
105 Properties |
| 2013 | £282,701 | 11% |
98 Properties |
| 2012 | £251,448 | 13% |
51 Properties |
| 2011 | £217,601 | -8% |
35 Properties |
| 2010 | £234,746 | 6% |
50 Properties |
| 2009 | £220,527 | 1% |
39 Properties |
| 2008 | £217,993 | -19% |
50 Properties |
| 2007 | £259,040 | 2% |
87 Properties |
| 2006 | £254,361 | 15% |
159 Properties |
| 2005 | £215,950 | 7% |
126 Properties |
| 2004 | £201,372 | 3% |
75 Properties |
| 2003 | £196,306 | 12% |
77 Properties |
| 2002 | £173,670 | 13% |
93 Properties |
| 2001 | £151,729 | 18% |
84 Properties |
| 2000 | £123,856 | 14% |
85 Properties |
| 1999 | £105,973 | 7% |
143 Properties |
| 1998 | £98,385 | 18% |
66 Properties |
| 1997 | £80,657 | 12% |
80 Properties |
| 1996 | £70,693 | -4% |
59 Properties |
| 1995 | £73,676 | - |
63 Properties |
Property Price per Property Type in Greenham
Here you can find historic sold price data in order to help with your property search.
The average Property Paid Price for specific property types in the last three years are:
| Property Type | Average Sold Price | Sold Properties |
|---|---|---|
| Semi Detached House | £390,772.00 | 42 Semi Detached Houses |
| Detached House | £578,998.00 | 29 Detached Houses |
| Terraced House | £335,371.00 | 64 Terraced Houses |
| Flat | £177,108.00 | 23 Flats |

