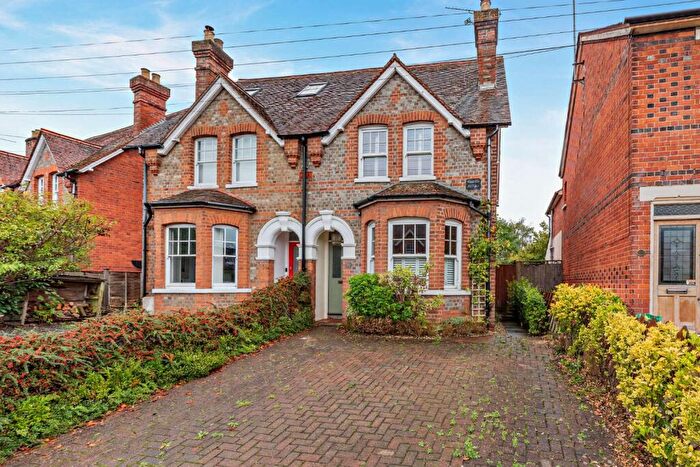
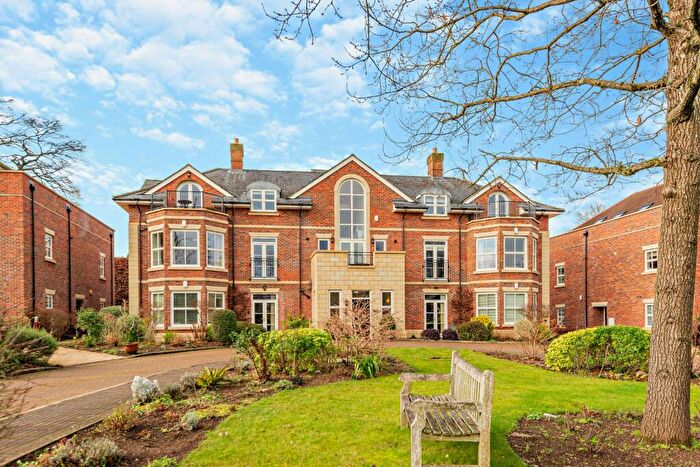
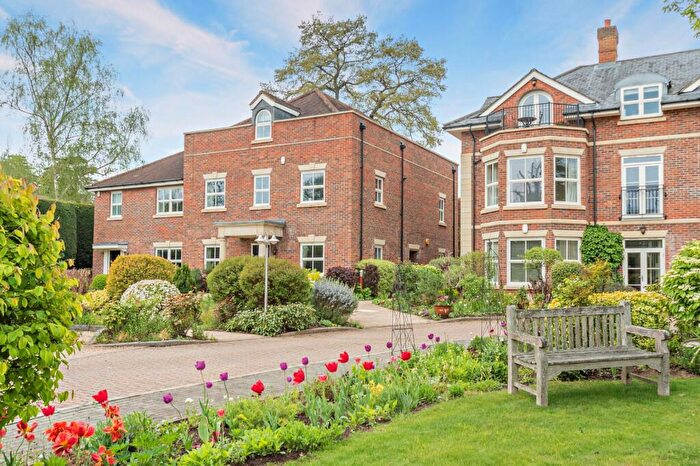
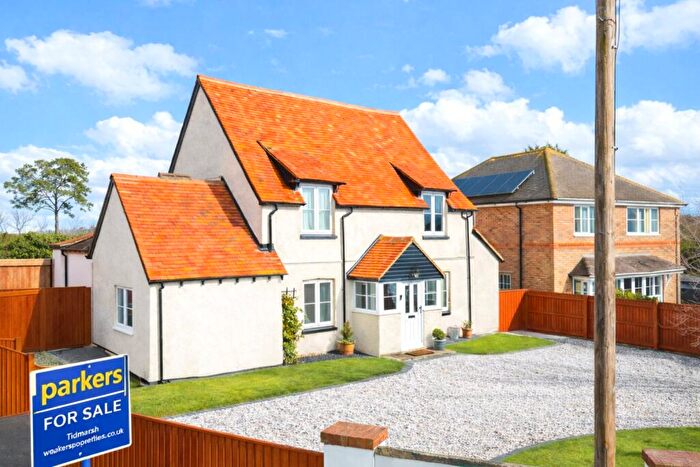
Houses for sale & to rent in Pangbourne, Reading
House Prices in Pangbourne
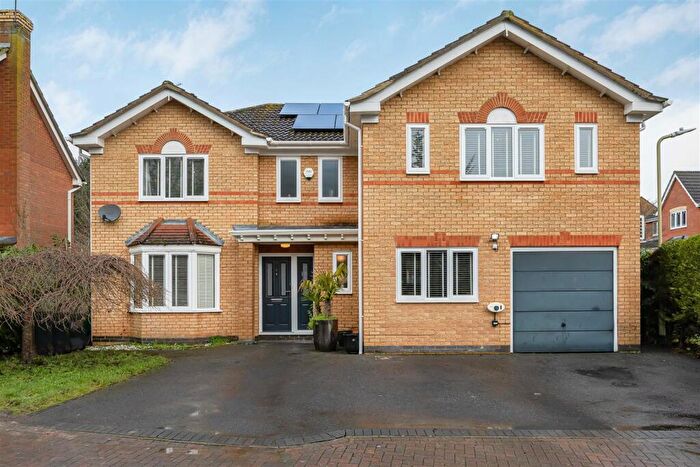
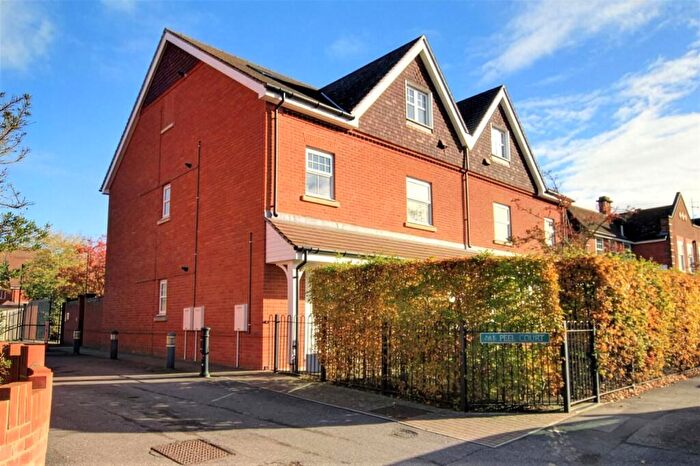
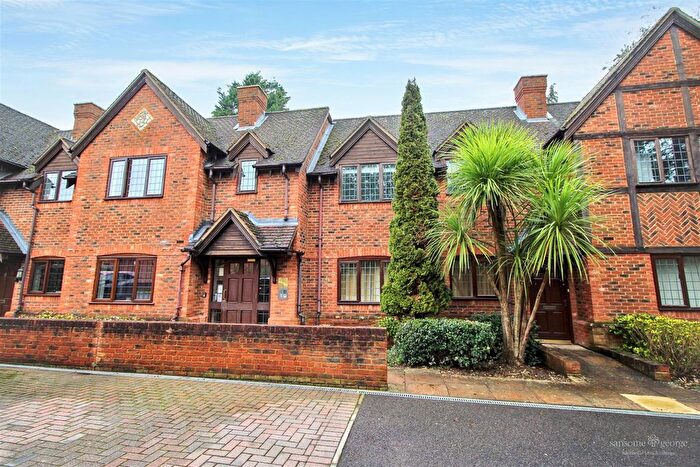
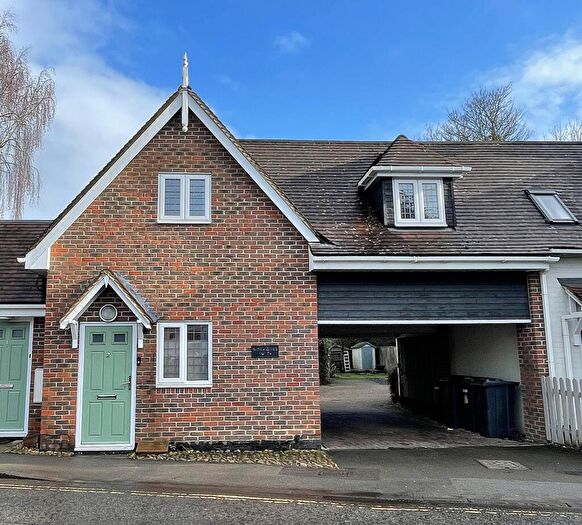
Properties in Pangbourne have an average house price of £657,255.00 and had 135 Property Transactions within the last 3 years¹.
Pangbourne is an area in Reading, West Berkshire with 1,241 households², where the most expensive property was sold for £2,815,000.00.
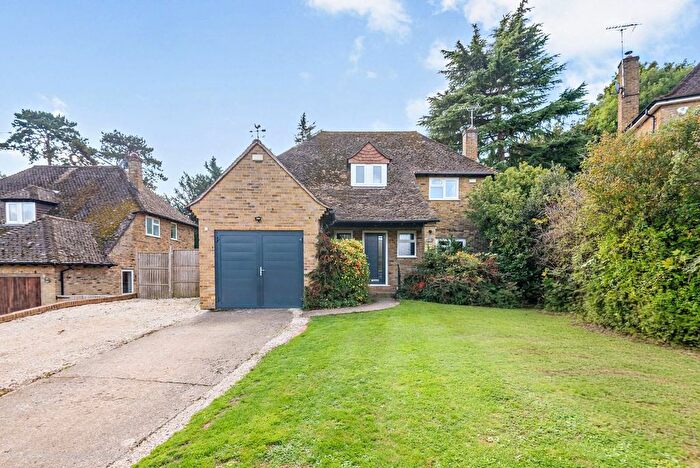
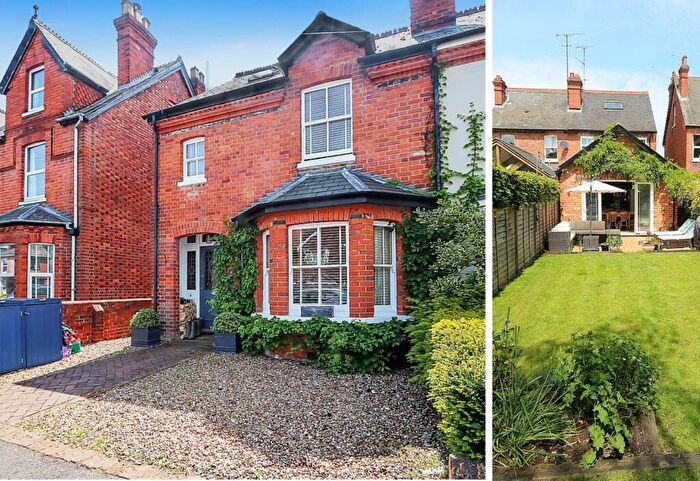
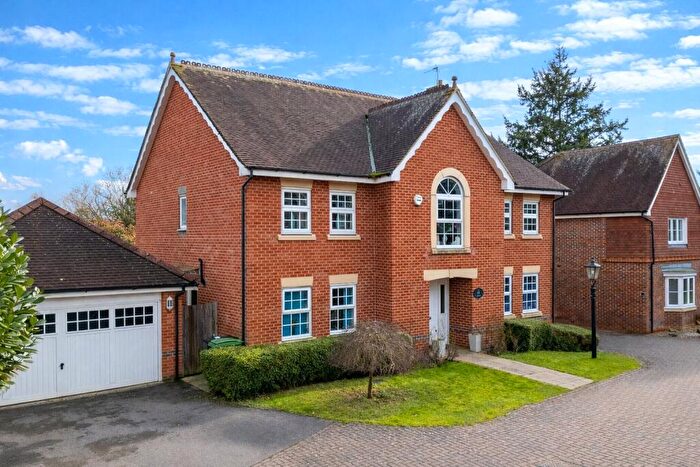
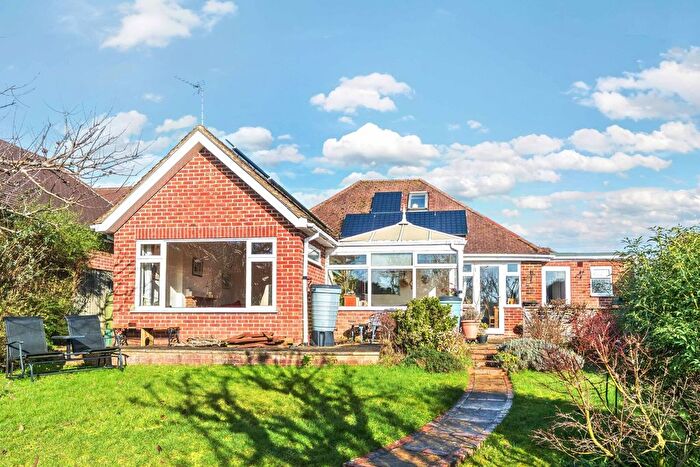
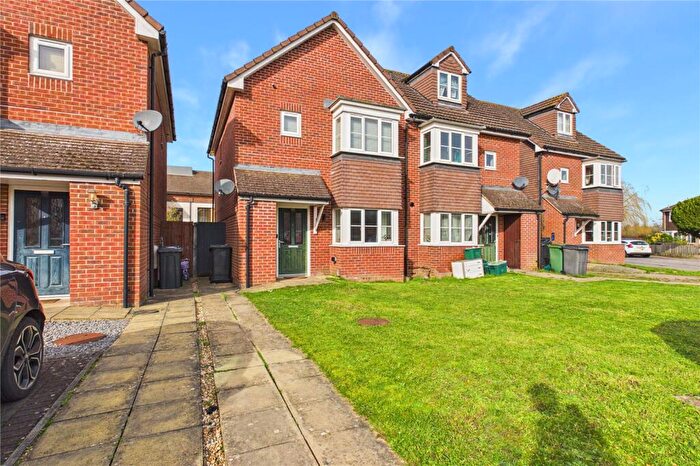
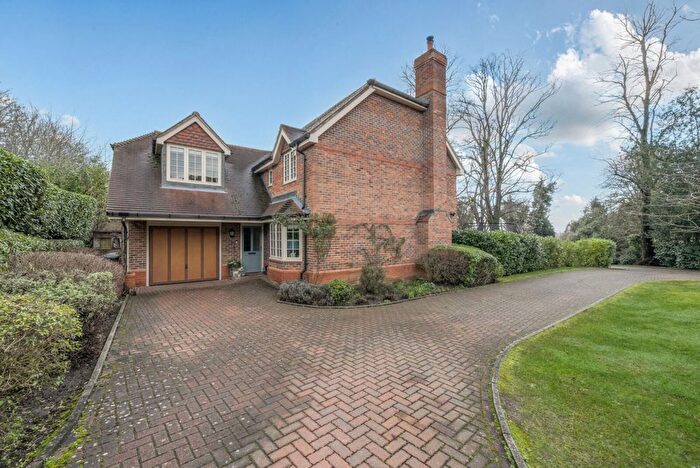
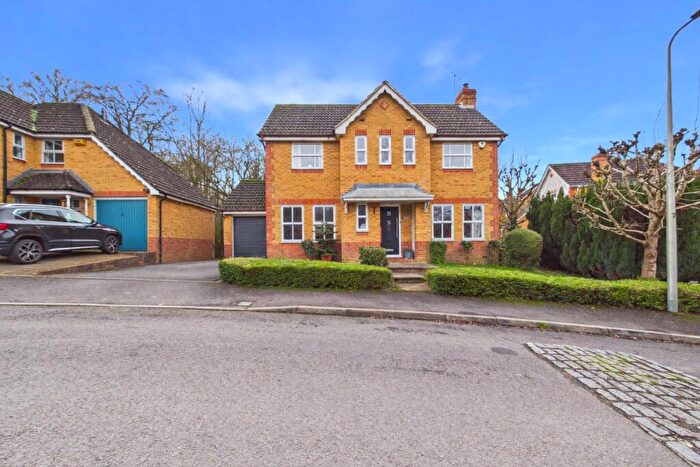
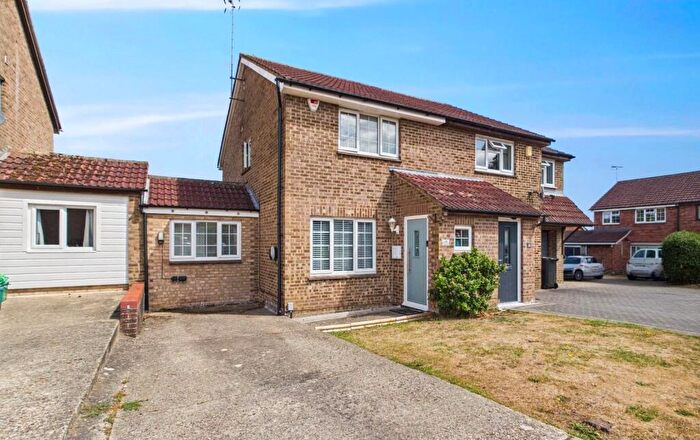
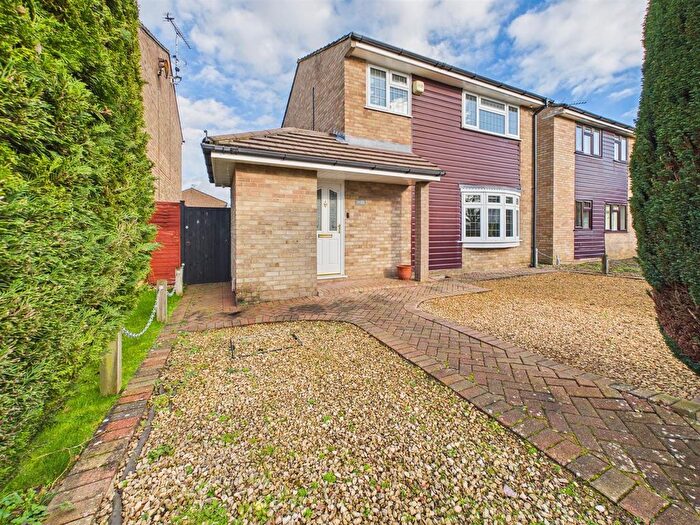
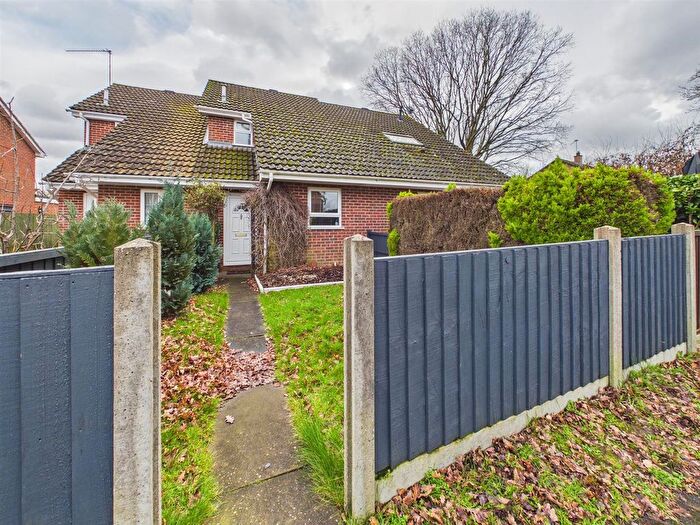
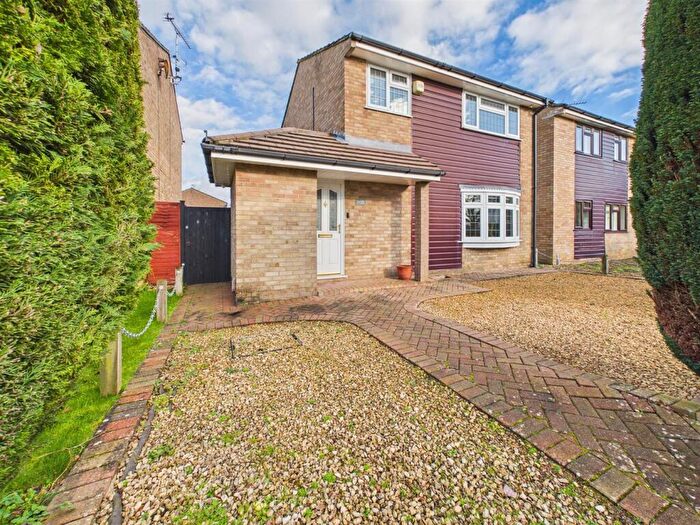
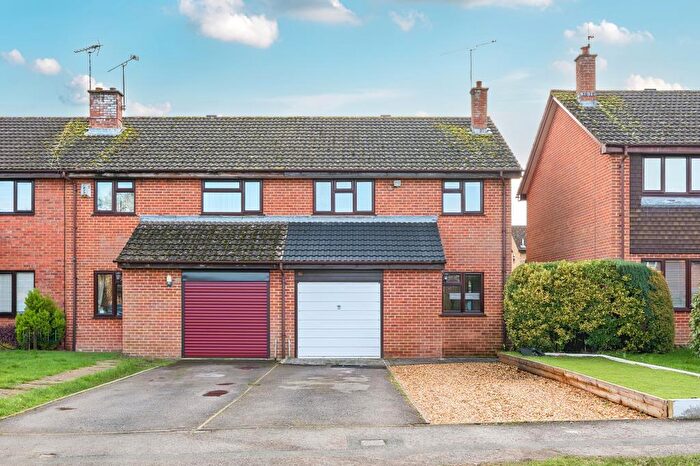
Properties for sale in Pangbourne
Roads and Postcodes in Pangbourne
Navigate through our locations to find the location of your next house in Pangbourne, Reading for sale or to rent.
| Streets | Postcodes |
|---|---|
| Aston Close | RG8 7LG RG8 7LQ |
| Bere Court | RG8 8HT |
| Bere Court Road | RG8 8JT RG8 8JU RG8 8JY RG8 8LB RG8 8HS |
| Bourne Road | RG8 7JS RG8 7JT RG8 7HT |
| Bowden Green | RG8 8JL RG8 8JN RG8 8JP |
| Breedons Hill | RG8 7AT |
| Briars Close | RG8 7LH |
| Bucknell Avenue | RG8 7JU |
| Cedar Drive | RG8 7BH |
| Chiltern Walk | RG8 7LE |
| Church Road | RG8 7AB RG8 7AA RG8 7AR |
| Courtlands Hill | RG8 7BE |
| Croft Drive | RG8 8AN |
| Dunluce Gardens | RG8 7LA |
| Ferry Lane | RG8 7DW |
| Flowers Farm Cottages | RG8 8EU |
| Flowers Hill | RG8 7BD |
| Formosa Place | RG8 7AX RG8 7FY |
| Grahame Avenue | RG8 7LF |
| Green Lane | RG8 7BG RG8 8LD |
| High Street | RG8 7AE |
| Horseshoe Park | RG8 7JW |
| Horseshoe Road | RG8 7JH RG8 7JL RG8 7JQ |
| Kennedy Drive | RG8 7JP RG8 7JR RG8 7LB RG8 7LD |
| Little Bowden Lane | RG8 8JR |
| Mansard Mews | RG8 7HD |
| Marsh Place | RG8 7GA |
| Meadow Lane | RG8 7NB RG8 7ND |
| Meadowside Road | RG8 7NG RG8 7NH RG8 7NJ RG8 7NQ RG8 7NL |
| Nunhide Lane | RG8 8EF RG8 8EG RG8 8EQ |
| Pangbourne Hill | RG8 7AS RG8 8JS RG8 8LA |
| Pangbourne Mews | RG8 7JG |
| Pangbourne Place | RG8 7LL |
| Pangbourne Road | RG8 8AW |
| Peel Court | RG8 7DQ |
| Picketts Lane | RG8 8JH |
| Purley Way | RG8 7JY |
| Railway Cottages | RG8 7BX |
| Reading Road | RG8 7HS RG8 7HY RG8 7JA RG8 7JE RG8 7JF RG8 7LR RG8 7LY RG8 7HZ RG8 7JB RG8 7JD RG8 7LU RG8 7NA |
| Riverview Road | RG8 7AU |
| Saxon Place | RG8 7HX |
| Sheffield Close | RG8 7GD |
| Shepard Place | RG8 7GB |
| Shooters Hill | RG8 7BJ RG8 7DU RG8 7DZ RG8 7EA RG8 7DX RG8 7DY |
| Short Street | RG8 7NE |
| St James Close | RG8 7AP |
| Station Road | RG8 7AN |
| Stokes View | RG8 7RP |
| Sulham Hill | RG8 8ED RG8 8EE |
| Sulham Lane | RG8 7LJ RG8 8DY |
| Sycamore Court | RG8 7BN |
| Thames Avenue | RG8 7BU RG8 7BY |
| The Moors | RG8 7LP |
| The Square | RG8 7AG RG8 7AH RG8 7AJ RG8 7AQ |
| The Wharf | RG8 7DS |
| Tidmarsh Lane | RG8 8HB |
| Tidmarsh Road | RG8 7AY RG8 7AZ RG8 7BA RG8 7BB |
| Whitchurch Hill | RG8 7ZT |
| Whitchurch Road | RG8 7BP RG8 7BQ RG8 7DN RG8 7BS RG8 7BT RG8 7DA RG8 7DP |
| Wilder Avenue | RG8 7JX |
| Willows Court | RG8 7AW |
| Woodview Road | RG8 7JN RG8 7JZ |
| Yattendon Road | RG8 8JJ |
| RG8 8PT RG8 8PU RG8 6BE RG8 6BJ RG8 6BS RG8 6DH RG8 6DQ RG8 6DS RG8 6DT RG8 6DW RG8 8ZN RG8 8ZX RG8 6DZ RG8 6ED RG8 6EE RG8 6EH RG8 6EJ RG8 6EL |
Transport near Pangbourne
-
Pangbourne Station
-
Tilehurst Station
-
Theale Station
-
Goring and Streatley Station
-
Reading West Station
- FAQ
- Price Paid By Year
- Property Type Price
Frequently asked questions about Pangbourne
What is the average price for a property for sale in Pangbourne?
The average price for a property for sale in Pangbourne is £657,255. This amount is 26% higher than the average price in Reading. There are 1,509 property listings for sale in Pangbourne.
What streets have the most expensive properties for sale in Pangbourne?
The streets with the most expensive properties for sale in Pangbourne are Riverview Road at an average of £1,625,355, Green Lane at an average of £1,617,320 and The Moors at an average of £1,285,000.
What streets have the most affordable properties for sale in Pangbourne?
The streets with the most affordable properties for sale in Pangbourne are Willows Court at an average of £192,500, Pangbourne Mews at an average of £300,000 and Whitchurch Road at an average of £307,500.
Which train stations are available in or near Pangbourne?
Some of the train stations available in or near Pangbourne are Pangbourne, Tilehurst and Theale.
Property Price Paid in Pangbourne by Year
The average sold property price by year was:
| Year | Average Sold Price | Price Change |
Sold Properties
|
|---|---|---|---|
| 2025 | £639,280 | -16% |
33 Properties |
| 2024 | £739,991 | 19% |
45 Properties |
| 2023 | £602,345 | -36% |
57 Properties |
| 2022 | £821,882 | 16% |
45 Properties |
| 2021 | £689,451 | 10% |
78 Properties |
| 2020 | £617,343 | 8% |
59 Properties |
| 2019 | £567,818 | -12% |
55 Properties |
| 2018 | £634,602 | 5% |
49 Properties |
| 2017 | £604,538 | 15% |
59 Properties |
| 2016 | £515,817 | -30% |
62 Properties |
| 2015 | £672,201 | 30% |
70 Properties |
| 2014 | £473,542 | 2% |
63 Properties |
| 2013 | £464,005 | 8% |
37 Properties |
| 2012 | £428,571 | 9% |
53 Properties |
| 2011 | £389,412 | -2% |
61 Properties |
| 2010 | £398,946 | 0,3% |
62 Properties |
| 2009 | £397,553 | -6% |
63 Properties |
| 2008 | £423,102 | 12% |
43 Properties |
| 2007 | £373,287 | 5% |
70 Properties |
| 2006 | £355,340 | 8% |
75 Properties |
| 2005 | £325,757 | -2% |
65 Properties |
| 2004 | £333,207 | 13% |
65 Properties |
| 2003 | £291,408 | 3% |
86 Properties |
| 2002 | £282,661 | -1% |
83 Properties |
| 2001 | £285,792 | 10% |
80 Properties |
| 2000 | £256,778 | 24% |
50 Properties |
| 1999 | £194,349 | 15% |
76 Properties |
| 1998 | £164,538 | 13% |
65 Properties |
| 1997 | £142,603 | 18% |
67 Properties |
| 1996 | £116,785 | -14% |
65 Properties |
| 1995 | £133,712 | - |
47 Properties |
Property Price per Property Type in Pangbourne
Here you can find historic sold price data in order to help with your property search.
The average Property Paid Price for specific property types in the last three years are:
| Property Type | Average Sold Price | Sold Properties |
|---|---|---|
| Semi Detached House | £612,361.00 | 38 Semi Detached Houses |
| Detached House | £1,250,677.00 | 34 Detached Houses |
| Terraced House | £422,691.00 | 31 Terraced Houses |
| Flat | £307,290.00 | 32 Flats |

