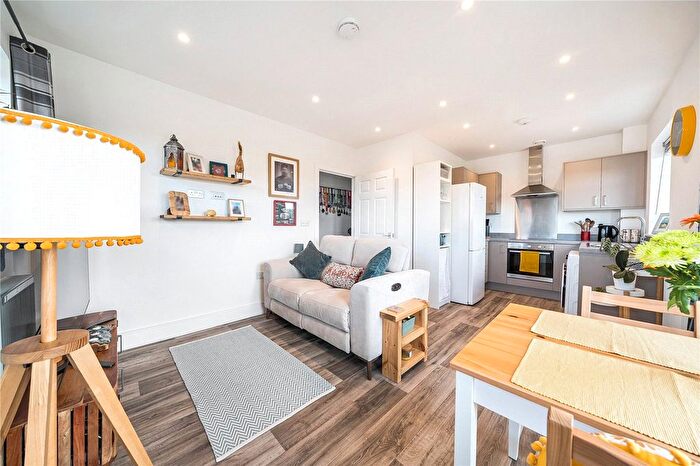
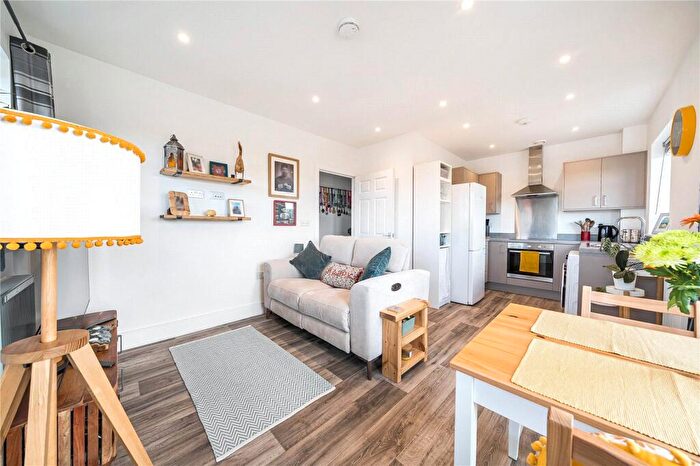
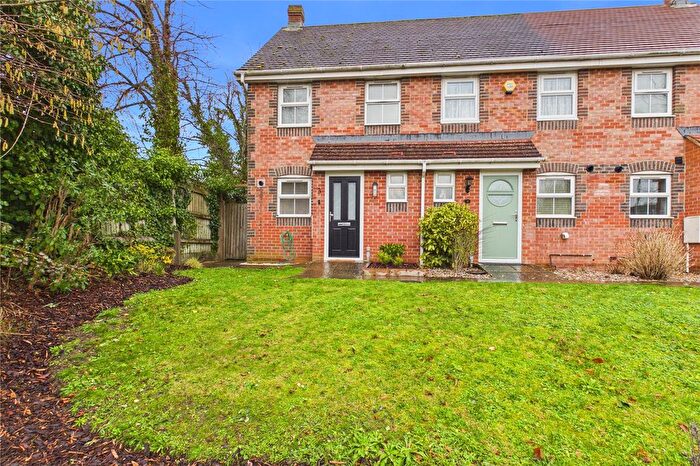
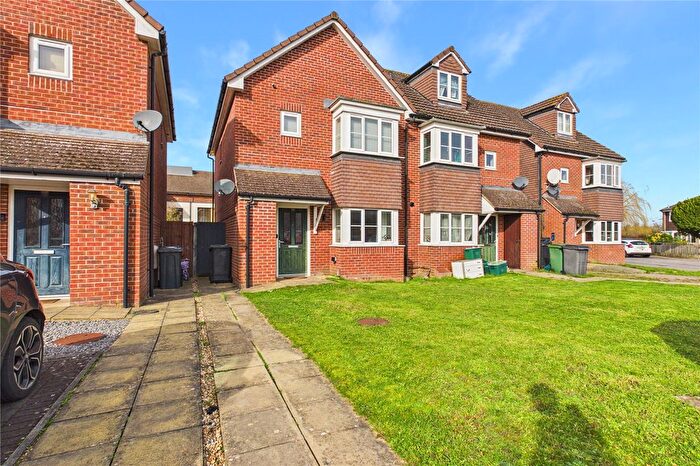
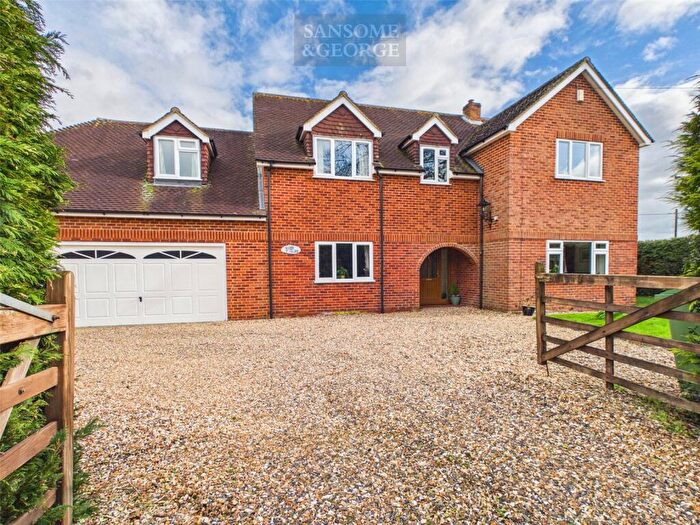
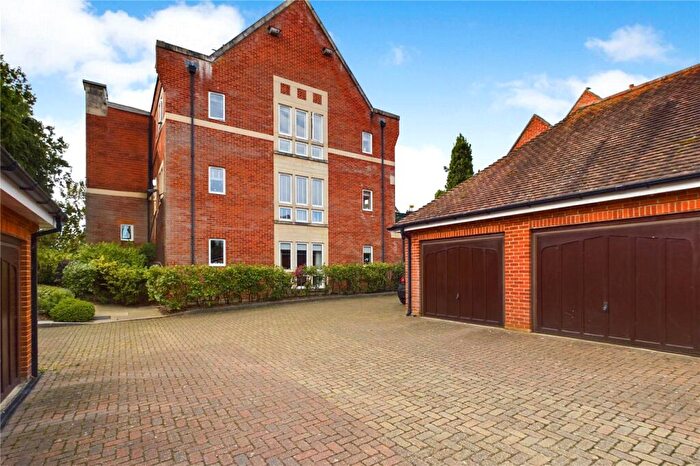
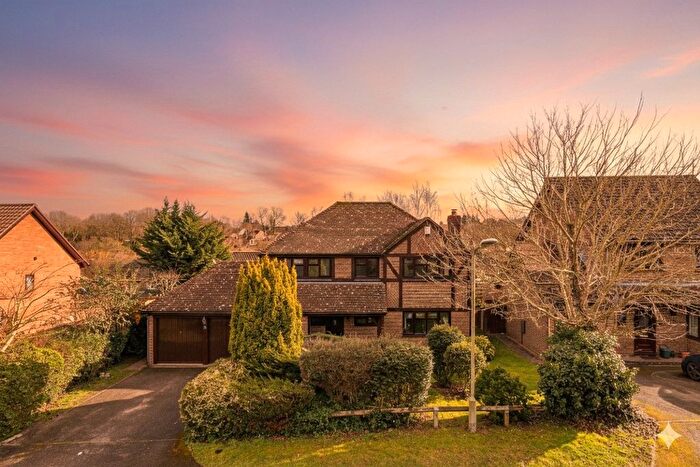
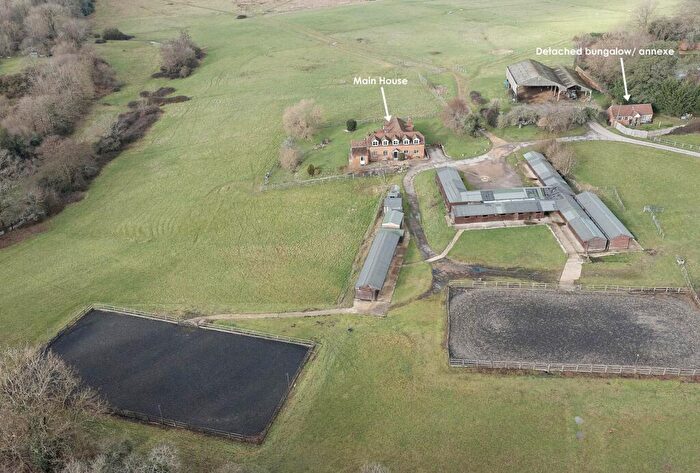
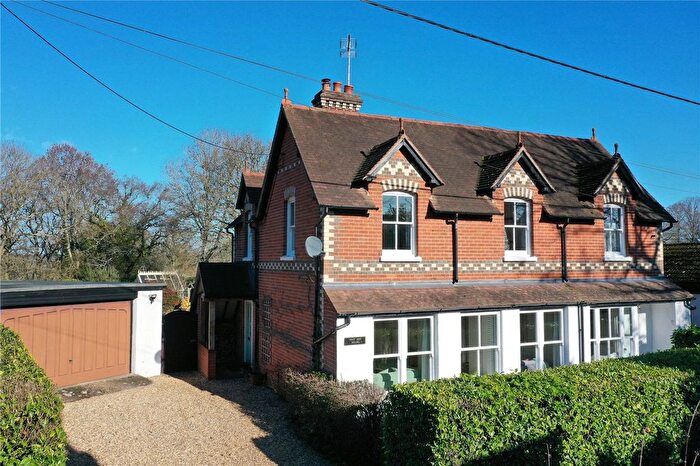
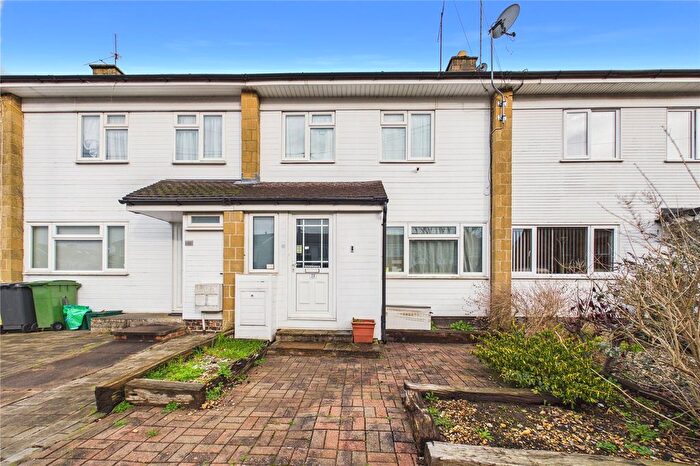
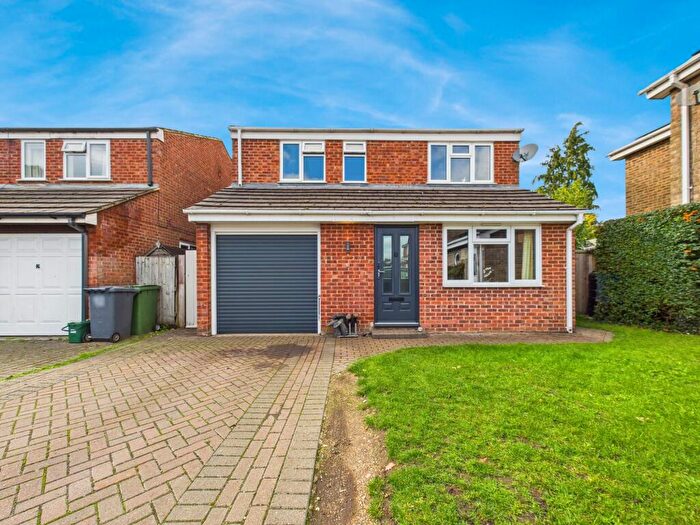
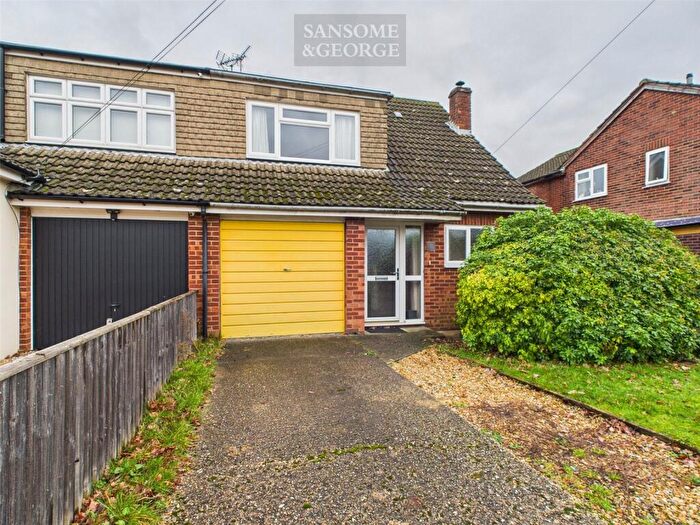
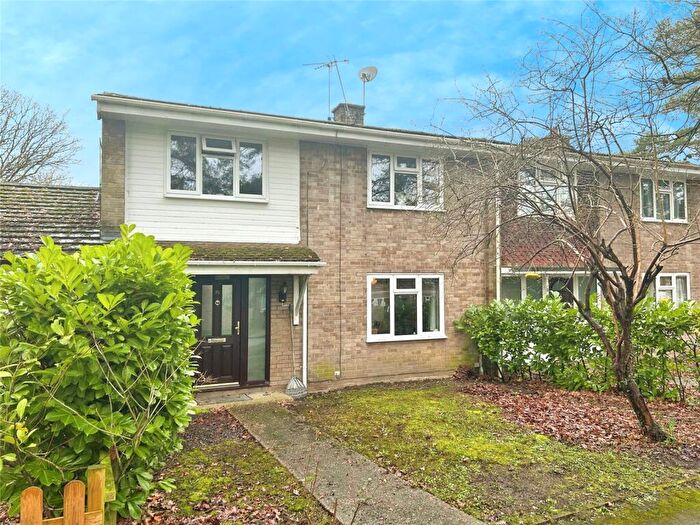
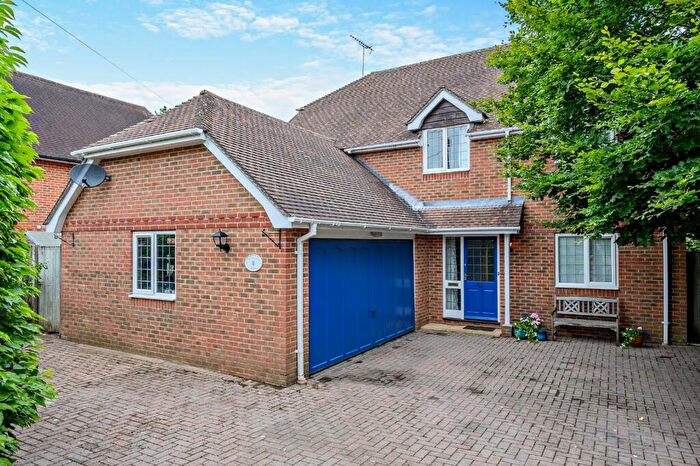
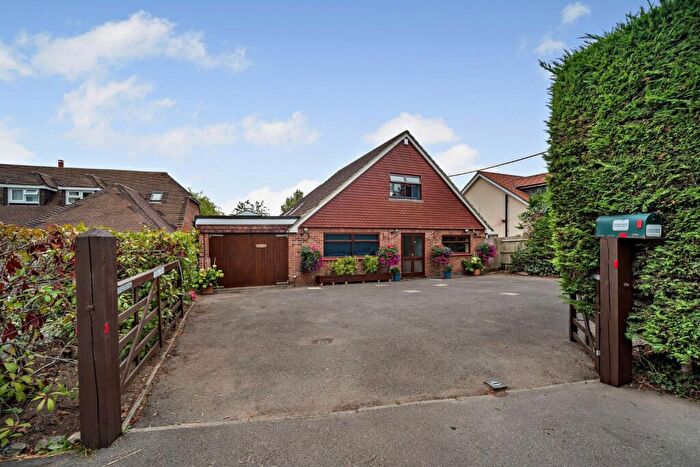
Houses for sale & to rent in Sulhamstead, Reading
House Prices in Sulhamstead
Properties in Sulhamstead have an average house price of £491,147.00 and had 69 Property Transactions within the last 3 years¹.
Sulhamstead is an area in Reading, West Berkshire with 1,006 households², where the most expensive property was sold for £1,135,000.00.
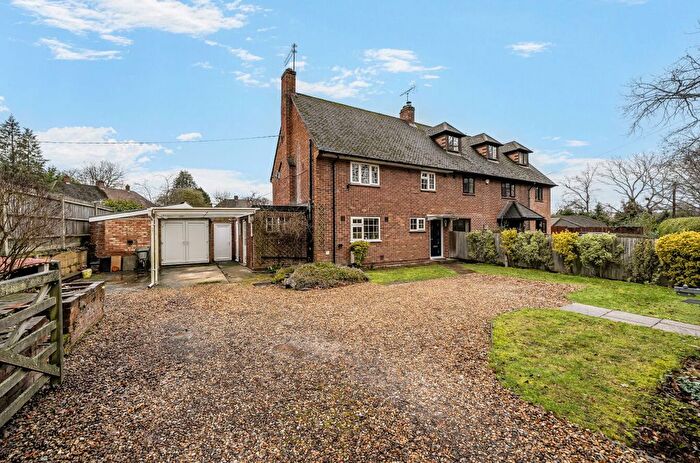
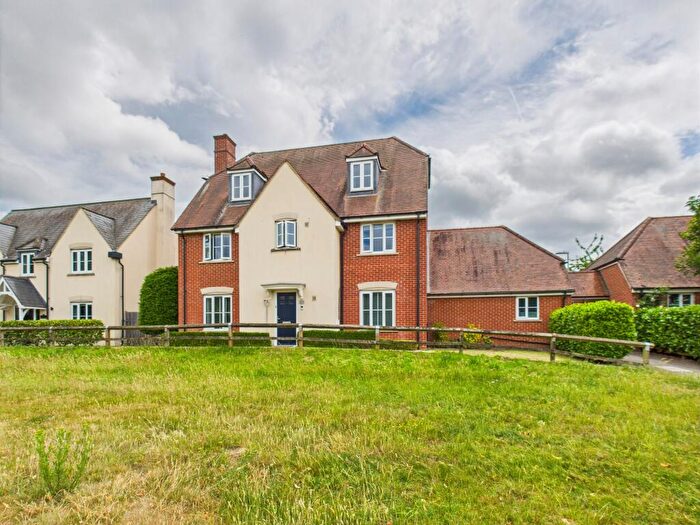
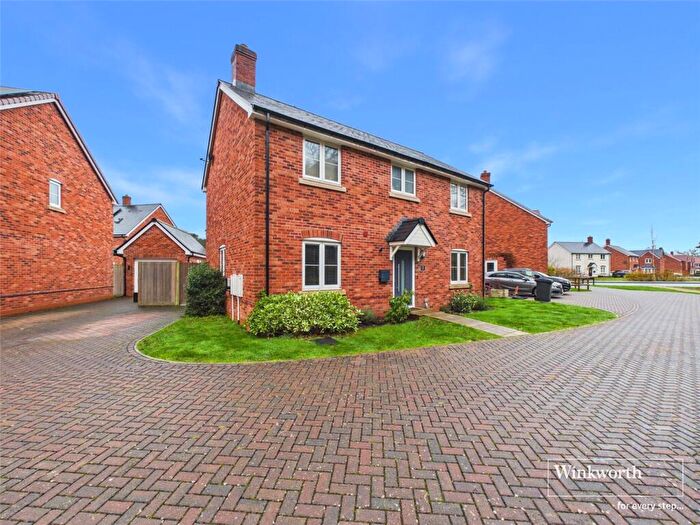
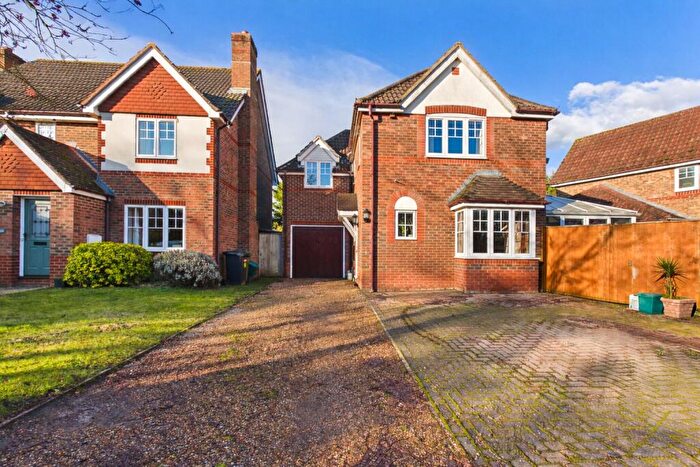
Properties for sale in Sulhamstead
Roads and Postcodes in Sulhamstead
Navigate through our locations to find the location of your next house in Sulhamstead, Reading for sale or to rent.
| Streets | Postcodes |
|---|---|
| Abbots Road | RG7 3LD RG7 3LE |
| Acorn Gardens | RG7 3GN |
| Alder Glade | RG7 3HW |
| Alison Close | RG7 3QP |
| Awberry Fields | RG7 5NX |
| Back Lane | RG7 5NF RG7 5NG |
| Bannister Road | RG7 3LG |
| Bath Road | RG7 5HJ RG7 5JB RG7 5QE |
| Beenham Hill | RG7 5LR RG7 5LS RG7 5LT RG7 5LU RG7 5LX |
| Bluebell Drive | RG7 3EF |
| Bottom Lane | RG7 4BH RG7 4BL RG7 4BN RG7 4BW |
| Bourne Lane | RG7 5NS RG7 5NY |
| Brackenwood | RG7 3QF |
| Bramble Close | RG7 3GW |
| Brocas Road | RG7 3AF RG7 3QL |
| Church View | RG7 5NL |
| Clay Hill | RG7 5PG RG7 5PH RG7 5PN |
| Clay Lane | RG7 5PA RG7 5PB RG7 5PD RG7 5PE |
| Grange Lane | RG7 5PT RG7 5PX |
| Hall Place Cottages | RG7 5PL |
| Heron Way | RG7 4UU |
| Hollybush Lane | RG7 3JR RG7 3JS |
| Mallard Way | RG7 4US RG7 4UT RG7 4UX |
| Mount Pleasant | RG7 5NU |
| Normoor Road | RG7 3QG RG7 3QQ |
| North Street | RG7 5EX |
| Padworth Road | RG7 3QE |
| Picklepythe Lane | RG7 5NT |
| Reading Road | RG7 3PY |
| St Michaels Lane | RG7 4DJ RG7 4DP |
| Stoneyfield | RG7 5ND RG7 5NE |
| Sulhamstead Hill | RG7 4DA RG7 4DB RG7 4DE |
| The Green | RG7 5NP |
| The Strouds | RG7 5NW |
| The Warings | RG7 5NB |
| Three Firs Way | RG7 3QH RG7 3QJ |
| Tyle Mill Cottages | RG7 4BT |
| Vine Cottages | RG7 5EY |
| Webbs Lane | RG7 5LH RG7 5LL RG7 5LW |
| Whites Hill | RG7 4EJ RG7 4EN |
| Whites Hill Cottages | RG7 4EL |
| Wickens Corner | RG7 5NH RG7 5NJ |
| Woodmans Lane | RG7 3LH RG7 3LJ |
| RG7 4BA RG7 4BS RG7 4ED RG7 4EE RG7 5LY RG7 5NA RG7 5NN RG7 5NR |
Transport near Sulhamstead
- FAQ
- Price Paid By Year
- Property Type Price
Frequently asked questions about Sulhamstead
What is the average price for a property for sale in Sulhamstead?
The average price for a property for sale in Sulhamstead is £491,147. This amount is 6% lower than the average price in Reading. There are 1,608 property listings for sale in Sulhamstead.
What streets have the most expensive properties for sale in Sulhamstead?
The streets with the most expensive properties for sale in Sulhamstead are North Street at an average of £1,135,000, Webbs Lane at an average of £878,333 and Bourne Lane at an average of £875,000.
What streets have the most affordable properties for sale in Sulhamstead?
The streets with the most affordable properties for sale in Sulhamstead are Brocas Road at an average of £170,000, Three Firs Way at an average of £355,357 and Acorn Gardens at an average of £379,600.
Which train stations are available in or near Sulhamstead?
Some of the train stations available in or near Sulhamstead are Aldermaston, Theale and Midgham.
Property Price Paid in Sulhamstead by Year
The average sold property price by year was:
| Year | Average Sold Price | Price Change |
Sold Properties
|
|---|---|---|---|
| 2025 | £488,773 | -4% |
32 Properties |
| 2024 | £510,029 | 6% |
17 Properties |
| 2023 | £478,897 | 9% |
20 Properties |
| 2022 | £434,183 | -28% |
29 Properties |
| 2021 | £557,166 | 25% |
51 Properties |
| 2020 | £417,998 | 9% |
34 Properties |
| 2019 | £382,457 | -31% |
34 Properties |
| 2018 | £499,333 | 21% |
39 Properties |
| 2017 | £395,439 | -21% |
34 Properties |
| 2016 | £478,123 | 26% |
44 Properties |
| 2015 | £354,780 | 6% |
41 Properties |
| 2014 | £332,126 | -9% |
52 Properties |
| 2013 | £361,469 | 8% |
33 Properties |
| 2012 | £331,608 | 13% |
24 Properties |
| 2011 | £287,226 | -10% |
39 Properties |
| 2010 | £316,708 | -6% |
37 Properties |
| 2009 | £336,086 | 6% |
23 Properties |
| 2008 | £315,184 | 5% |
16 Properties |
| 2007 | £299,432 | 2% |
43 Properties |
| 2006 | £293,865 | 11% |
65 Properties |
| 2005 | £260,887 | -11% |
93 Properties |
| 2004 | £289,765 | 11% |
49 Properties |
| 2003 | £259,293 | 15% |
33 Properties |
| 2002 | £221,397 | 8% |
55 Properties |
| 2001 | £203,434 | 2% |
36 Properties |
| 2000 | £200,007 | 2% |
49 Properties |
| 1999 | £196,838 | 36% |
44 Properties |
| 1998 | £125,233 | 2% |
71 Properties |
| 1997 | £122,277 | -3% |
93 Properties |
| 1996 | £125,440 | 22% |
26 Properties |
| 1995 | £97,573 | - |
24 Properties |
Property Price per Property Type in Sulhamstead
Here you can find historic sold price data in order to help with your property search.
The average Property Paid Price for specific property types in the last three years are:
| Property Type | Average Sold Price | Sold Properties |
|---|---|---|
| Semi Detached House | £437,430.00 | 25 Semi Detached Houses |
| Detached House | £677,040.00 | 25 Detached Houses |
| Terraced House | £344,496.00 | 15 Terraced Houses |
| Flat | £215,000.00 | 4 Flats |

