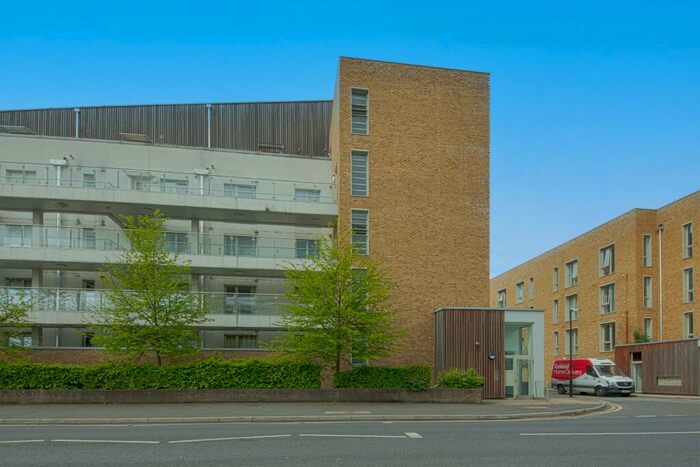
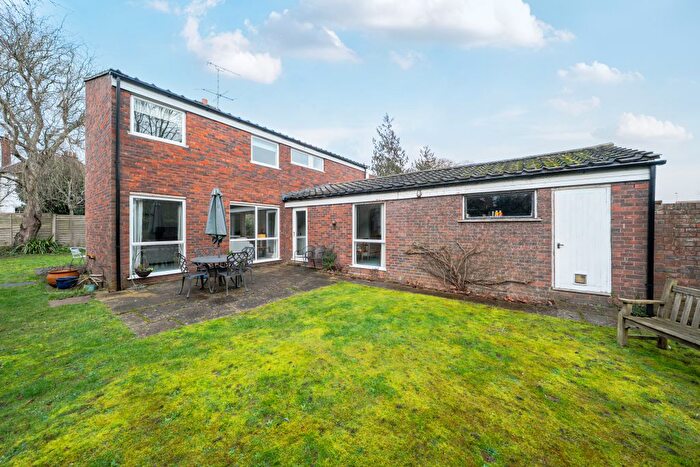
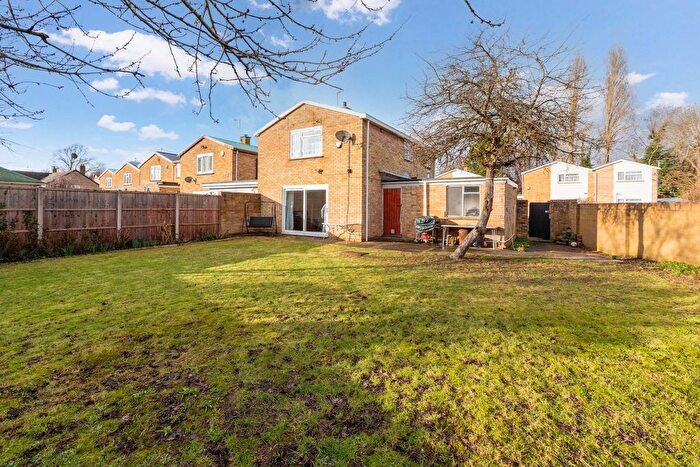
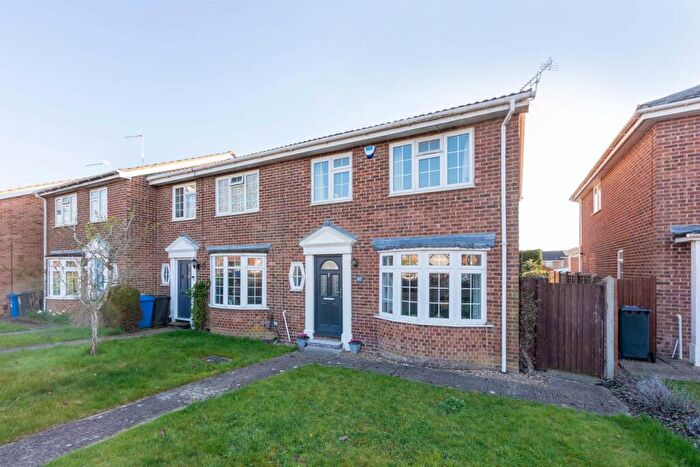
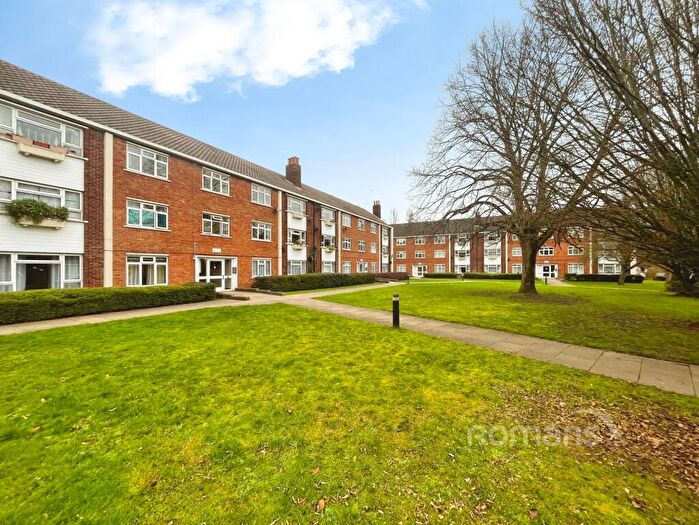
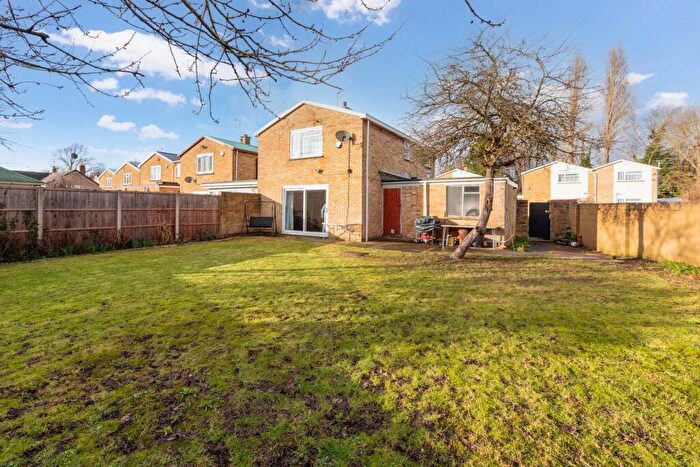
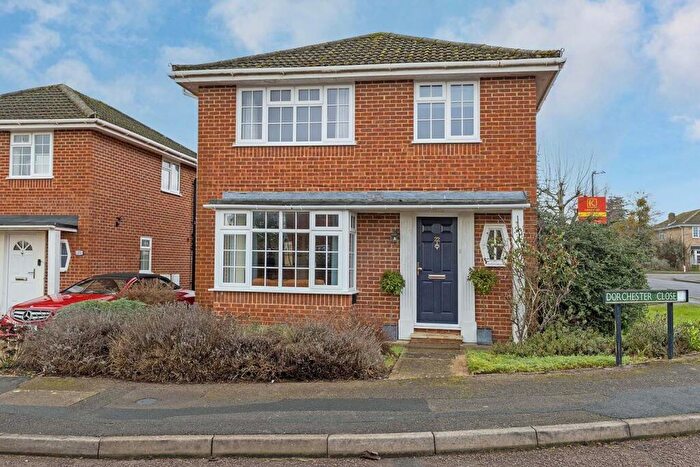
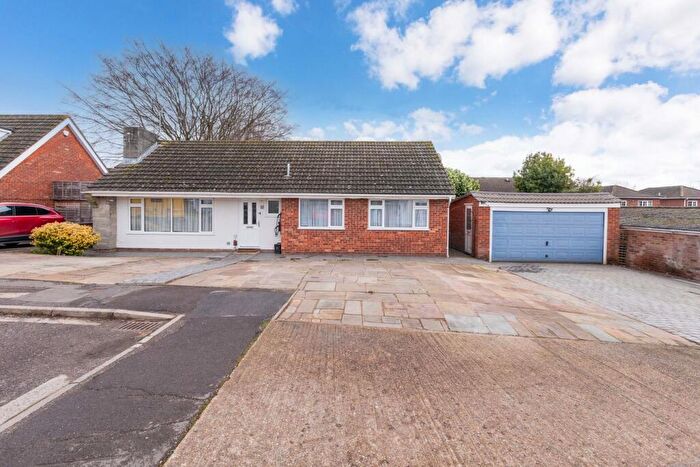
Houses for sale & to rent in Maidenhead, Windsor and Maidenhead
House Prices in Maidenhead
Properties in Maidenhead have an average house price of £601,868.00 and had 2,787 Property Transactions within the last 3 years.¹
Maidenhead is an area in Windsor and Maidenhead with 29,020 households², where the most expensive property was sold for £6,425,000.00.
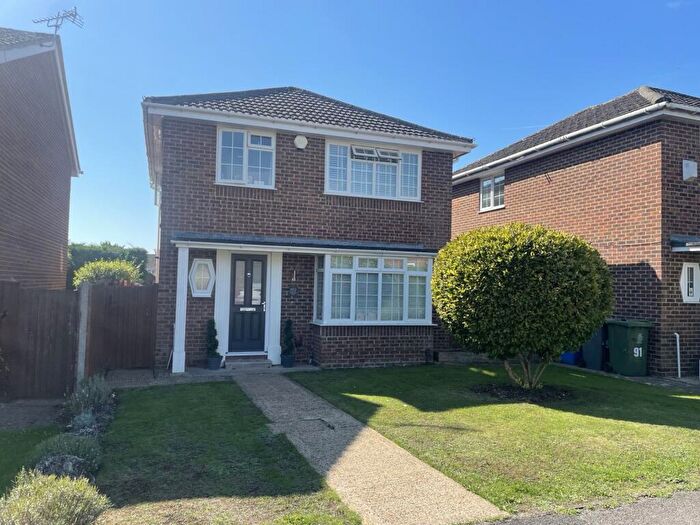
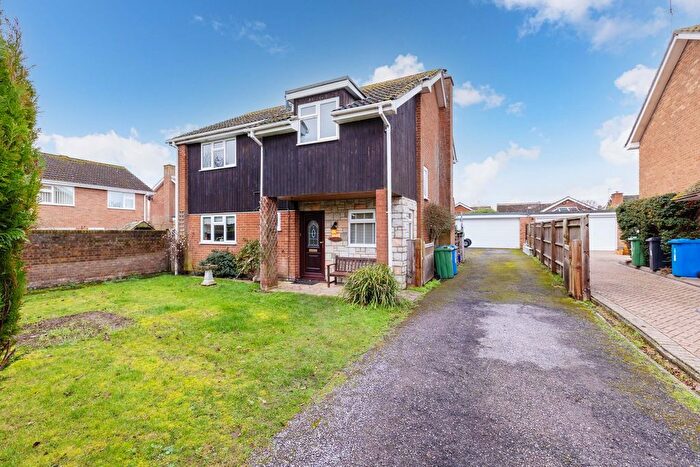
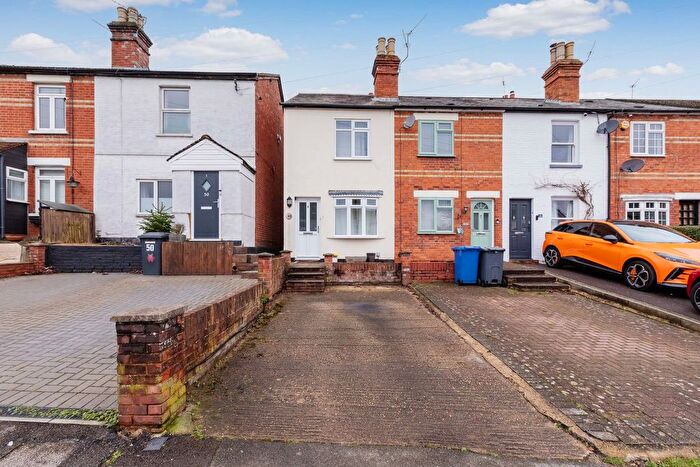
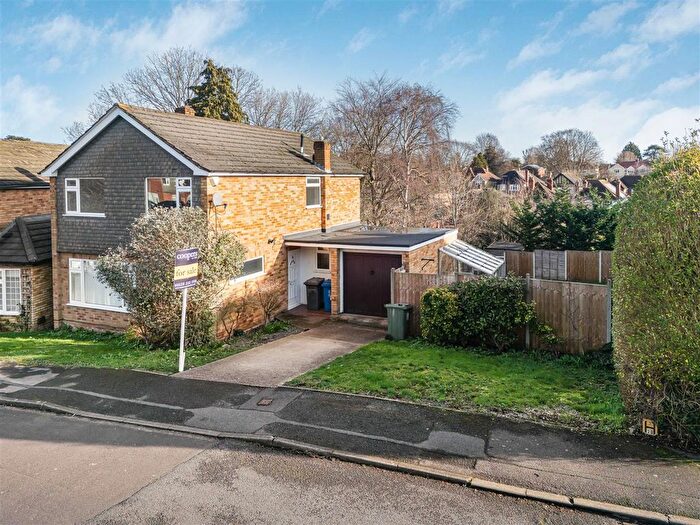
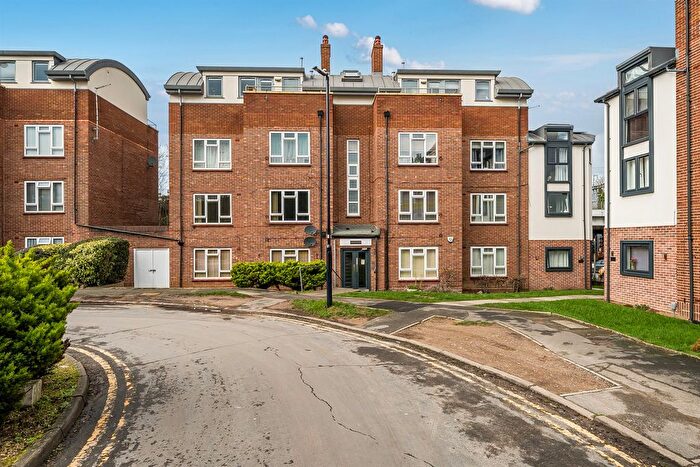
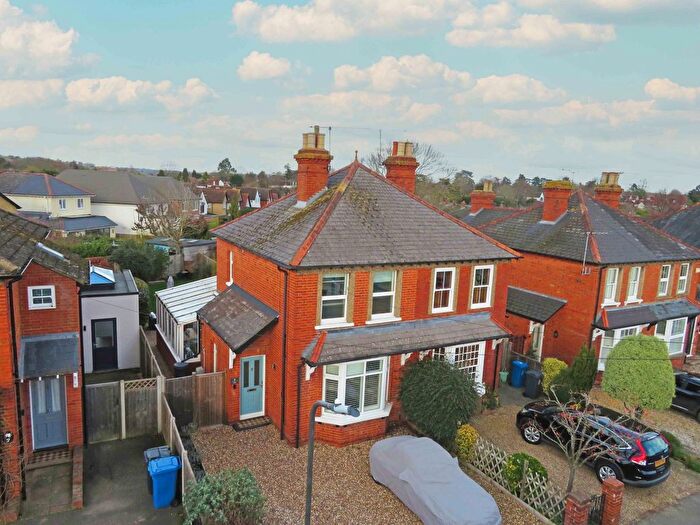
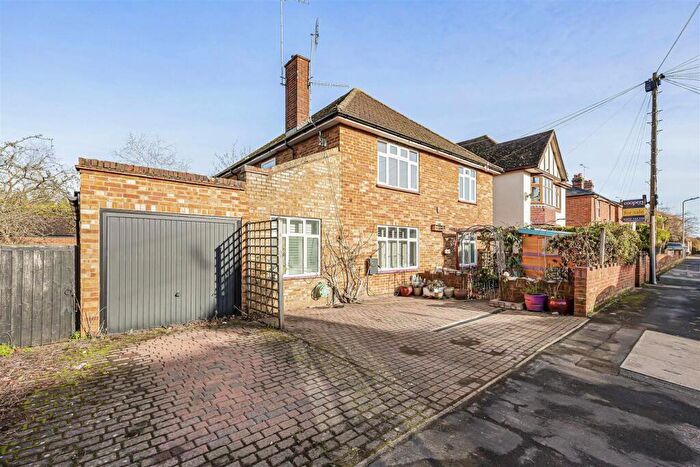
Properties for sale in Maidenhead
Neighbourhoods in Maidenhead
Navigate through our locations to find the location of your next house in Maidenhead, Windsor and Maidenhead for sale or to rent.
Transport in Maidenhead
Please see below transportation links in this area:
- FAQ
- Price Paid By Year
- Property Type Price
Frequently asked questions about Maidenhead
What is the average price for a property for sale in Maidenhead?
The average price for a property for sale in Maidenhead is £601,868. This amount is 6% lower than the average price in Windsor and Maidenhead. There are more than 10,000 property listings for sale in Maidenhead.
What locations have the most expensive properties for sale in Maidenhead?
The locations with the most expensive properties for sale in Maidenhead are Hurley & Walthams at an average of £1,324,444, Bisham And Cookham at an average of £966,991 and Hurley And Walthams at an average of £794,502.
What locations have the most affordable properties for sale in Maidenhead?
The locations with the most affordable properties for sale in Maidenhead are Riverside at an average of £358,038, St Mary's at an average of £360,194 and Oldfield at an average of £487,981.
Which train stations are available in or near Maidenhead?
Some of the train stations available in or near Maidenhead are Maidenhead, Furze Platt and Taplow.
Property Price Paid in Maidenhead by Year
The average sold property price by year was:
| Year | Average Sold Price | Price Change |
Sold Properties
|
|---|---|---|---|
| 2025 | £599,227 | -3% |
846 Properties |
| 2024 | £614,238 | 4% |
1,028 Properties |
| 2023 | £590,387 | -6% |
913 Properties |
| 2022 | £624,916 | 4% |
1,201 Properties |
| 2021 | £597,023 | 10% |
1,498 Properties |
| 2020 | £535,242 | 1% |
951 Properties |
| 2019 | £530,985 | 4% |
1,125 Properties |
| 2018 | £507,500 | -1% |
1,102 Properties |
| 2017 | £514,968 | -1% |
1,127 Properties |
| 2016 | £520,590 | 10% |
1,168 Properties |
| 2015 | £467,468 | 7% |
1,300 Properties |
| 2014 | £434,228 | 10% |
1,411 Properties |
| 2013 | £389,724 | 1% |
1,245 Properties |
| 2012 | £384,346 | 1% |
934 Properties |
| 2011 | £381,348 | 3% |
905 Properties |
| 2010 | £370,939 | 8% |
1,101 Properties |
| 2009 | £342,006 | -3% |
932 Properties |
| 2008 | £352,013 | -5% |
825 Properties |
| 2007 | £368,610 | 13% |
1,599 Properties |
| 2006 | £320,109 | 6% |
1,727 Properties |
| 2005 | £299,947 | -2% |
1,304 Properties |
| 2004 | £306,351 | 11% |
1,459 Properties |
| 2003 | £274,041 | 6% |
1,385 Properties |
| 2002 | £256,823 | 8% |
1,708 Properties |
| 2001 | £237,192 | 8% |
1,500 Properties |
| 2000 | £219,029 | 15% |
1,351 Properties |
| 1999 | £185,853 | 14% |
1,774 Properties |
| 1998 | £159,103 | 15% |
1,473 Properties |
| 1997 | £134,548 | 11% |
1,755 Properties |
| 1996 | £119,219 | 3% |
1,616 Properties |
| 1995 | £115,359 | - |
1,190 Properties |
Property Price per Property Type in Maidenhead
Here you can find historic sold price data in order to help with your property search.
The average Property Paid Price for specific property types in the last three years are:
| Property Type | Average Sold Price | Sold Properties |
|---|---|---|
| Semi Detached House | £565,751.00 | 714 Semi Detached Houses |
| Terraced House | £475,393.00 | 563 Terraced Houses |
| Detached House | £1,002,796.00 | 787 Detached Houses |
| Flat | £299,604.00 | 723 Flats |

