
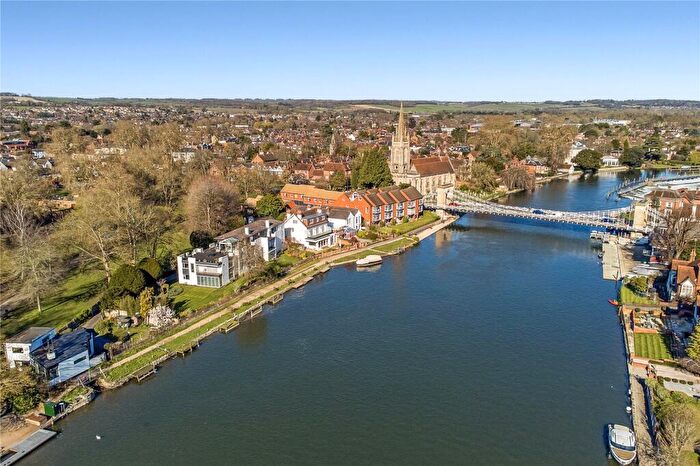
Houses for sale & to rent in Bisham And Cookham, Marlow
House Prices in Bisham And Cookham
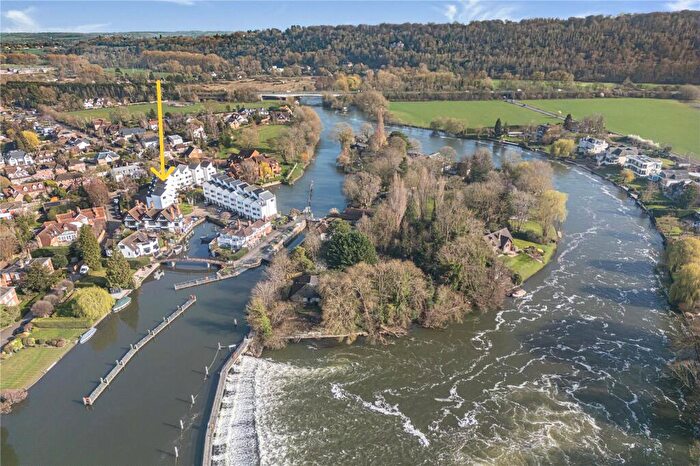
Properties in Bisham And Cookham have an average house price of £785k and had 30 Property Transactions within the last 3 years¹.
Bisham And Cookham is an area in Marlow, Windsor and Maidenhead with 278 households², where the most expensive property was sold for £2M.
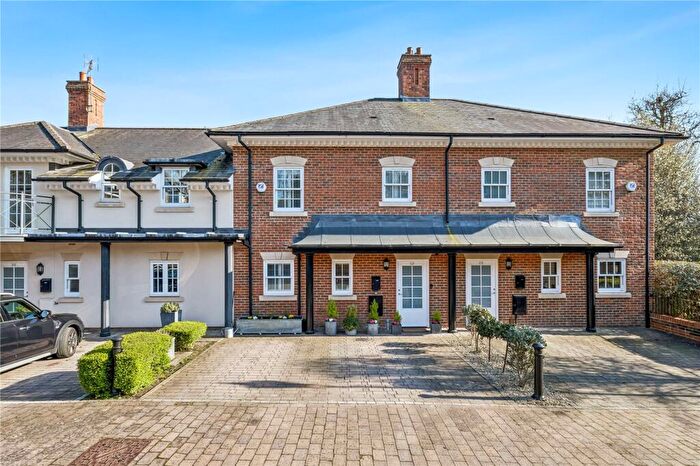
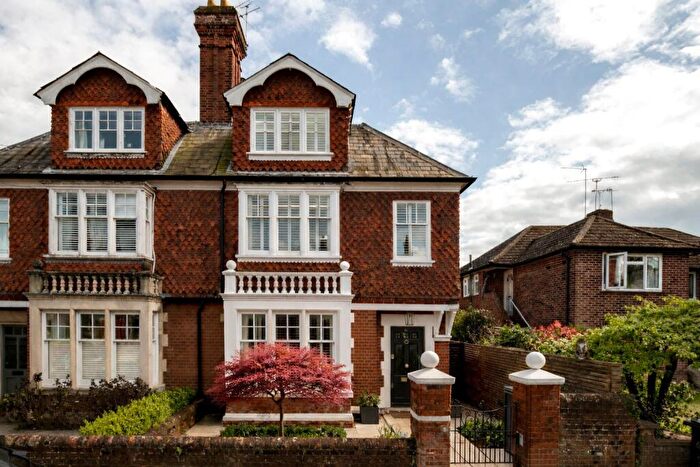
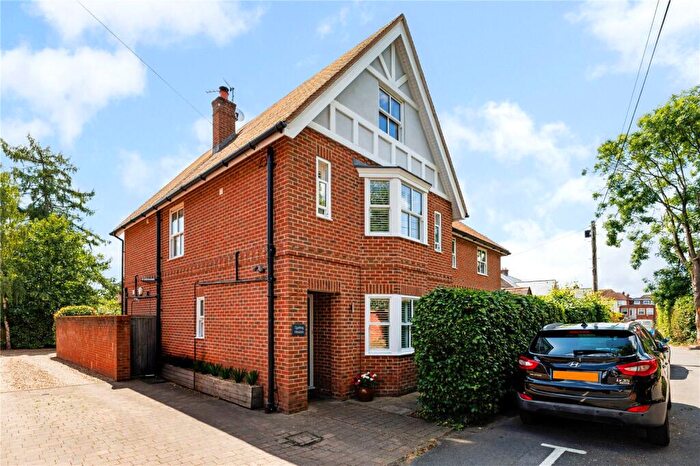
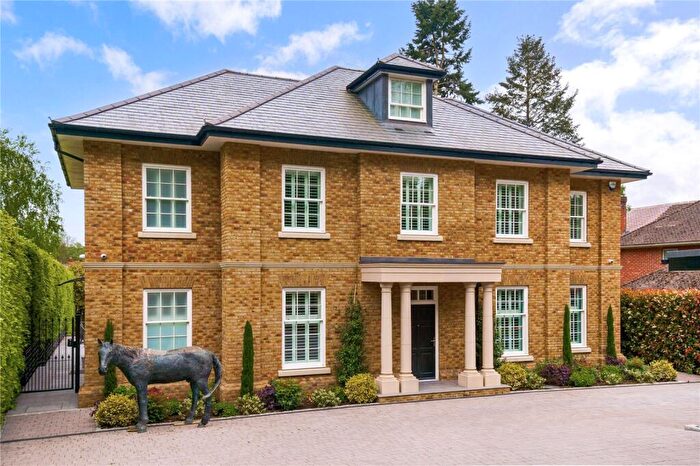
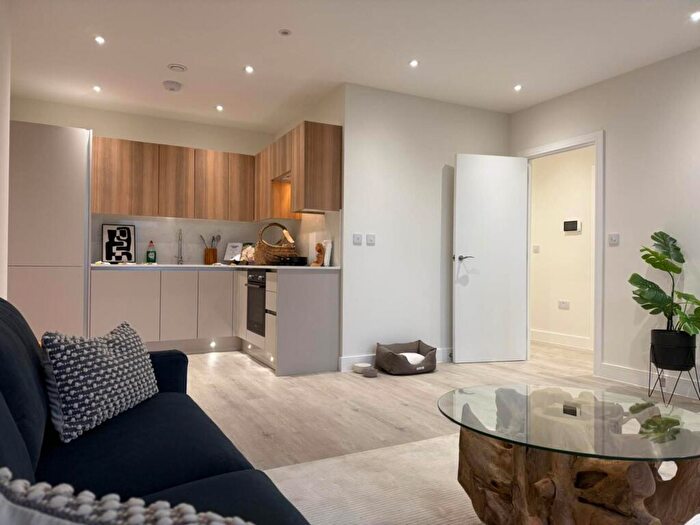
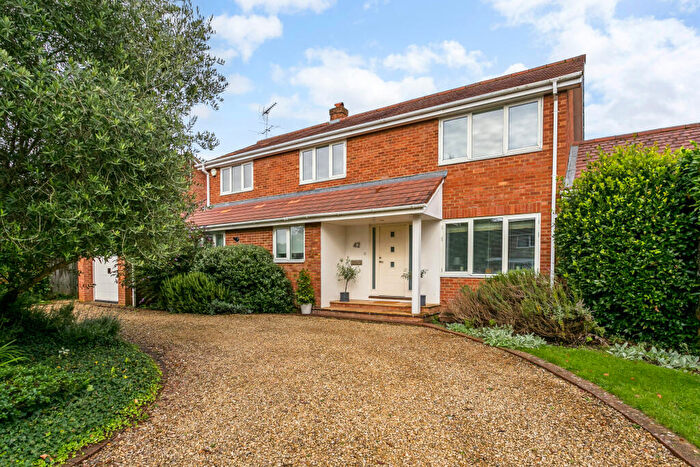
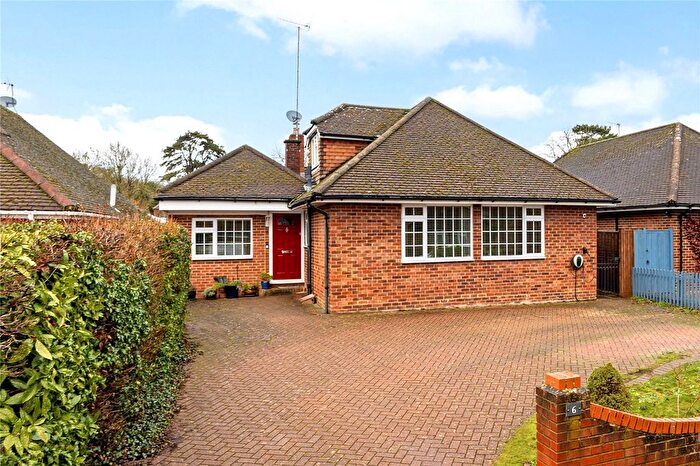
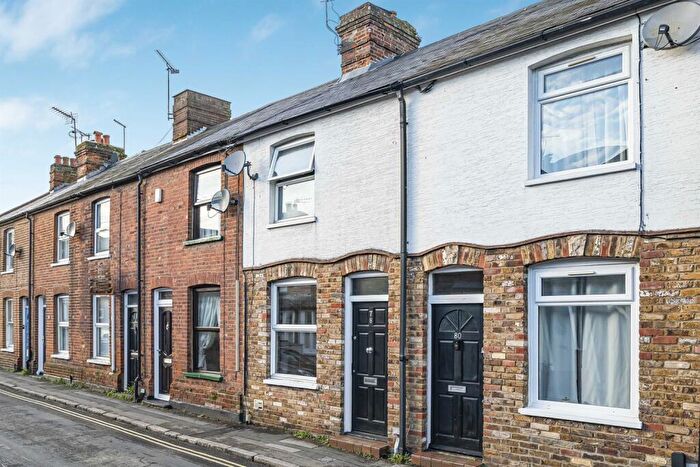
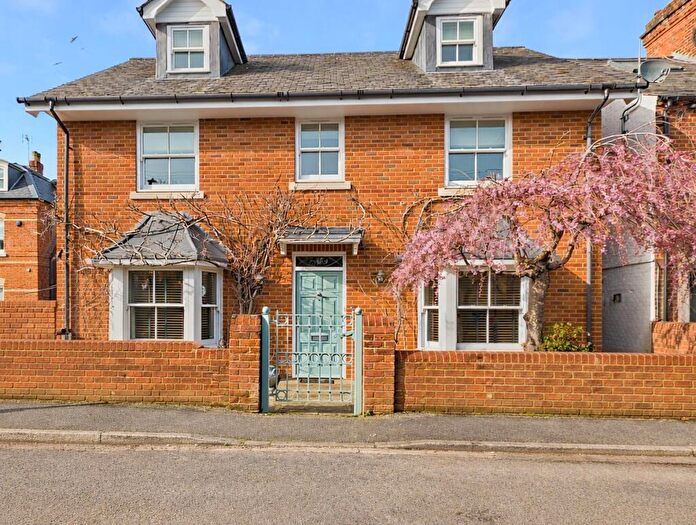
Properties for sale in Bisham And Cookham
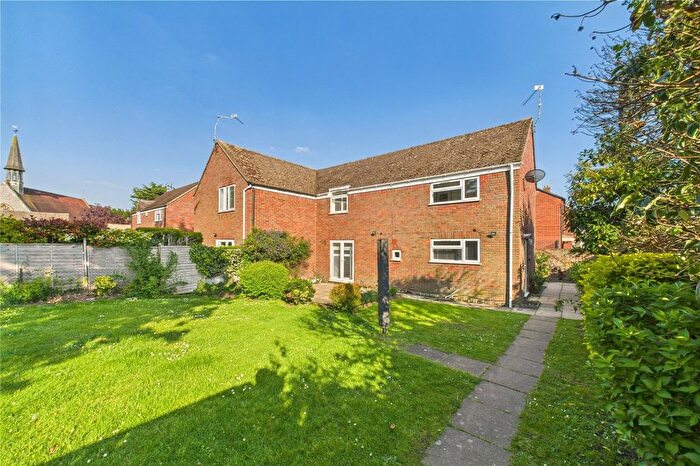
![]()
If you are looking to sell your house, let it out, or receive a property valuation, an expert can help you.
Click the button below to get started.


Roads and Postcodes in Bisham And Cookham
Navigate through our locations to find the location of your next house in Bisham And Cookham, Marlow for sale or to rent.
| Streets | Postcodes |
|---|---|
| Bisham Court | SL7 1SD |
| Bisham Road | SL7 1RL SL7 1RN SL7 1RP |
| Bisham Village | SL7 1RR SL7 1RX |
| Church Lane | SL7 1RW |
| Marlow Bridge Lane | SL7 1RH SL7 1RJ |
| Quarry Wood Road | SL7 1RE SL7 1RQ |
| Quarrywood | SL7 1RF |
| Rivermead Court | SL7 1SJ |
| Temple Lane | SL7 1RS SL7 1SA |
| Temple Mill Island | SL7 1SG SL7 1SQ |
| The Green | SL7 1RY |
| Vansittart Road | SL7 1RU |
Transport near Bisham And Cookham

- FAQ
- Price Paid By Year
- Property Type Price
Frequently asked questions about Bisham And Cookham
What is the average price for a property for sale in Bisham And Cookham?
The average price for a property for sale in Bisham And Cookham is £784,695. This amount is 35% lower than the average price in Marlow. There are 654 property listings for sale in Bisham And Cookham.
What streets have the most expensive properties for sale in Bisham And Cookham?
The streets with the most expensive properties for sale in Bisham And Cookham are Bisham Road at an average of £1,597,500, Marlow Bridge Lane at an average of £1,287,500 and Temple Lane at an average of £825,250.
What streets have the most affordable properties for sale in Bisham And Cookham?
The streets with the most affordable properties for sale in Bisham And Cookham are Rivermead Court at an average of £573,775, Bisham Village at an average of £629,928 and Vansittart Road at an average of £725,000.
Which train stations are available in or near Bisham And Cookham?
Some of the train stations available in or near Bisham And Cookham are Marlow, Cookham and Furze Platt.
Property Price Paid in Bisham And Cookham by Year
The average sold property price by year was:
| Year | Average Sold Price | Price Change |
Sold Properties
|
|---|---|---|---|
| 2025 | £769,062 | -14% |
8 Properties |
| 2024 | £873,500 | 26% |
14 Properties |
| 2023 | £644,918 | -101% |
8 Properties |
| 2022 | £1,293,089 | 43% |
14 Properties |
| 2021 | £737,260 | -68% |
25 Properties |
| 2020 | £1,241,107 | 42% |
14 Properties |
| 2019 | £722,500 | -96% |
4 Properties |
| 2018 | £1,418,358 | 51% |
18 Properties |
| 2017 | £689,378 | -21% |
14 Properties |
| 2016 | £832,058 | -34% |
17 Properties |
| 2015 | £1,113,762 | 29% |
20 Properties |
| 2014 | £795,396 | 10% |
15 Properties |
| 2013 | £718,671 | 40% |
16 Properties |
| 2012 | £434,363 | -69% |
11 Properties |
| 2011 | £732,923 | 23% |
13 Properties |
| 2010 | £566,082 | -11% |
14 Properties |
| 2009 | £628,609 | -13% |
11 Properties |
| 2008 | £713,227 | 33% |
11 Properties |
| 2007 | £480,657 | -24% |
19 Properties |
| 2006 | £595,847 | 20% |
25 Properties |
| 2005 | £479,117 | -2% |
17 Properties |
| 2004 | £487,472 | 5% |
18 Properties |
| 2003 | £460,714 | -16% |
14 Properties |
| 2002 | £535,214 | 28% |
17 Properties |
| 2001 | £387,713 | 3% |
22 Properties |
| 2000 | £375,070 | 10% |
23 Properties |
| 1999 | £337,016 | 1% |
26 Properties |
| 1998 | £332,165 | 39% |
16 Properties |
| 1997 | £202,182 | -35% |
25 Properties |
| 1996 | £273,652 | 25% |
19 Properties |
| 1995 | £204,210 | - |
15 Properties |
Property Price per Property Type in Bisham And Cookham
Here you can find historic sold price data in order to help with your property search.
The average Property Paid Price for specific property types in the last three years are:
| Property Type | Average Sold Price | Sold Properties |
|---|---|---|
| Semi Detached House | £834,000.00 | 4 Semi Detached Houses |
| Terraced House | £708,069.00 | 18 Terraced Houses |
| Flat | £473,366.00 | 3 Flats |
| Detached House | £1,207,900.00 | 5 Detached Houses |