
Houses for sale in Rock, Bewdley
House Prices in Rock
Properties in Rock have an average house price of £1.12M and had 6 Property Transactions within the last 3 years¹.
Rock is an area in Bewdley, Worcestershire with 89 households², where the most expensive property was sold for £2.64M.
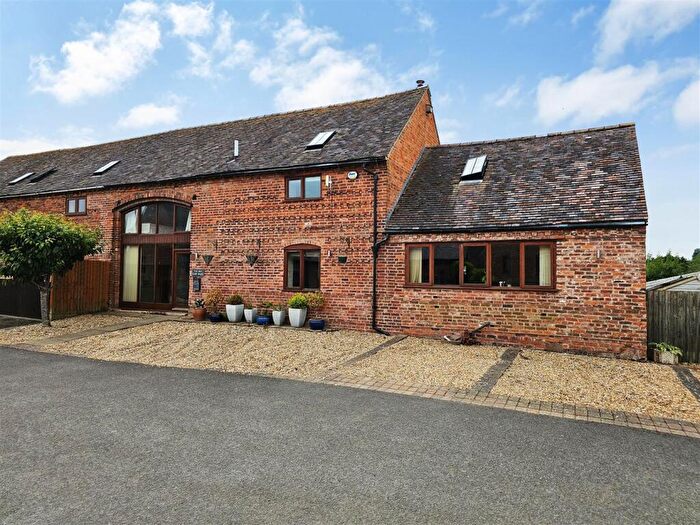
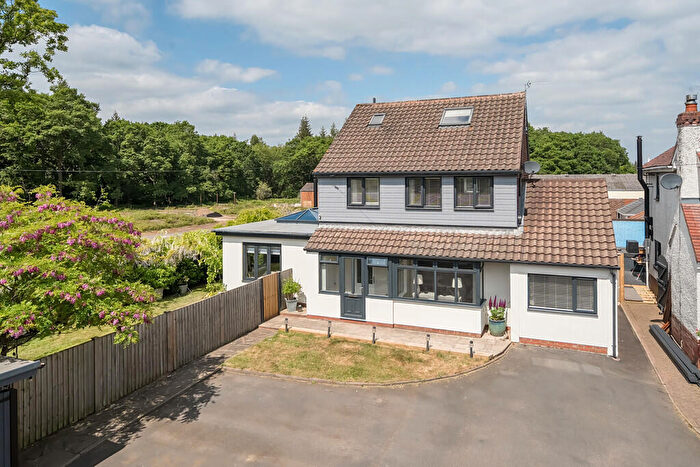
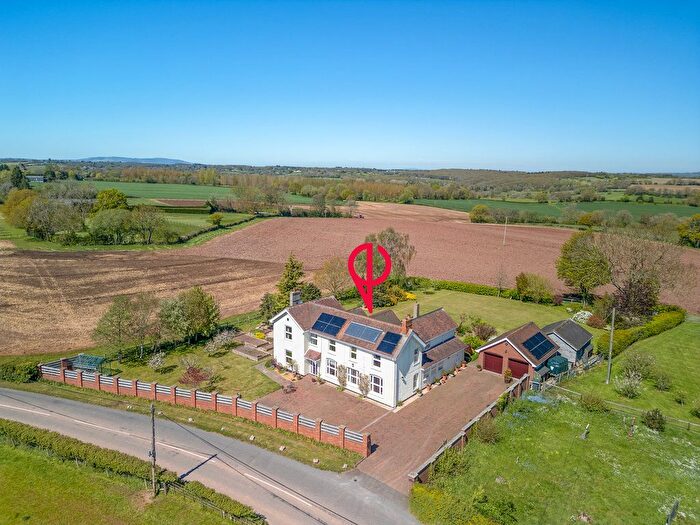
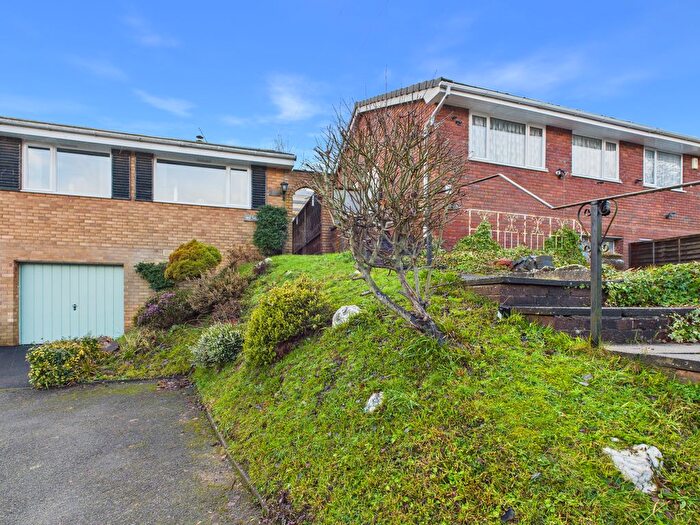
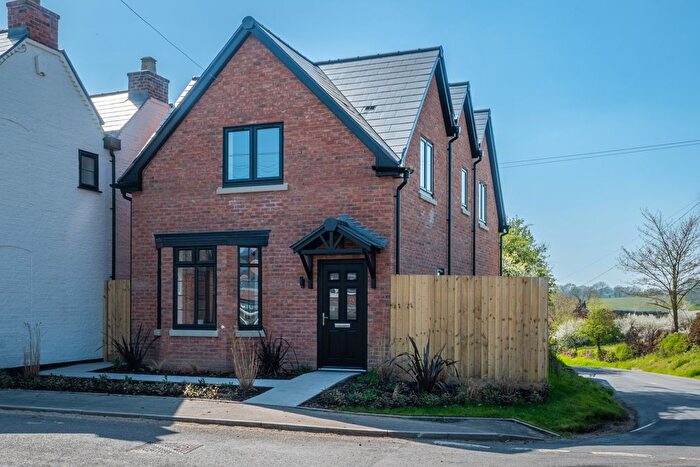
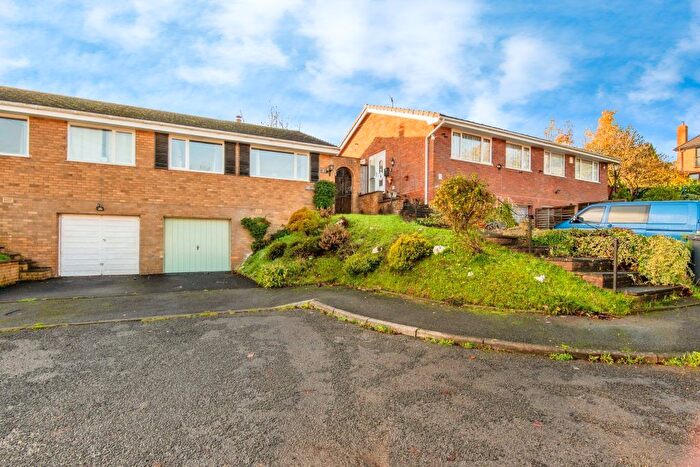
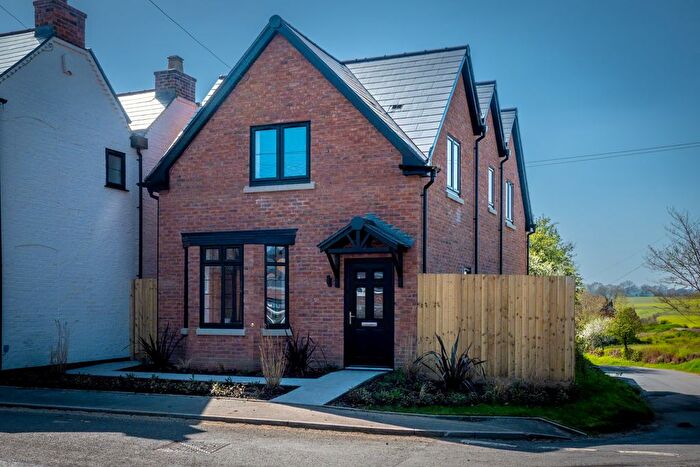
Properties for sale in Rock
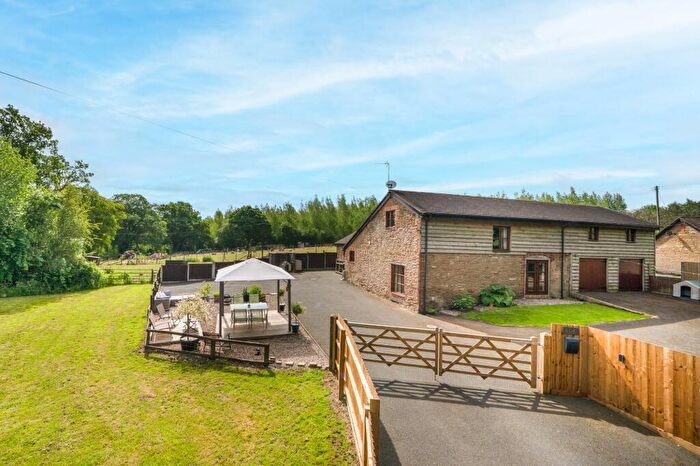
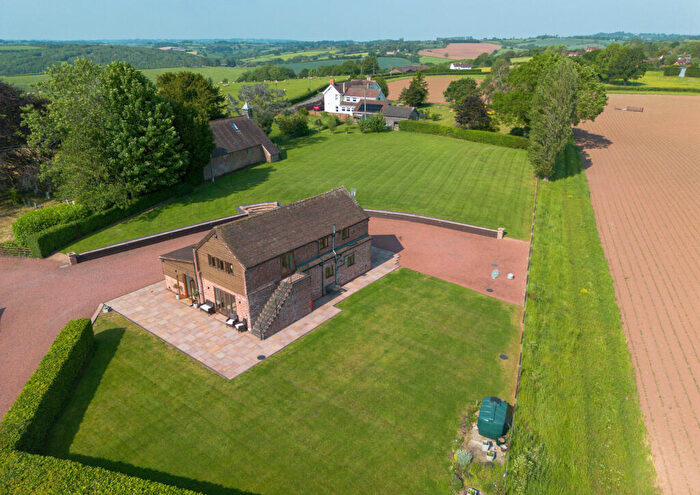
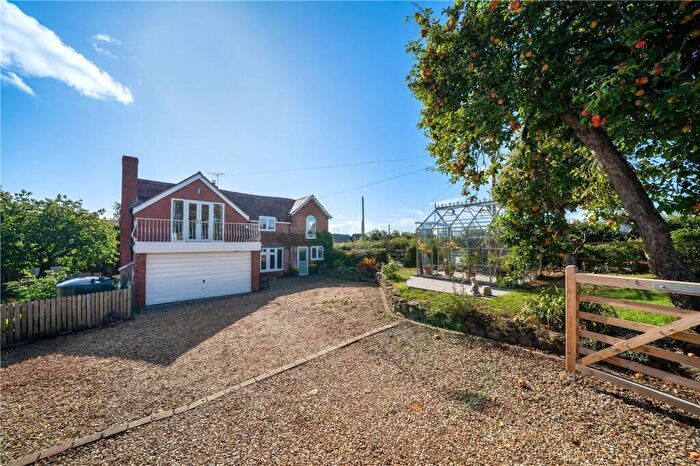
![]()
If you are looking to sell your house, let it out, or receive a property valuation, an expert can help you.
Click the button below to get started.

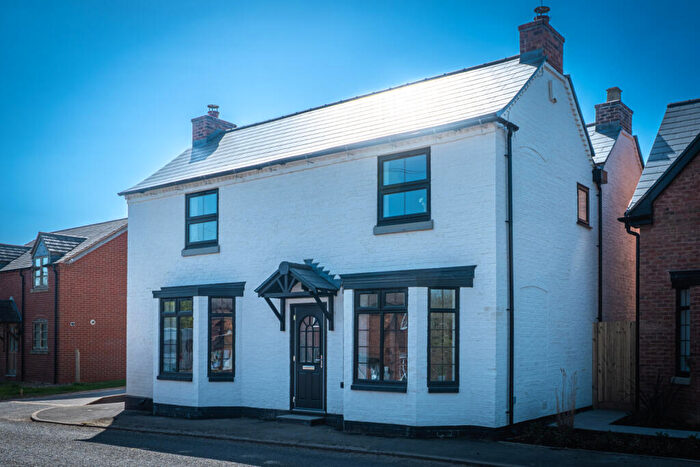
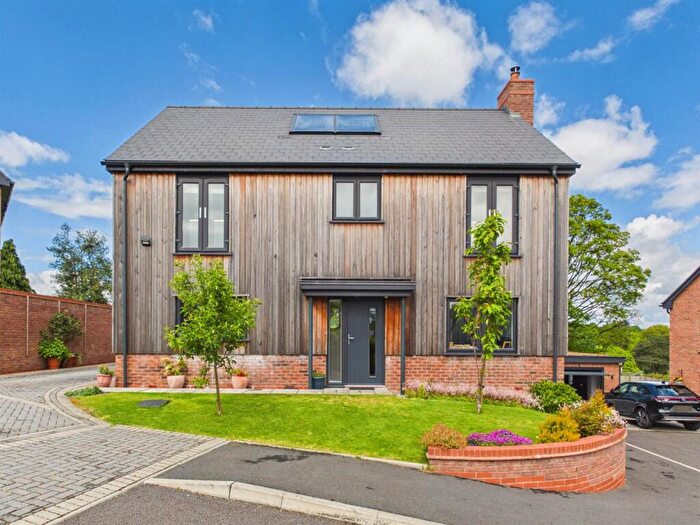
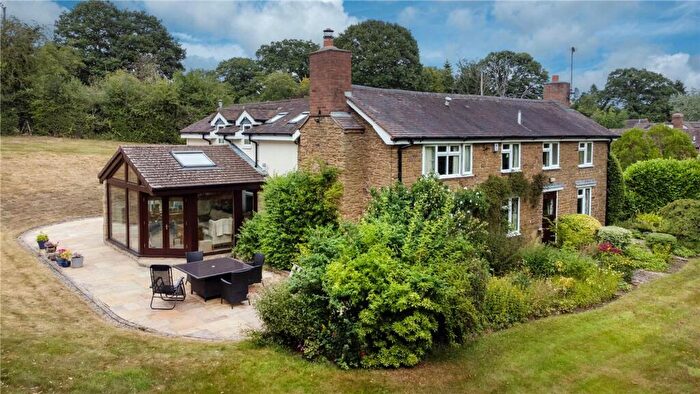
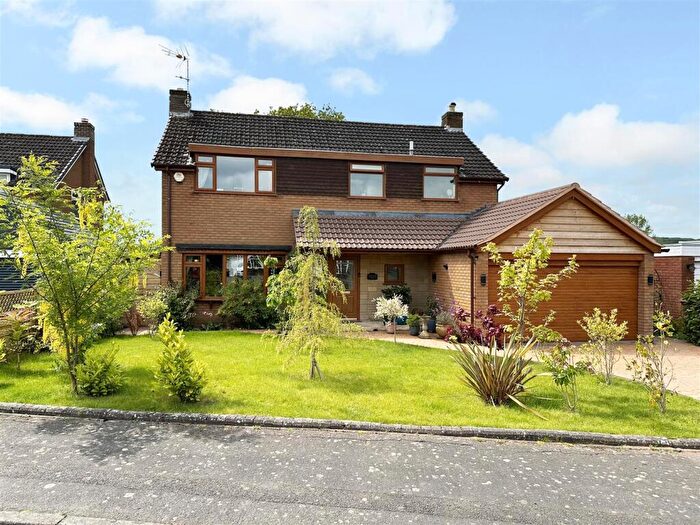
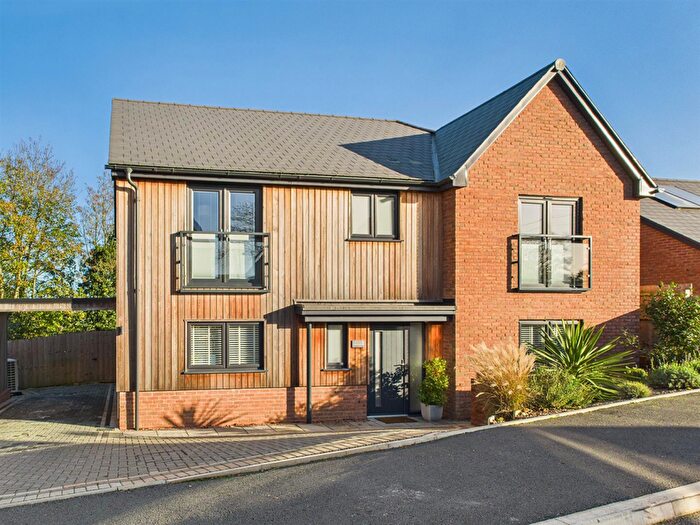
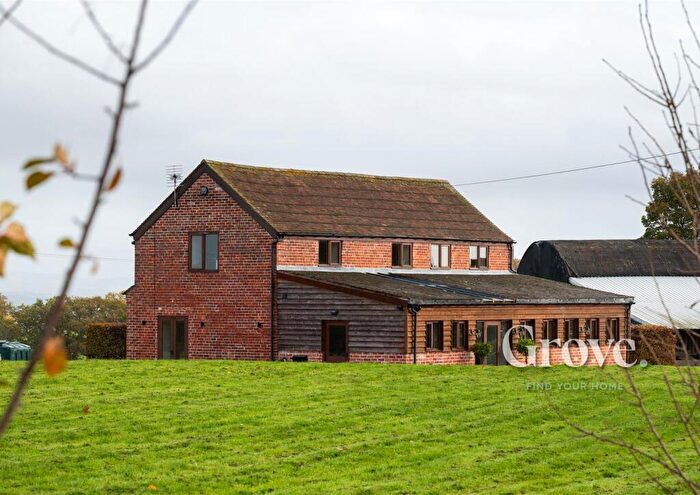
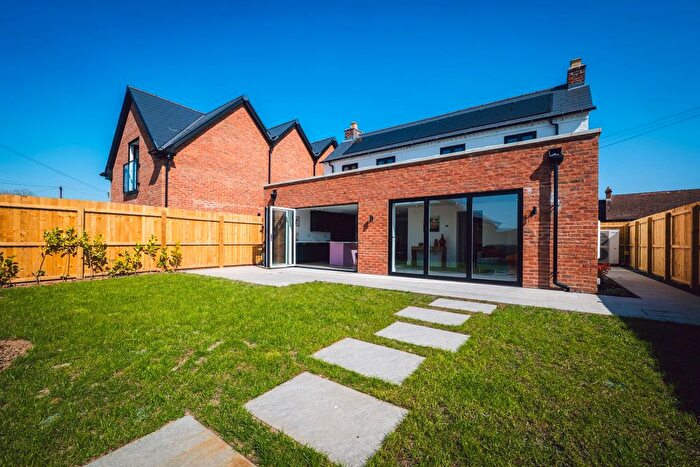
Previously listed properties in Rock

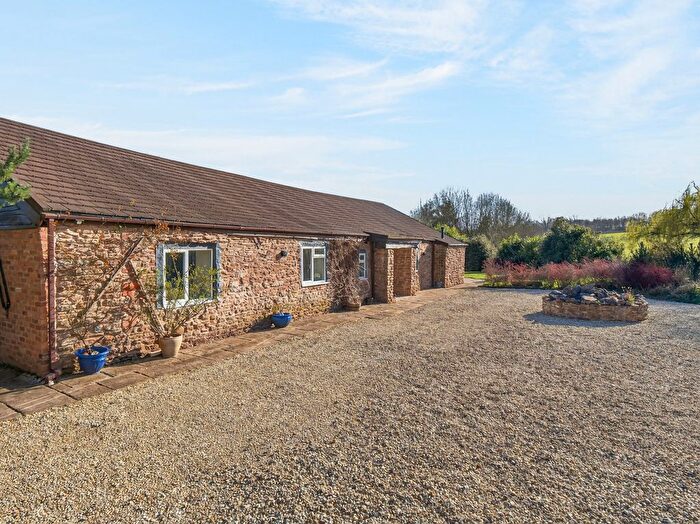
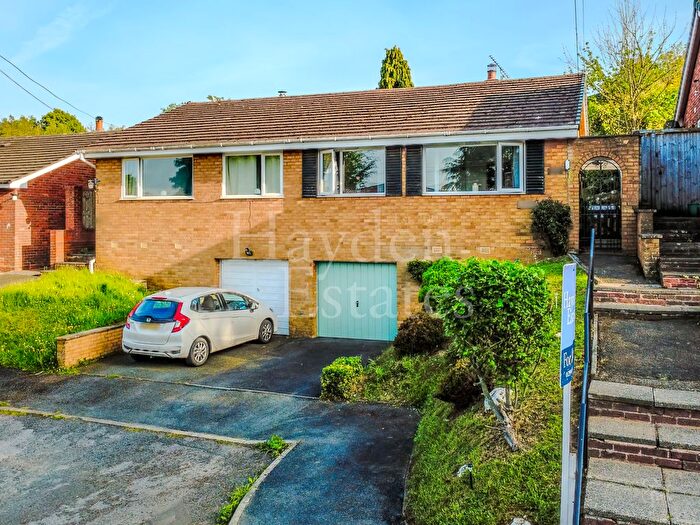

![]()
If you are looking to sell your house, let it out, or receive a property valuation, an expert can help you.
Click the button below to get started.
Roads and Postcodes in Rock
Navigate through our locations to find the location of your next house in Rock, Bewdley for sale or to rent.
| Streets | Postcodes |
|---|---|
| Cross Bank | DY12 2XB DY12 2XE DY12 2XF |
| Deasland Lane | DY12 2XG DY12 2XQ |
| Jennings Wood Lane | DY12 2YG DY12 2YQ |
| Longbank | DY12 2UL DY12 2UN |
| Lye Head | DY12 2UP DY12 2UR DY12 2UT DY12 2UW |
| St Johns Lane | DY12 2QY |
| DY12 2XN DY12 2XP DY12 2XR DY12 2XT DY12 2XU DY12 2XW DY12 2XX DY12 2YB DY12 2YE DY12 2YF DY12 2YP |
Property price trends in Rock
According to the latest Land Registry data, the average home in Rock sold for £825,000 in 2025. That figure comes from 86 sales logged over the past 30 years.
Prices have fallen back over the last three years. Compared with 2022, when the typical sale came in around £1,137,500, that's a fall of roughly 27.5%.
Looking back five years, average prices are up about 214.3% since 2020, a gain of around £562,500 in cash terms.
Zoom out to the past decade for the fuller picture. Back in 2015, homes here averaged £384,250, so the typical sold price has climbed about 114.7% since then, roughly 7.9% a year. Stretch the view to fifteen years and that annual pace eases back to about 5%.
Frequently asked questions about Rock
What is the average price for a property for sale in Rock?
The average price for a property for sale in Rock is £1,115,833. This amount is 242% higher than the average price in Bewdley. There are 99 property listings for sale in Rock.
Which train stations are available in or near Rock?
Some of the train stations available in or near Rock are Kidderminster, Hartlebury and Blakedown.
Property Price Paid in Rock by Year
The average sold property price by year was:
| Year | Average Sold Price | Price Change |
Sold Properties
|
|---|---|---|---|
| 2025 | £825,000 | -53% |
2 Properties |
| 2023 | £1,261,250 | 10% |
4 Properties |
| 2022 | £1,137,500 | 48% |
2 Properties |
| 2021 | £586,666 | 55% |
3 Properties |
| 2020 | £262,500 | -194% |
1 Property |
| 2019 | £772,423 | 42% |
3 Properties |
| 2018 | £445,000 | -14% |
2 Properties |
| 2017 | £507,500 | -7% |
4 Properties |
| 2016 | £542,500 | 29% |
2 Properties |
| 2015 | £384,250 | -5% |
4 Properties |
Property Price per Property Type in Rock
Here you can find historic sold price data in order to help with your property search.
The average Property Paid Price for specific property types in the last three years are:
| Property Type | Average Sold Price | Sold Properties |
|---|---|---|
| Detached House | £1,115,833.00 | 6 Detached Houses |
