Houses for sale & to rent in Hillside, Birmingham
House Prices in Hillside
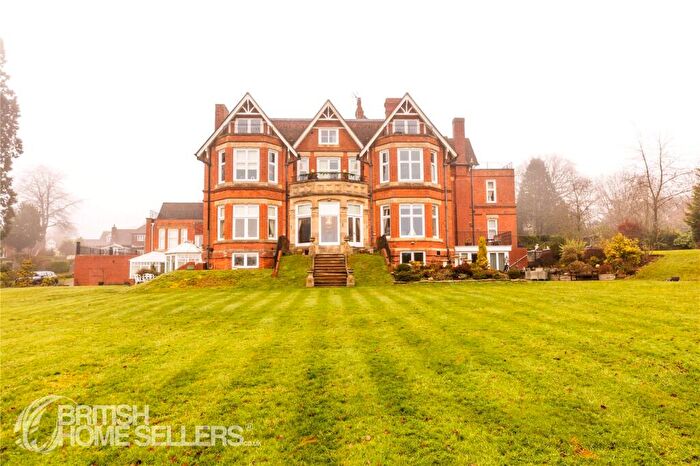
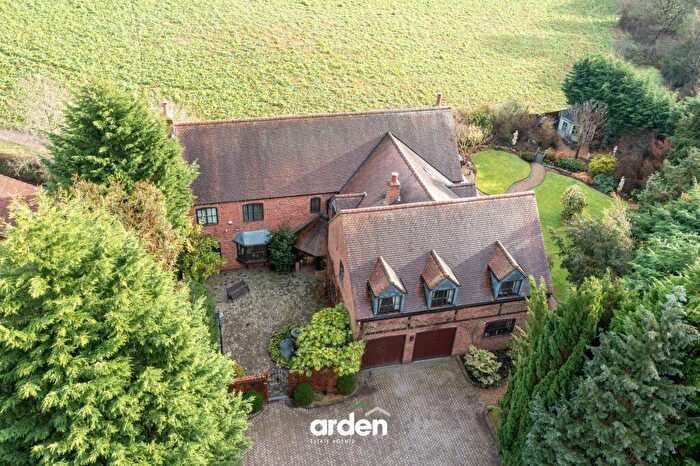
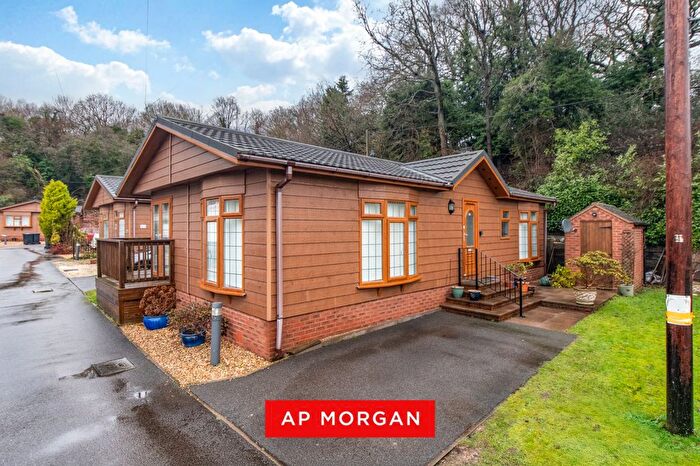
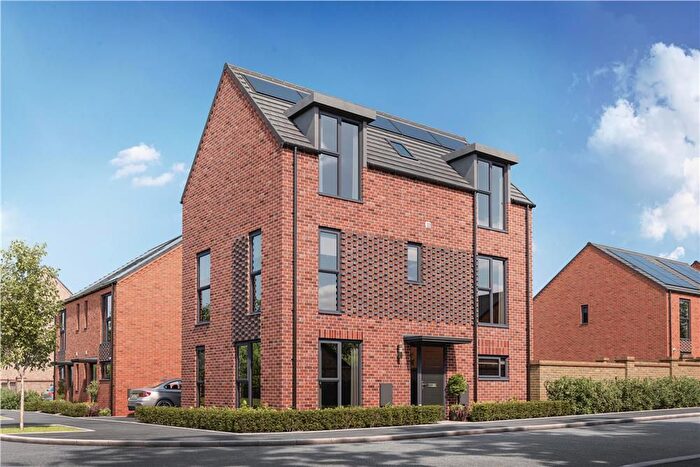
Properties in Hillside have an average house price of £576,399.00 and had 214 Property Transactions within the last 3 years¹.
Hillside is an area in Birmingham, Worcestershire with 1,873 households², where the most expensive property was sold for £2,500,000.00.
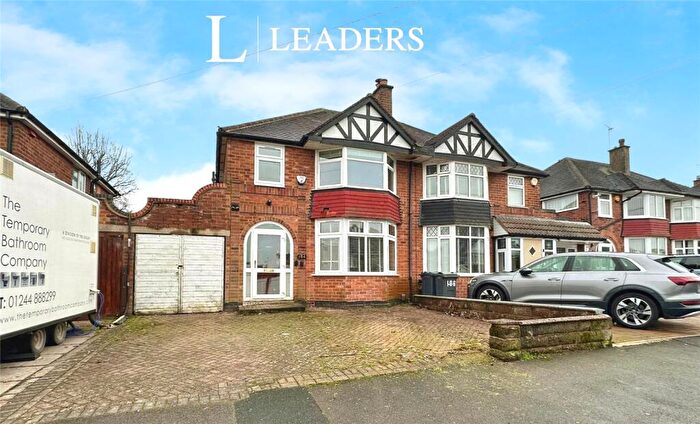
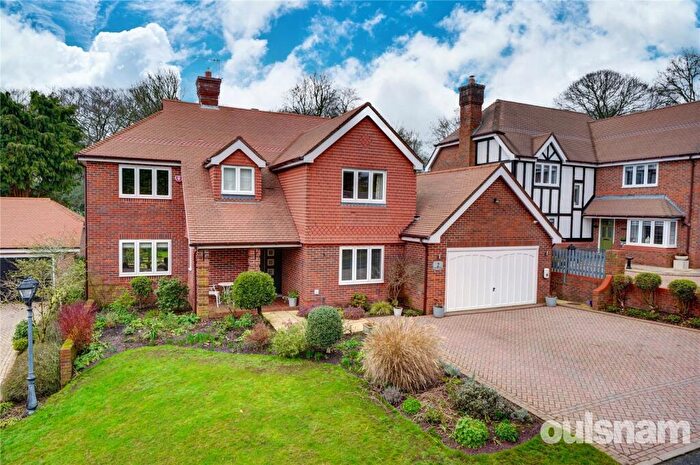
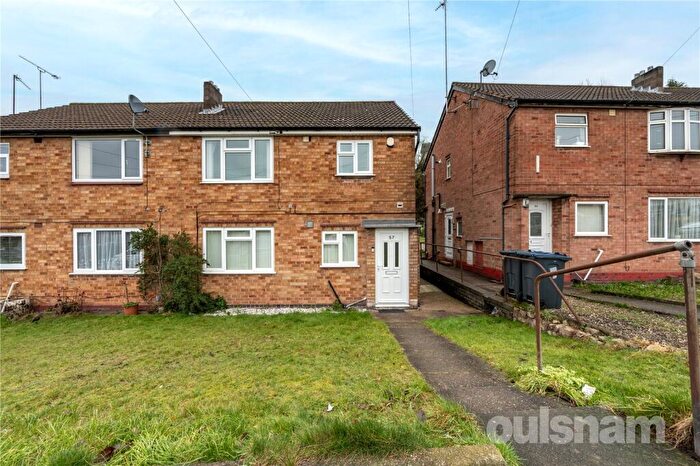
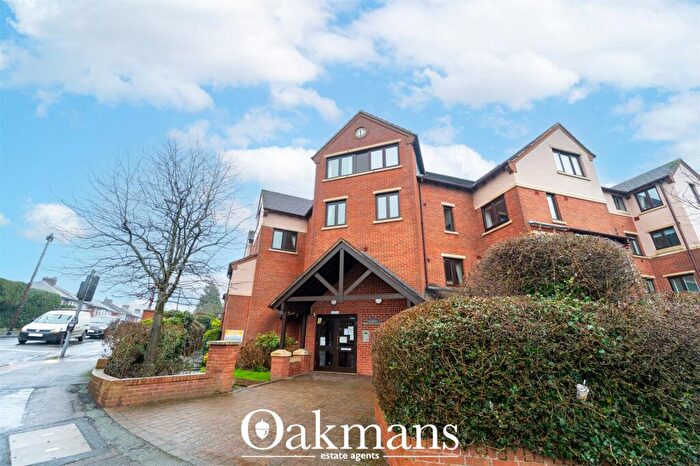
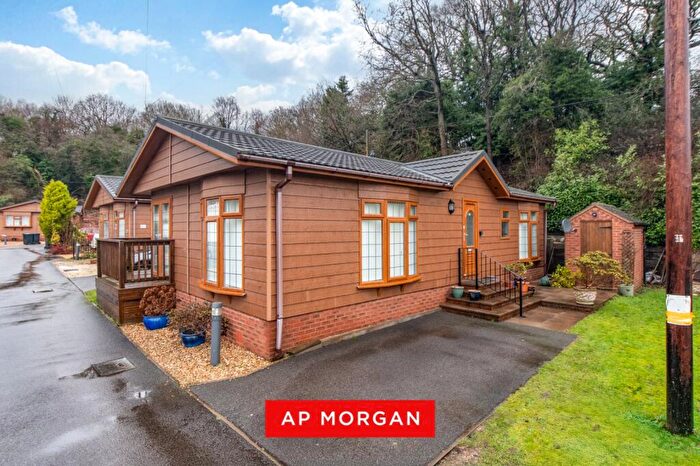
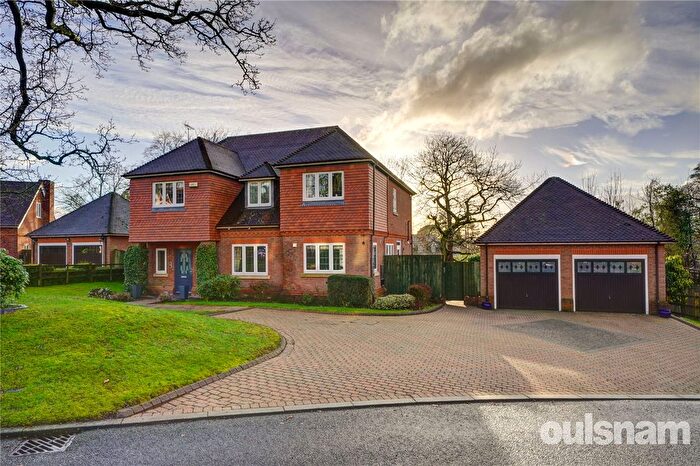
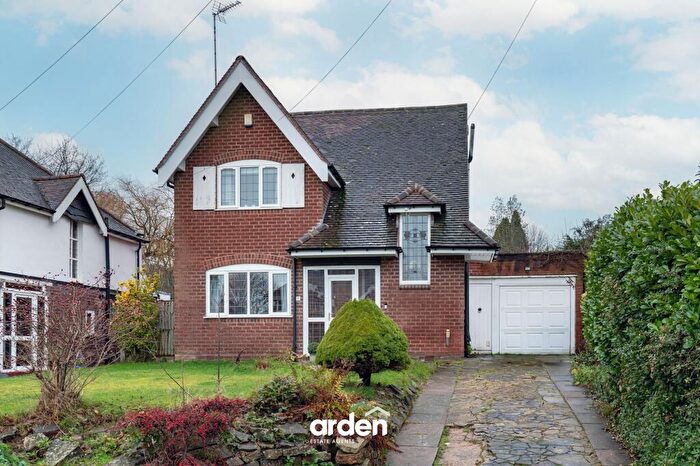
Properties for sale in Hillside
Roads and Postcodes in Hillside
Navigate through our locations to find the location of your next house in Hillside, Birmingham for sale or to rent.
| Streets | Postcodes |
|---|---|
| Aqueduct Lane | B48 7BP B48 7BS |
| Ashmead Drive | B45 8AA B45 8AB |
| Ashmead Rise | B45 8AD B45 8AE |
| Barnt Green Road | B45 8NB B45 8ND B45 8PH B45 8PP B45 8PR |
| Beech Park Drive | B45 8LZ |
| Bittell Lane | B45 8NS |
| Bittell Road | B45 8LP B45 8LT B45 8LU B45 8LX B45 8LY |
| Blackwell Road | B45 8BT B45 8BU |
| Brookwood Drive | B45 8GG |
| Cherry Grove | B45 8LW |
| Cherry Hill Avenue | B45 8LA |
| Cherry Hill Drive | B45 8JY |
| Cherry Hill Road | B45 8LH B45 8LJ B45 8LL B45 8LN |
| Chestnut Drive | B45 8AQ |
| Clayton Gardens | B45 8EQ |
| Cleveland Drive | B45 8XH |
| Coach Cottages | B45 8QB |
| Cofton Church Lane | B45 8BB B45 8BH B45 8PS B45 8PT |
| Cofton Lake Road | B45 8PL |
| Eachway Lane | B45 9XZ |
| East Works Drive | B45 8GS |
| Edgewood Drive | B45 8GD |
| Fairey Street | B45 8GU B45 8GW |
| Fairlight Drive | B45 8TB |
| Fiery Hill Drive | B45 8SZ |
| Fiery Hill Road | B45 8JX B45 8JZ B45 8LB B45 8LD B45 8LE B45 8LF B45 8LG |
| Greenbank | B45 8DH |
| Greenhurst Drive | B45 8GH |
| Groveley Lane | B45 8UA B45 8UB B45 8UD B45 8UG B45 8UQ |
| Hewell Lane | B45 8NZ |
| Hewell Place | B45 8PF |
| Hewell Road | B45 8NF B45 8NG B45 8NL B45 8NW |
| High House Drive | B45 8ET |
| Hurricane Avenue | B45 8GX |
| Kendal Drive | B45 8QA |
| Kendal End Road | B45 8PU B45 8PX B45 8PY |
| Laurel Gardens | B45 8RP |
| Lickey Coppice | B45 8PG B45 8PQ |
| Lickey Road | B45 8UU |
| Lickey Square | B45 8HA B45 8HB |
| Malvern Road | B45 8EX |
| Margesson Drive | B45 8LR |
| Mearse Lane | B45 8HJ |
| Middle Drive | B45 8AJ B45 8AL |
| Monument Lane | B45 9QJ B45 9QQ B45 9XH |
| Oakdene Drive | B45 8LQ |
| Oakfield Drive | B45 8AH B45 8AN |
| Old Birmingham Road | B45 8ES B45 8EU B45 8EY |
| Orchard Croft | B45 8NH B45 8NJ |
| Parsonage Drive | B45 8AR B45 8AS |
| Penzer Drive | B45 8LS |
| Pine Grove | B45 8HE |
| Pinfield Drive | B45 8XA |
| Poplar Drive | B45 8NQ |
| Private Way | B45 8UF |
| Reservoir Road | B45 8PJ B45 8PN |
| Rose Hill | B45 8RR B45 8RT |
| Rose Terrace | B45 8NE |
| Sandhills Green | B45 8NT B48 7BT |
| Sandhills Lane | B45 8NU B45 8NX |
| Sandhills Road | B45 8NP B45 8NR |
| Shadow Close | B45 8GQ |
| Station Approach | B45 8PA |
| Stretton Drive | B45 8XJ |
| Ten Ashes Lane | B45 8PE |
| The Badgers | B45 8QR |
| The Grove | B45 8AP |
| The Longlands | B45 8NY |
| Twatling Road | B45 8HS B45 8HT B45 8HU B45 8JH |
| Victoria Mews | B45 8NA |
| Warren Lane | B45 8ER |
| Willow Tree Drive | B45 8PB |
| Woodland Drive | B45 8FX |
| Woodshill Avenue | B45 8HD |
Transport near Hillside
- FAQ
- Price Paid By Year
- Property Type Price
Frequently asked questions about Hillside
What is the average price for a property for sale in Hillside?
The average price for a property for sale in Hillside is £576,399. This amount is 36% higher than the average price in Birmingham. There are 2,155 property listings for sale in Hillside.
What streets have the most expensive properties for sale in Hillside?
The streets with the most expensive properties for sale in Hillside are Brookwood Drive at an average of £1,689,999, Cherry Hill Road at an average of £1,625,000 and Woodland Drive at an average of £1,300,000.
What streets have the most affordable properties for sale in Hillside?
The streets with the most affordable properties for sale in Hillside are Hewell Place at an average of £127,500, Station Approach at an average of £143,625 and The Longlands at an average of £181,375.
Which train stations are available in or near Hillside?
Some of the train stations available in or near Hillside are Barnt Green, Longbridge and Alvechurch.
Property Price Paid in Hillside by Year
The average sold property price by year was:
| Year | Average Sold Price | Price Change |
Sold Properties
|
|---|---|---|---|
| 2025 | £574,879 | -5% |
65 Properties |
| 2024 | £605,347 | 9% |
69 Properties |
| 2023 | £552,668 | 2% |
80 Properties |
| 2022 | £543,810 | 10% |
96 Properties |
| 2021 | £487,616 | -0,3% |
99 Properties |
| 2020 | £489,244 | 6% |
90 Properties |
| 2019 | £461,263 | -1% |
88 Properties |
| 2018 | £463,685 | 2% |
94 Properties |
| 2017 | £454,250 | 4% |
101 Properties |
| 2016 | £434,909 | 13% |
100 Properties |
| 2015 | £377,561 | 13% |
141 Properties |
| 2014 | £326,758 | 1% |
176 Properties |
| 2013 | £323,667 | -9% |
118 Properties |
| 2012 | £351,604 | -3% |
62 Properties |
| 2011 | £363,643 | 11% |
59 Properties |
| 2010 | £323,466 | -7% |
49 Properties |
| 2009 | £345,224 | -13% |
69 Properties |
| 2008 | £390,253 | 5% |
45 Properties |
| 2007 | £369,336 | 2% |
94 Properties |
| 2006 | £362,195 | 7% |
115 Properties |
| 2005 | £336,025 | 10% |
68 Properties |
| 2004 | £300,953 | 10% |
95 Properties |
| 2003 | £272,184 | 10% |
77 Properties |
| 2002 | £246,302 | 26% |
105 Properties |
| 2001 | £181,882 | -30% |
115 Properties |
| 2000 | £236,377 | 20% |
105 Properties |
| 1999 | £188,906 | 17% |
135 Properties |
| 1998 | £156,972 | 10% |
94 Properties |
| 1997 | £141,821 | 3% |
127 Properties |
| 1996 | £136,892 | 6% |
87 Properties |
| 1995 | £129,132 | - |
81 Properties |
Property Price per Property Type in Hillside
Here you can find historic sold price data in order to help with your property search.
The average Property Paid Price for specific property types in the last three years are:
| Property Type | Average Sold Price | Sold Properties |
|---|---|---|
| Semi Detached House | £447,322.00 | 65 Semi Detached Houses |
| Detached House | £735,280.00 | 114 Detached Houses |
| Terraced House | £319,929.00 | 29 Terraced Houses |
| Flat | £195,625.00 | 6 Flats |

