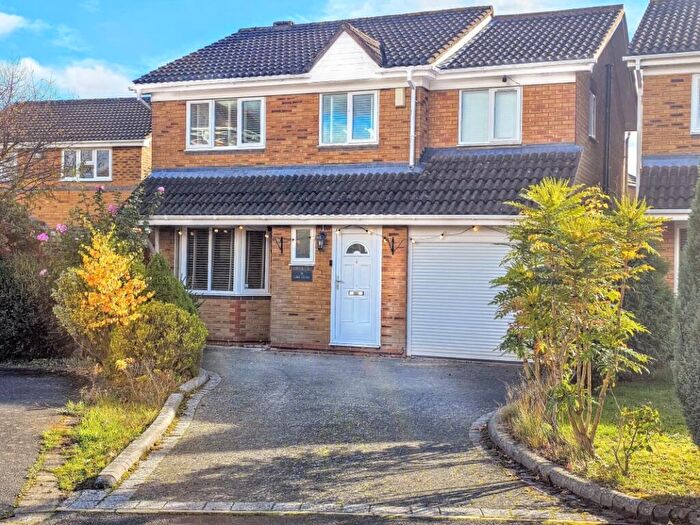
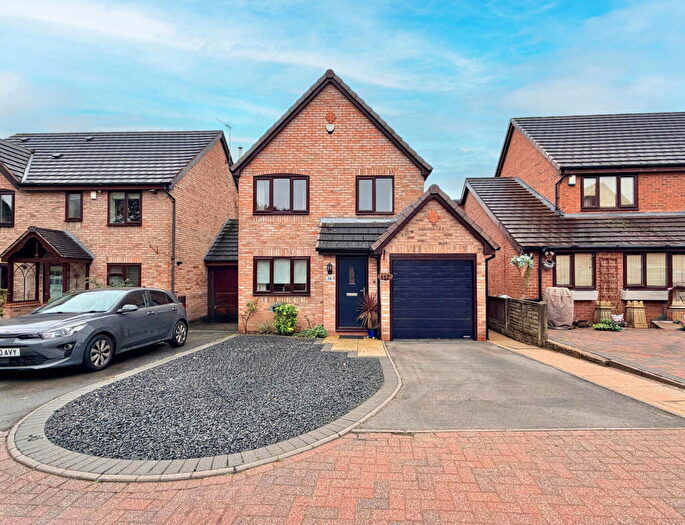
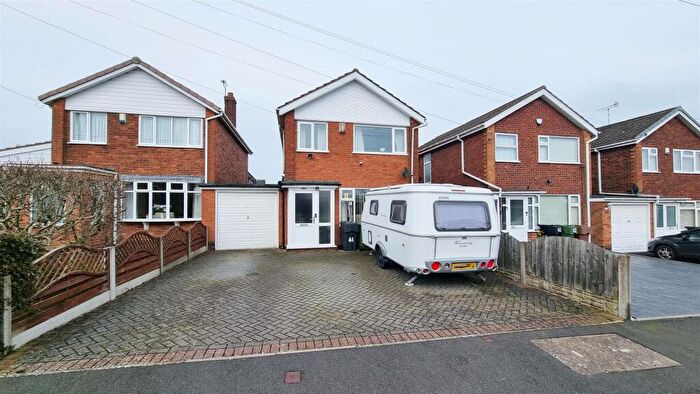
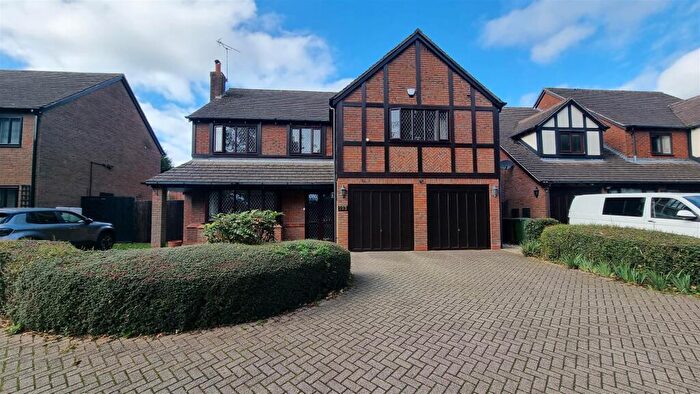
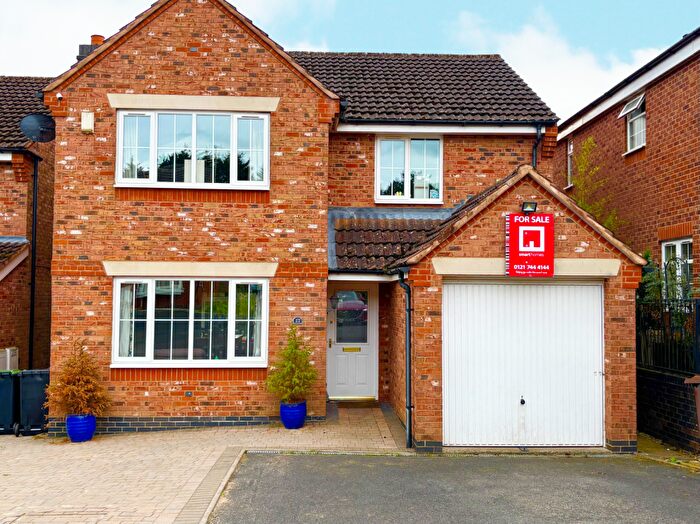
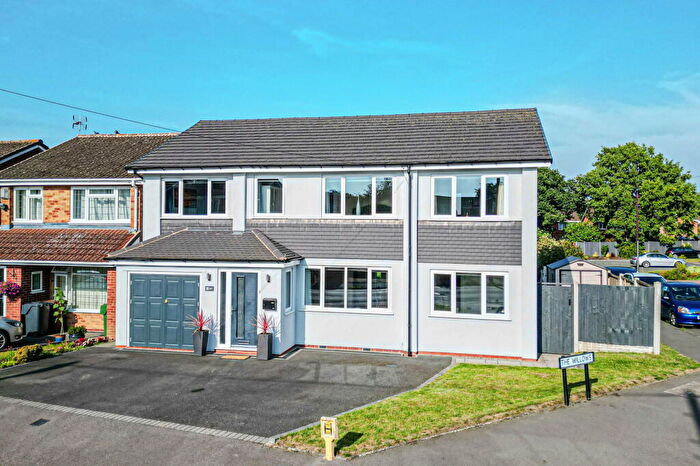
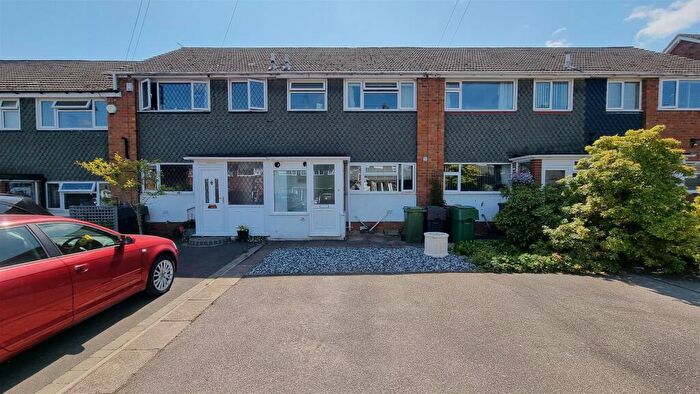
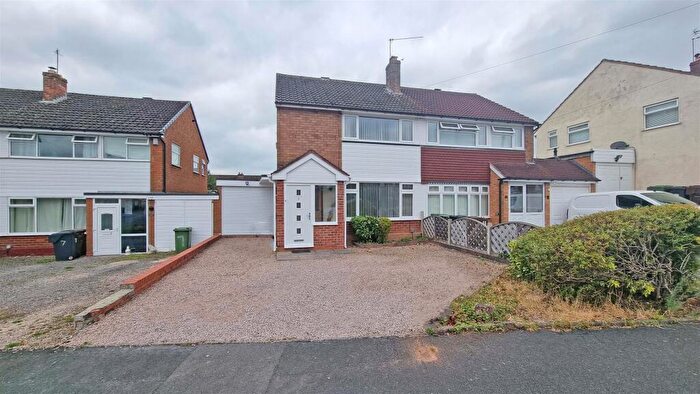
Houses for sale & to rent in Hollywood And Majors Green, Birmingham
House Prices in Hollywood And Majors Green
Properties in Hollywood And Majors Green have an average house price of £384,078.00 and had 188 Property Transactions within the last 3 years¹.
Hollywood And Majors Green is an area in Birmingham, Worcestershire with 1,450 households², where the most expensive property was sold for £660,000.00.
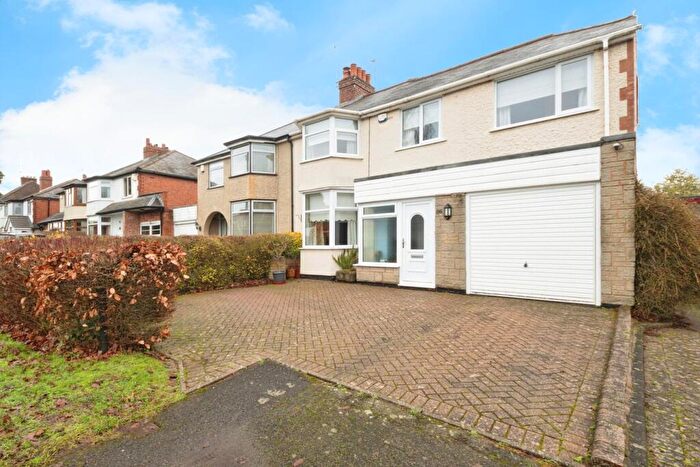
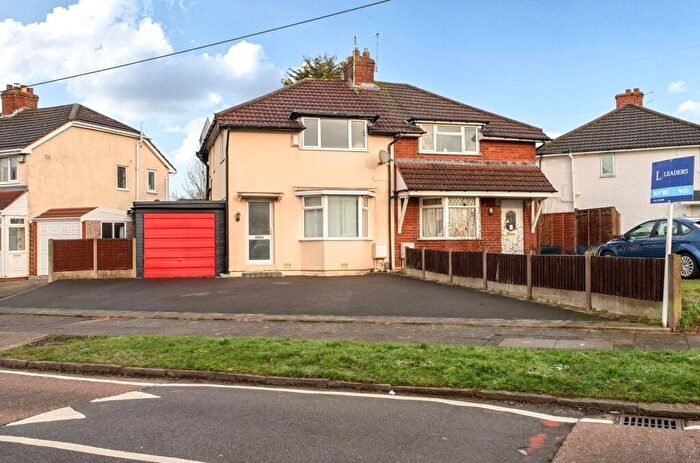
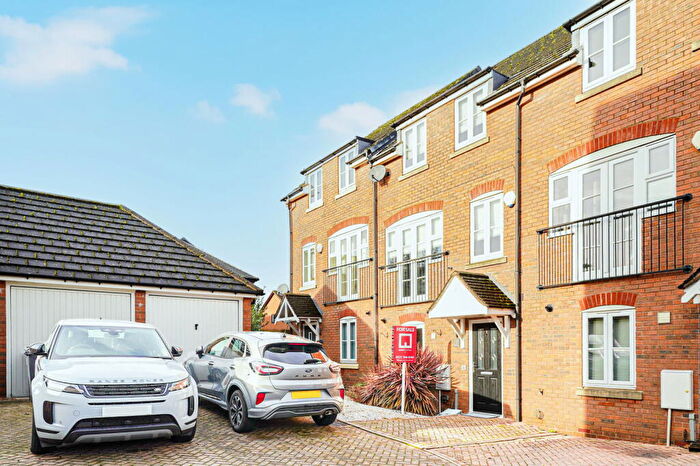
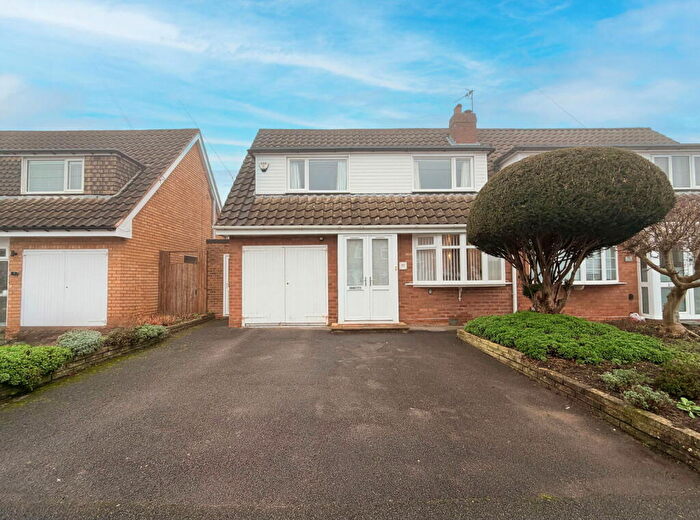
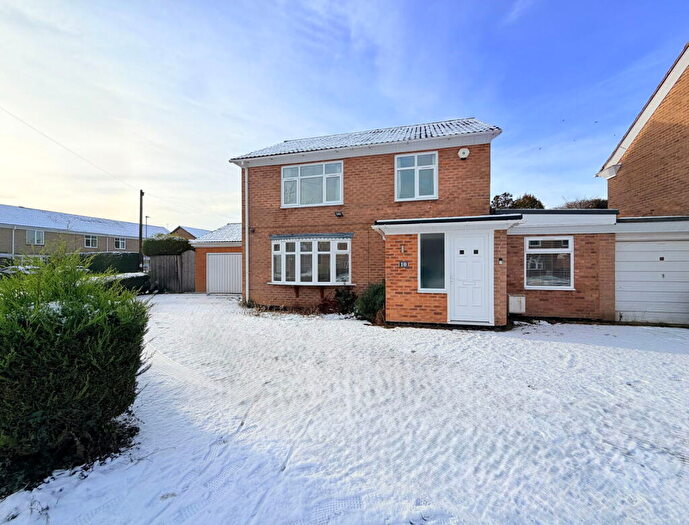
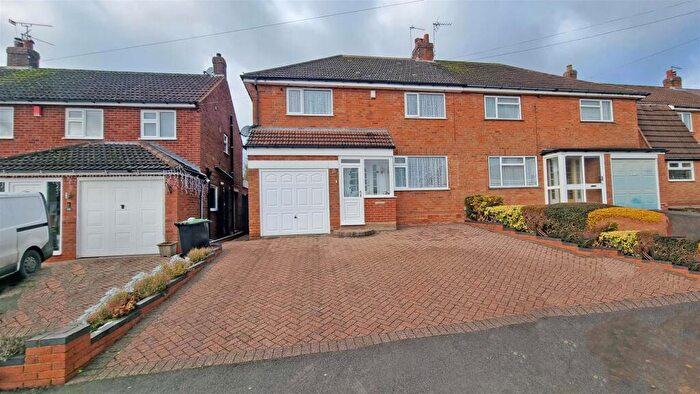
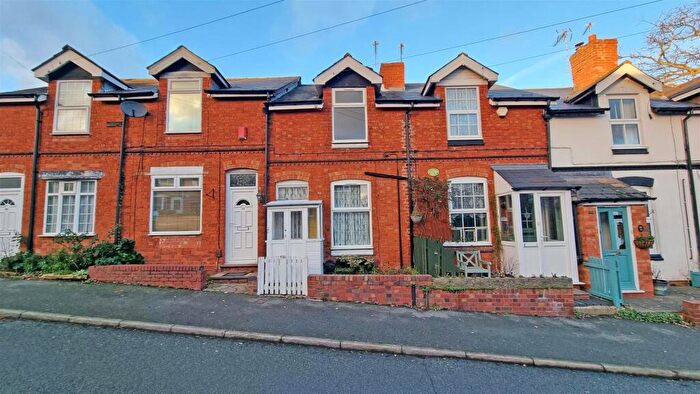
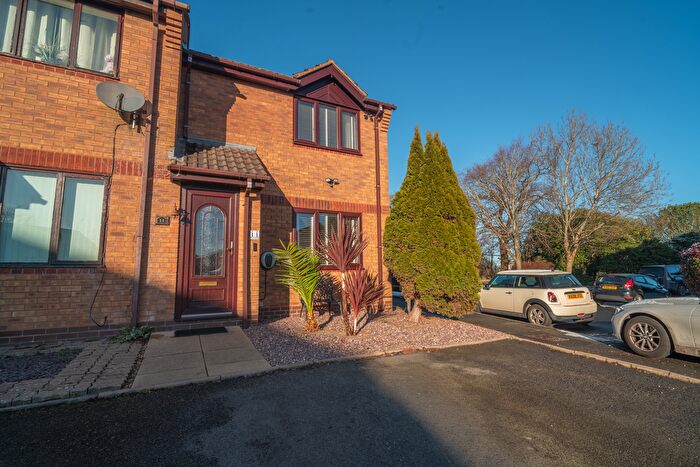
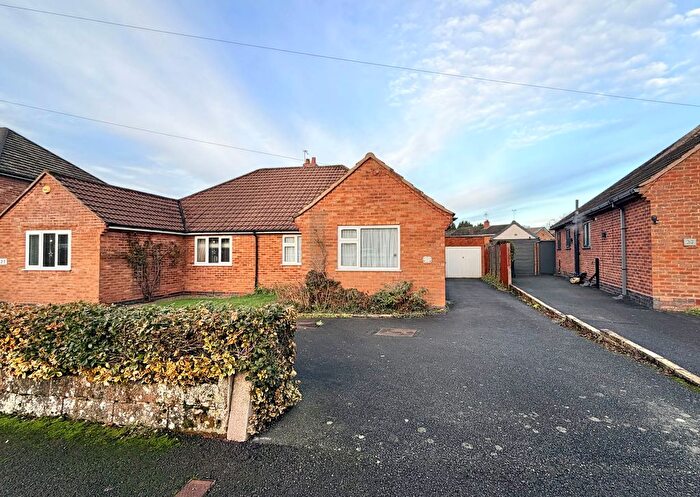
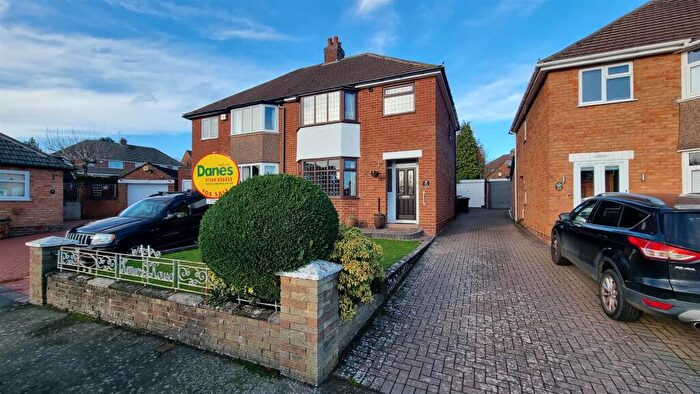
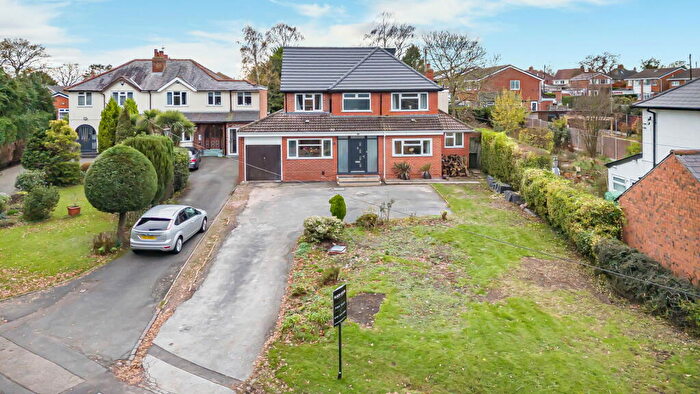
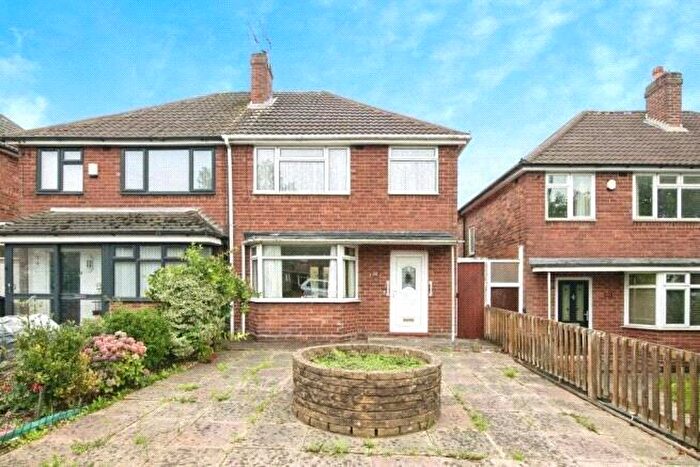
Properties for sale in Hollywood And Majors Green
Roads and Postcodes in Hollywood And Majors Green
Navigate through our locations to find the location of your next house in Hollywood And Majors Green, Birmingham for sale or to rent.
| Streets | Postcodes |
|---|---|
| Alcester Road | B47 5NB B47 5NE B47 5NP B47 5NR B47 5NS B47 5PN |
| Alfreda Avenue | B47 5BP |
| Alveston Road | B47 5LD |
| Berrymound View | B47 5QF |
| Chantry Close | B47 5LU |
| Coppice Gardens | B47 5JJ |
| Corbett Road | B47 5LL B47 5LP B47 5LT |
| Cropthorne Drive | B47 5PZ |
| Dark Lane | B47 5BN B47 5BS B47 5BT B47 5BX |
| Douglas Road | B47 5JY B47 5JZ B47 5LB |
| Dyas Road | B47 5LE B47 5LJ |
| Easton Grove | B47 5LN |
| Fenton Road | B47 5LS |
| Fieldways Close | B47 5NU |
| Forest Way | B47 5JS |
| Heath Road | B47 5LR |
| Holly Drive | B47 5JT |
| Hollywood Drive | B47 5PS |
| Hollywood Gardens | B47 5NN |
| Hollywood Lane | B47 5PP B47 5PT B47 5PX B47 5PY B47 5QJ |
| Houndsfield Close | B47 5QP |
| Houndsfield Lane | B47 5QR |
| Kenway | B47 5LG |
| Lee Road | B47 5NY |
| Lint Meadow | B47 5PH |
| Lynbrook Close | B47 5PU |
| May Lane | B47 5NX B47 5PA |
| Mayhurst Close | B47 5QH |
| Mayhurst Road | B47 5QG |
| Mill Close | B47 5LA |
| New Road | B47 5ND |
| Orchard Way | B47 5NH |
| Richmond Close | B47 5QD |
| Shawhurst Croft | B47 5PB |
| Shawhurst Gardens | B47 5JQ |
| Shawhurst Lane | B47 5JN B47 5JR |
| Simon Road | B47 5LH |
| The Orchards | B47 5NZ |
| Truemans Heath Lane | B47 5QB B47 5QE |
| Windrush Road | B47 5QA |
| Woodleaves | B47 5BW |
| Wythwood Grove | B47 5QN |
| Wythwood Road | B47 5QL |
Transport near Hollywood And Majors Green
-
Wythall Station
-
Whitlock's End Station
-
Shirley Station
-
Earlswood (West Midlands) Station
-
Yardley Wood Station
-
King's Norton Station
-
The Lakes Station
- FAQ
- Price Paid By Year
- Property Type Price
Frequently asked questions about Hollywood And Majors Green
What is the average price for a property for sale in Hollywood And Majors Green?
The average price for a property for sale in Hollywood And Majors Green is £384,078. This amount is 10% lower than the average price in Birmingham. There are 449 property listings for sale in Hollywood And Majors Green.
What streets have the most expensive properties for sale in Hollywood And Majors Green?
The streets with the most expensive properties for sale in Hollywood And Majors Green are Shawhurst Gardens at an average of £512,500, The Orchards at an average of £492,500 and Alcester Road at an average of £452,535.
What streets have the most affordable properties for sale in Hollywood And Majors Green?
The streets with the most affordable properties for sale in Hollywood And Majors Green are Forest Way at an average of £266,625, Windrush Road at an average of £289,031 and Wythwood Road at an average of £299,375.
Which train stations are available in or near Hollywood And Majors Green?
Some of the train stations available in or near Hollywood And Majors Green are Wythall, Whitlock's End and Shirley.
Property Price Paid in Hollywood And Majors Green by Year
The average sold property price by year was:
| Year | Average Sold Price | Price Change |
Sold Properties
|
|---|---|---|---|
| 2025 | £419,698 | 8% |
29 Properties |
| 2024 | £385,959 | 2% |
51 Properties |
| 2023 | £378,657 | 3% |
55 Properties |
| 2022 | £368,403 | 2% |
53 Properties |
| 2021 | £360,185 | 14% |
74 Properties |
| 2020 | £311,552 | -2% |
48 Properties |
| 2019 | £318,117 | 1% |
54 Properties |
| 2018 | £314,937 | 8% |
45 Properties |
| 2017 | £290,261 | -3% |
63 Properties |
| 2016 | £299,320 | 13% |
49 Properties |
| 2015 | £261,873 | 5% |
65 Properties |
| 2014 | £249,697 | 10% |
63 Properties |
| 2013 | £225,583 | 2% |
51 Properties |
| 2012 | £221,996 | -5% |
39 Properties |
| 2011 | £232,388 | -0,3% |
39 Properties |
| 2010 | £233,110 | 9% |
39 Properties |
| 2009 | £212,460 | -13% |
48 Properties |
| 2008 | £240,435 | 7% |
27 Properties |
| 2007 | £224,775 | 1% |
66 Properties |
| 2006 | £223,124 | -7% |
73 Properties |
| 2005 | £239,505 | 2% |
66 Properties |
| 2004 | £234,703 | 21% |
83 Properties |
| 2003 | £185,966 | 12% |
68 Properties |
| 2002 | £163,447 | 20% |
77 Properties |
| 2001 | £130,075 | 7% |
69 Properties |
| 2000 | £120,602 | 10% |
46 Properties |
| 1999 | £108,822 | 7% |
43 Properties |
| 1998 | £101,612 | 6% |
67 Properties |
| 1997 | £95,356 | 14% |
65 Properties |
| 1996 | £81,890 | 5% |
46 Properties |
| 1995 | £78,193 | - |
37 Properties |
Property Price per Property Type in Hollywood And Majors Green
Here you can find historic sold price data in order to help with your property search.
The average Property Paid Price for specific property types in the last three years are:
| Property Type | Average Sold Price | Sold Properties |
|---|---|---|
| Semi Detached House | £370,755.00 | 88 Semi Detached Houses |
| Detached House | £431,283.00 | 66 Detached Houses |
| Terraced House | £332,291.00 | 33 Terraced Houses |
| Flat | £150,000.00 | 1 Flat |

