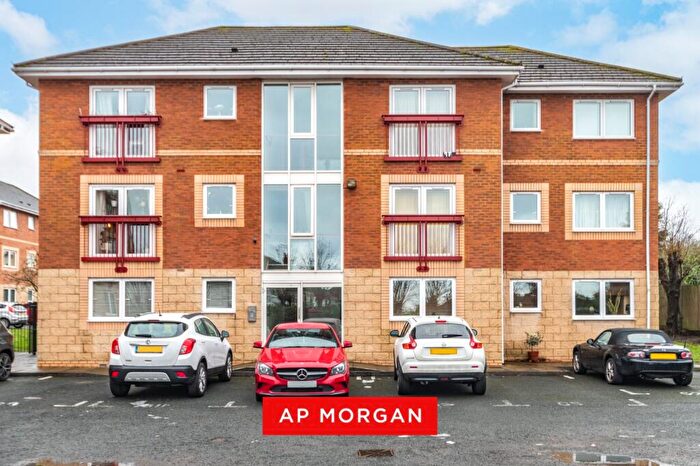
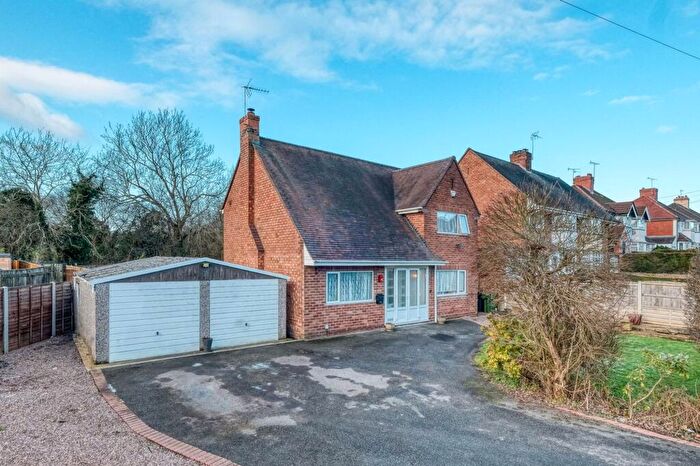
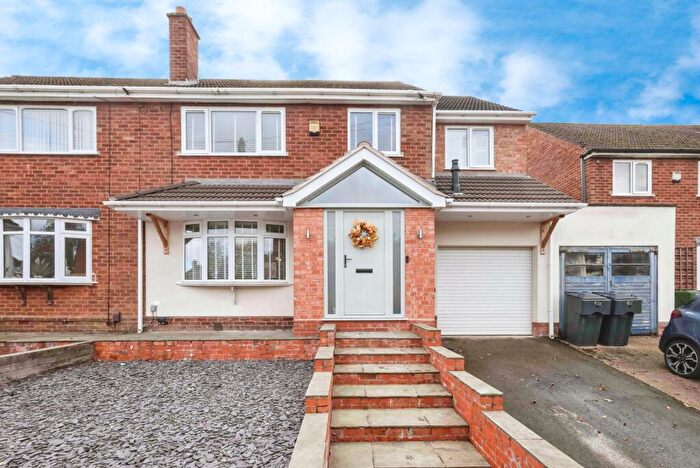
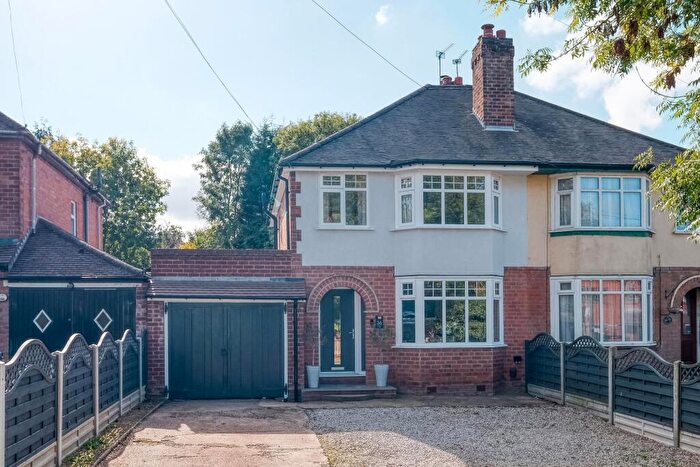
Houses for sale & to rent in Waseley, Birmingham
House Prices in Waseley
Properties in Waseley have an average house price of £251,241.00 and had 176 Property Transactions within the last 3 years¹.
Waseley is an area in Birmingham, Worcestershire with 1,752 households², where the most expensive property was sold for £485,000.00.
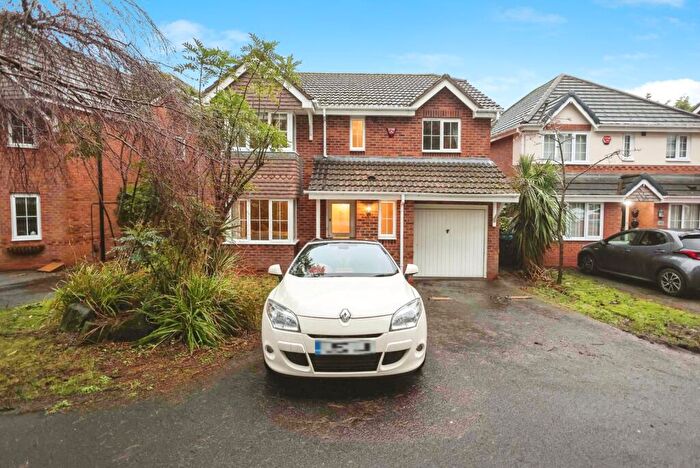
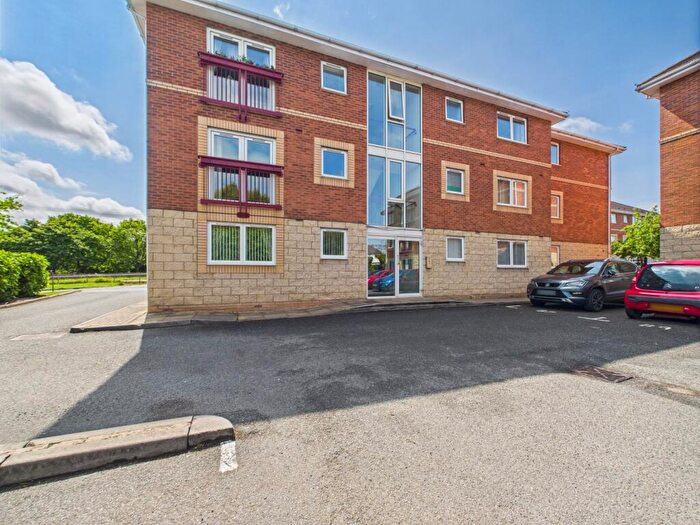
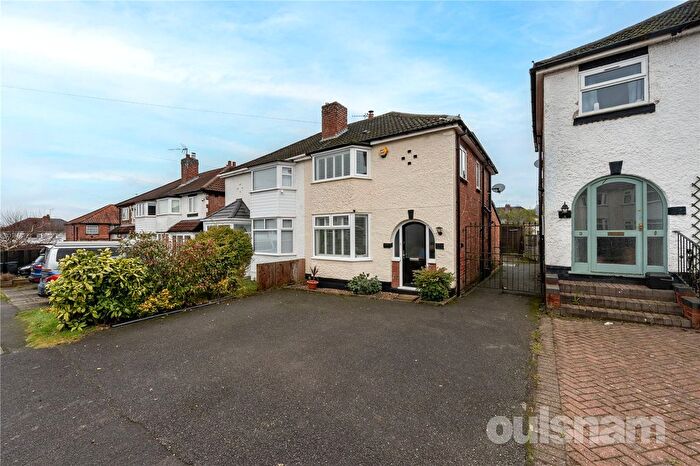
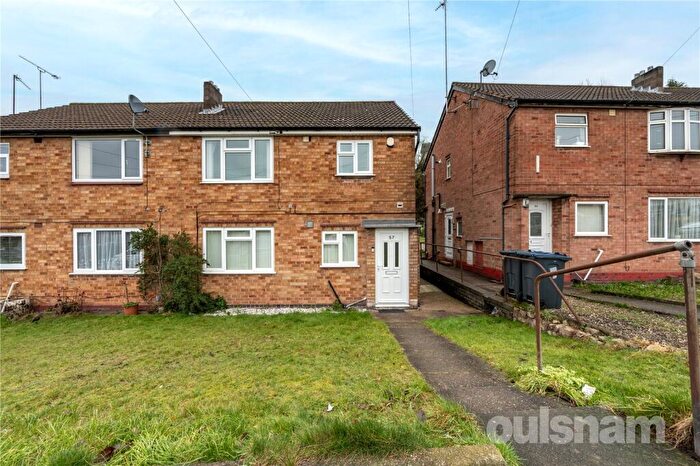
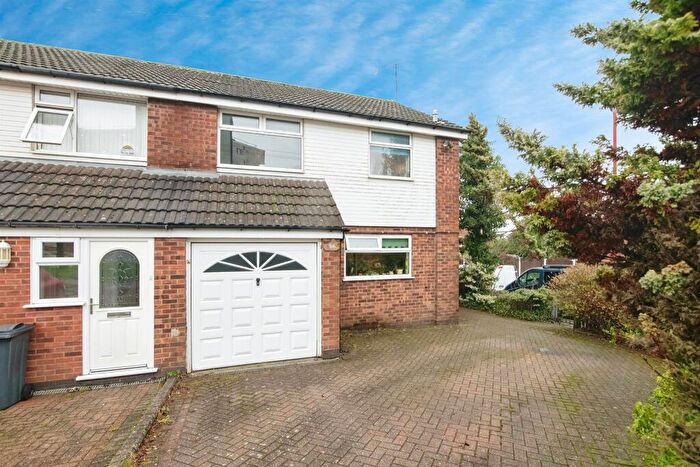
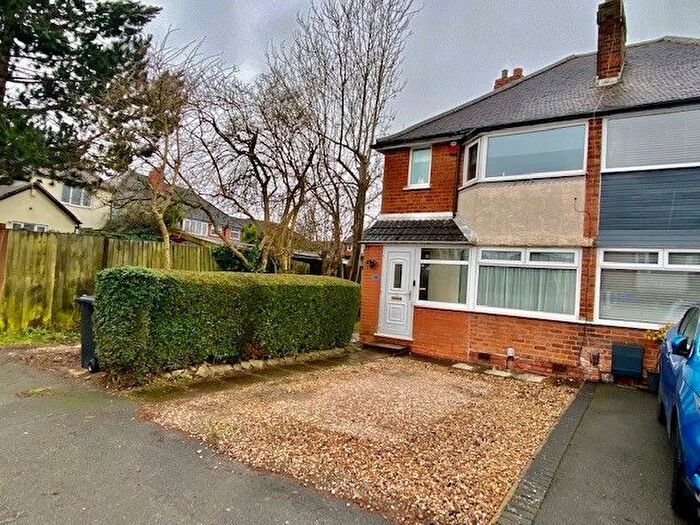
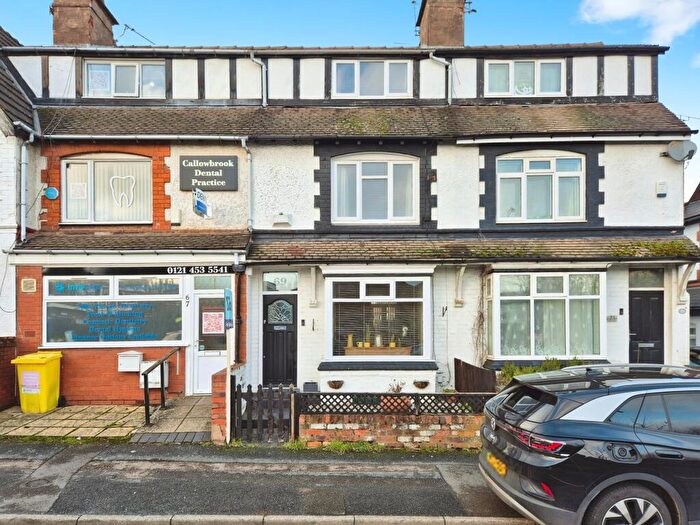
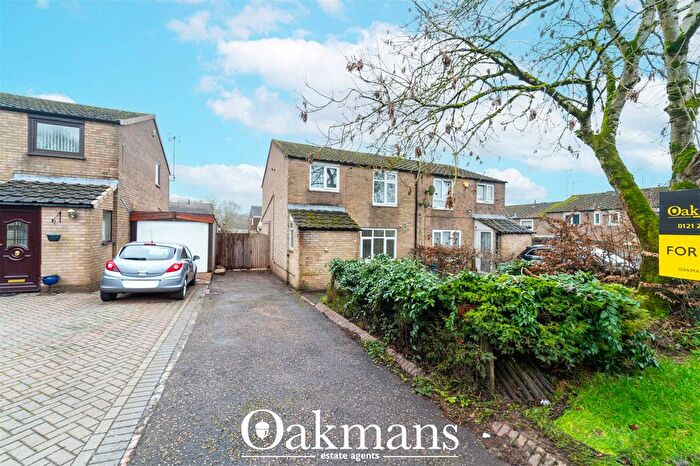
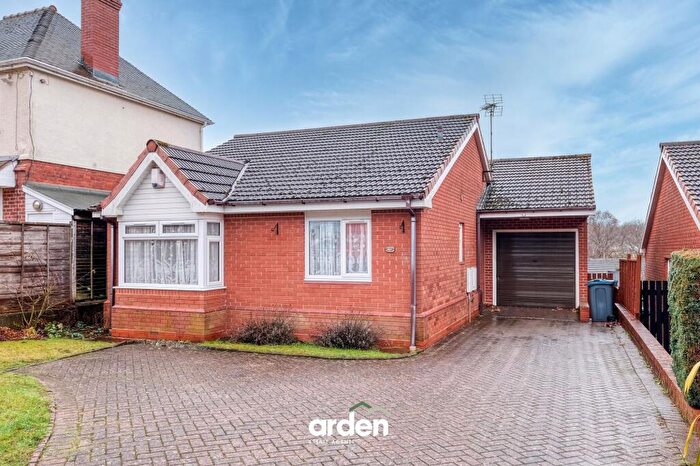
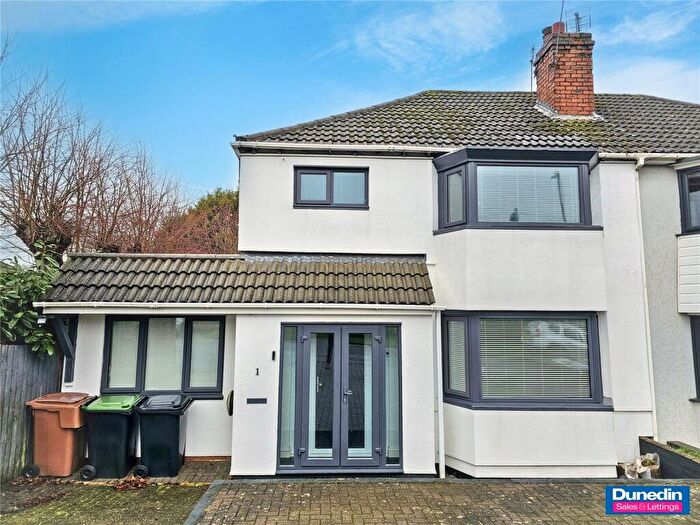
Properties for sale in Waseley
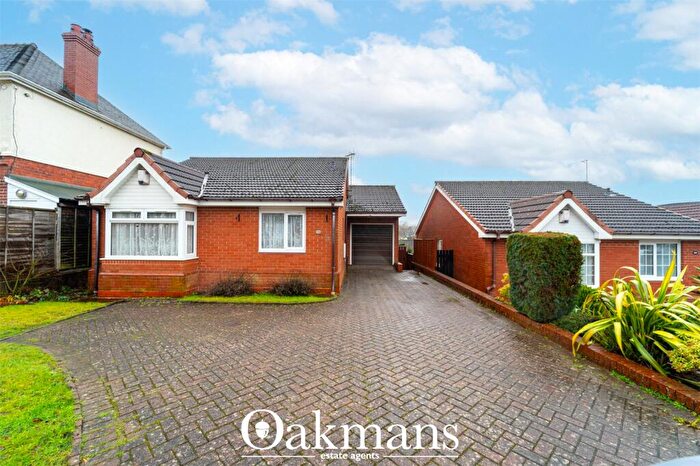
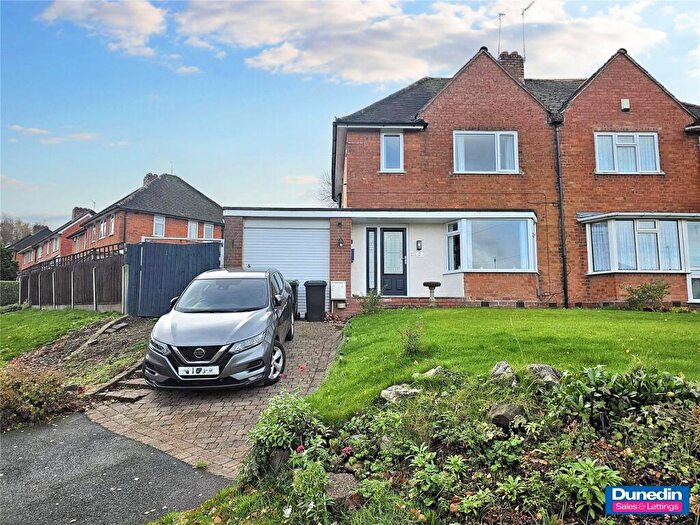
Previously listed properties in Waseley
Roads and Postcodes in Waseley
Navigate through our locations to find the location of your next house in Waseley, Birmingham for sale or to rent.
| Streets | Postcodes |
|---|---|
| Barrington Road | B45 9ER B45 9ES B45 9EU |
| Beeches Close | B45 9HD |
| Beverley Road | B45 9JG |
| Bowes Road | B45 9HL |
| Brook Road | B45 9UH |
| Brookend Drive | B45 9LA |
| Callowbrook Lane | B45 9HN B45 9HP B45 9HR B45 9HT B45 9HW B45 9HX B45 9HZ B45 9JY B45 9TG B45 9TR |
| Clent Road | B45 9UU B45 9UY B45 9XD B45 9XE |
| Cleves Drive | B45 9UT |
| Cleves Road | B45 9US |
| Coppice Close | B45 9DS |
| Gannow Green Lane | B45 9AT |
| Gannow Road | B45 9EH |
| Gannow Walk | B45 9EG |
| Graham Crescent | B45 9DD |
| Grange Crescent | B45 9XB |
| Gunner Lane | B45 9AE B45 9EP B45 9EX |
| Heronway | B45 9UG |
| Hillview Road | B45 9HB B45 9HG B45 9HH B45 9HJ B45 9HQ |
| Holywell Lane | B45 9AA B45 9EJ |
| Kineton Road | B45 9UJ |
| Leach Heath Lane | B45 9DF |
| Leasowe Road | B45 9TB B45 9TD |
| Library Way | B45 9JS |
| Lyndon Road | B45 9UP B45 9UR |
| Madley Close | B45 9XA |
| New Inns Lane | B45 9TS |
| New Road | B45 9HU B45 9HY B45 9JA B45 9JP B45 9JR B45 9JT |
| Pinewood Close | B45 9HE |
| Rea Avenue | B45 9SR B45 9SS |
| Richmond Road | B45 9UL B45 9UN B45 9UW |
| Rochford Close | B45 9JX |
| Romsley Close | B45 9UX |
| School Road | B45 9EL |
| Segbourne Road | B45 9SX B45 9SY |
| St Chads Road | B45 9DJ |
| The Avenue | B45 9UE |
| Waseley Road | B45 9TH B45 9TJ B45 9TL B45 9TN B45 9TP B45 9TW |
| Whetty Lane | B45 9DR |
| Windmill Avenue | B45 9SP B45 9ST B45 9SU B45 9TA B45 9TE |
| Woodlands Road | B45 9HA |
Transport near Waseley
- FAQ
- Price Paid By Year
- Property Type Price
Frequently asked questions about Waseley
What is the average price for a property for sale in Waseley?
The average price for a property for sale in Waseley is £251,241. This amount is 41% lower than the average price in Birmingham. There are 684 property listings for sale in Waseley.
What streets have the most expensive properties for sale in Waseley?
The streets with the most expensive properties for sale in Waseley are Madley Close at an average of £485,000, Holywell Lane at an average of £405,000 and Pinewood Close at an average of £322,500.
What streets have the most affordable properties for sale in Waseley?
The streets with the most affordable properties for sale in Waseley are New Road at an average of £132,796, Library Way at an average of £152,500 and Brook Road at an average of £190,000.
Which train stations are available in or near Waseley?
Some of the train stations available in or near Waseley are Longbridge, Northfield and Barnt Green.
Property Price Paid in Waseley by Year
The average sold property price by year was:
| Year | Average Sold Price | Price Change |
Sold Properties
|
|---|---|---|---|
| 2025 | £271,684 | 14% |
39 Properties |
| 2024 | £234,692 | -9% |
64 Properties |
| 2023 | £254,828 | 7% |
73 Properties |
| 2022 | £236,867 | 3% |
68 Properties |
| 2021 | £228,619 | 8% |
85 Properties |
| 2020 | £209,960 | 2% |
73 Properties |
| 2019 | £206,094 | 2% |
59 Properties |
| 2018 | £202,336 | 5% |
66 Properties |
| 2017 | £191,302 | 13% |
78 Properties |
| 2016 | £166,749 | 1% |
82 Properties |
| 2015 | £164,913 | 4% |
71 Properties |
| 2014 | £157,672 | 7% |
64 Properties |
| 2013 | £146,948 | -2% |
56 Properties |
| 2012 | £149,782 | 7% |
40 Properties |
| 2011 | £139,231 | -7% |
32 Properties |
| 2010 | £149,114 | 8% |
34 Properties |
| 2009 | £137,907 | -7% |
28 Properties |
| 2008 | £148,179 | -15% |
36 Properties |
| 2007 | £170,541 | 14% |
79 Properties |
| 2006 | £146,129 | 8% |
89 Properties |
| 2005 | £133,989 | 2% |
71 Properties |
| 2004 | £131,508 | 13% |
80 Properties |
| 2003 | £115,062 | 15% |
83 Properties |
| 2002 | £98,014 | 16% |
95 Properties |
| 2001 | £82,240 | 14% |
90 Properties |
| 2000 | £70,500 | 8% |
64 Properties |
| 1999 | £64,576 | 10% |
84 Properties |
| 1998 | £57,937 | 2% |
41 Properties |
| 1997 | £56,753 | -1% |
59 Properties |
| 1996 | £57,097 | 10% |
67 Properties |
| 1995 | £51,414 | - |
41 Properties |
Property Price per Property Type in Waseley
Here you can find historic sold price data in order to help with your property search.
The average Property Paid Price for specific property types in the last three years are:
| Property Type | Average Sold Price | Sold Properties |
|---|---|---|
| Semi Detached House | £266,854.00 | 108 Semi Detached Houses |
| Detached House | £348,958.00 | 12 Detached Houses |
| Terraced House | £236,318.00 | 40 Terraced Houses |
| Flat | £109,871.00 | 16 Flats |

