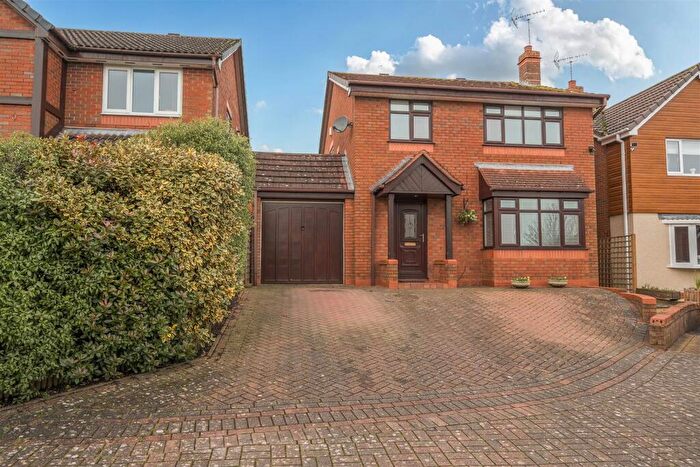
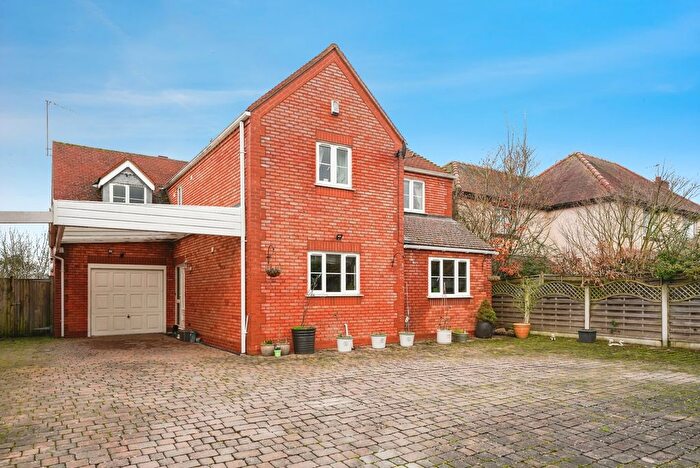
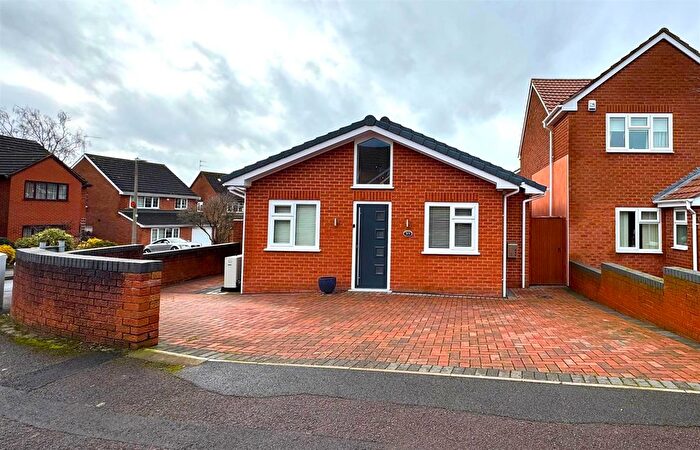
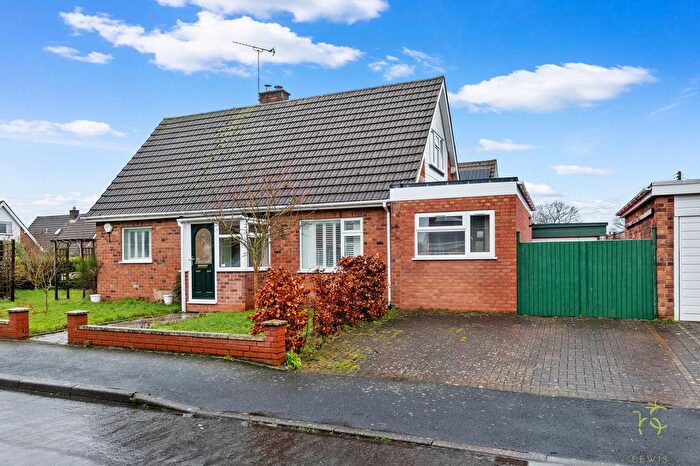
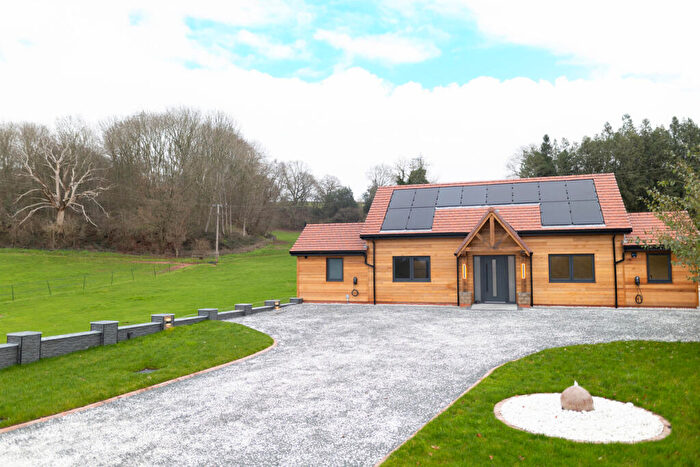
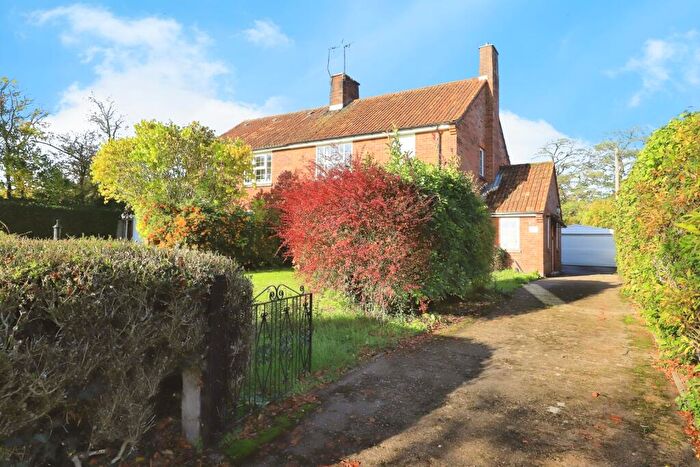
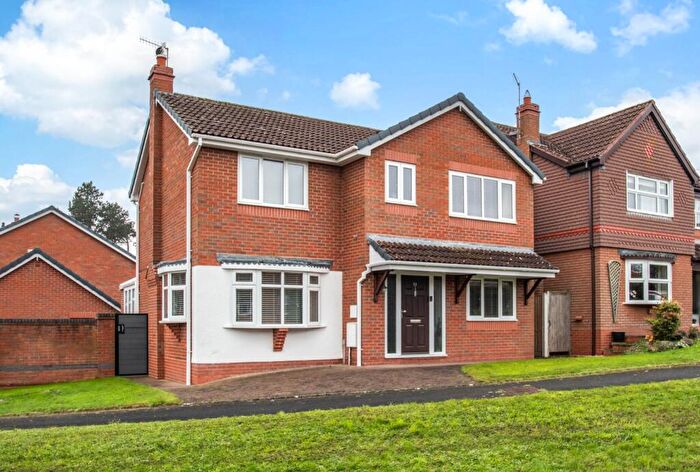
Houses for sale & to rent in Ombersley, Droitwich
House Prices in Ombersley
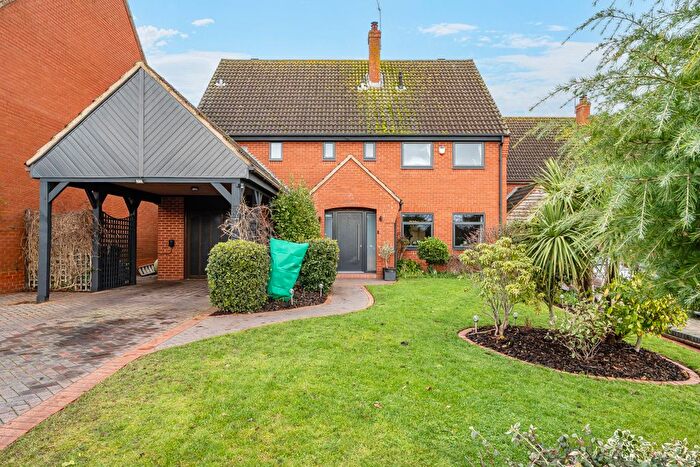
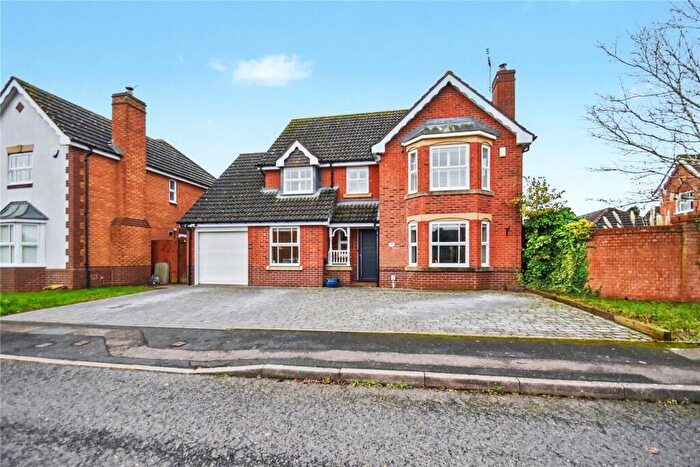
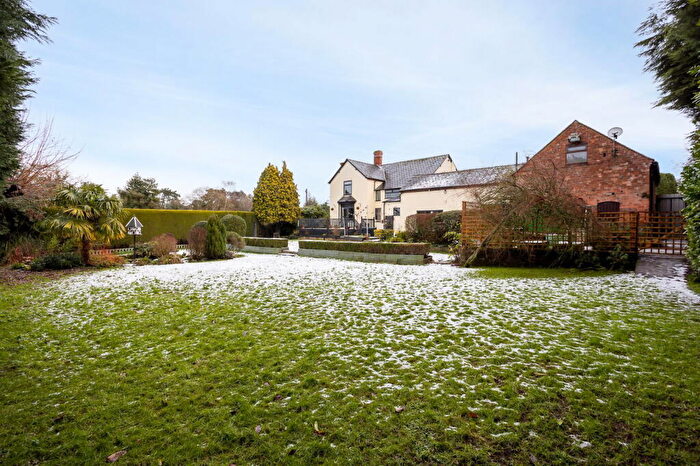
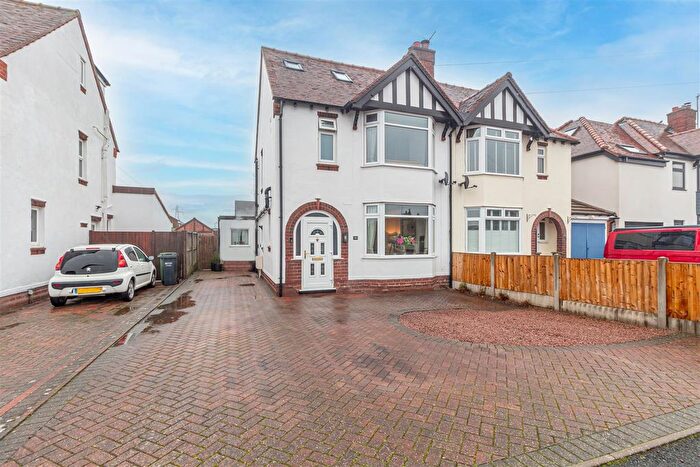
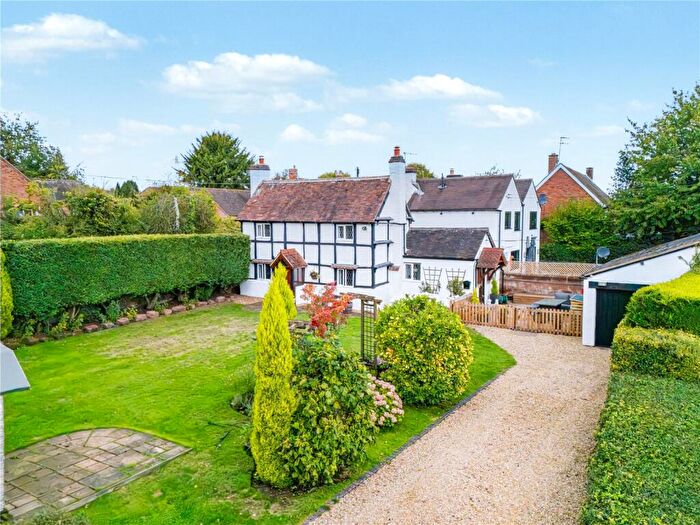
Properties in Ombersley have an average house price of £542,818.00 and had 55 Property Transactions within the last 3 years¹.
Ombersley is an area in Droitwich, Worcestershire with 774 households², where the most expensive property was sold for £1,250,000.00.
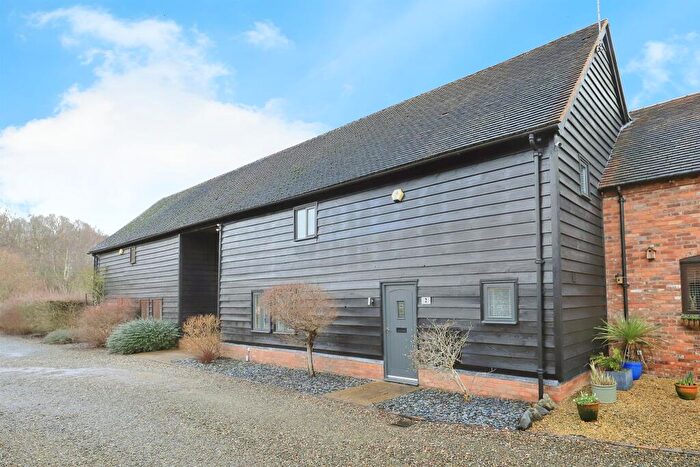
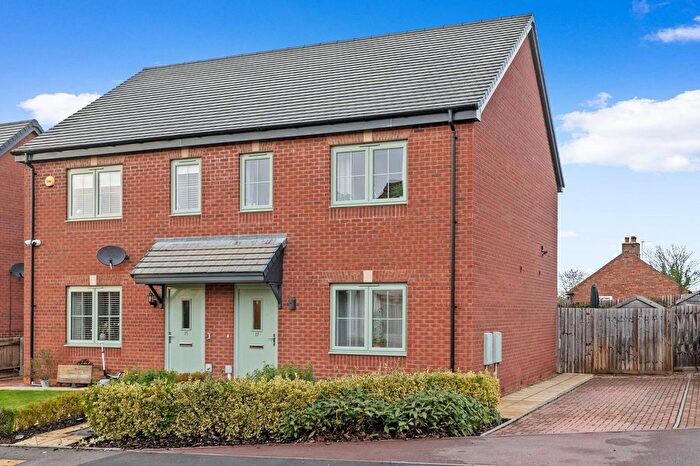
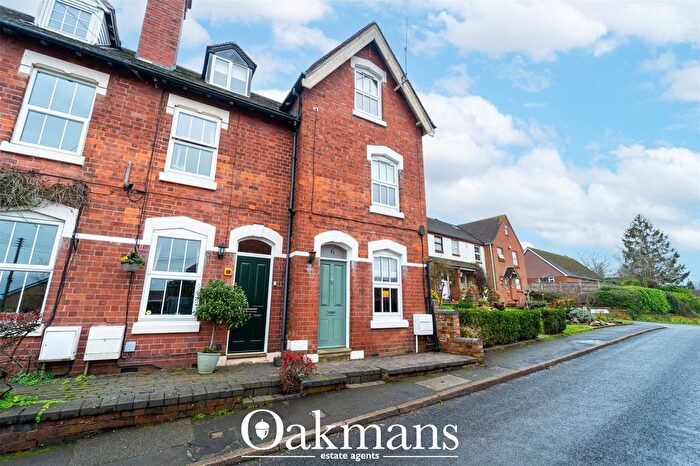
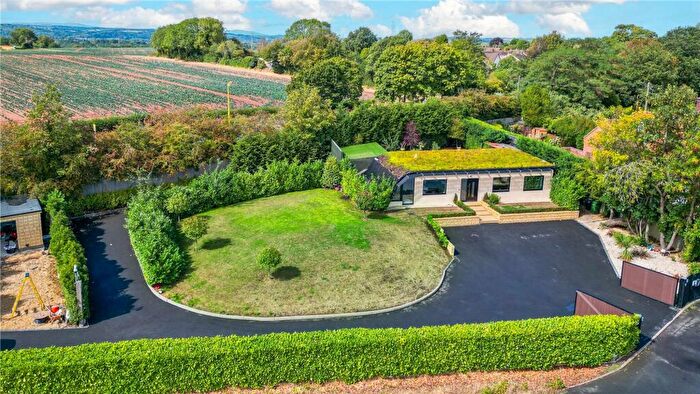
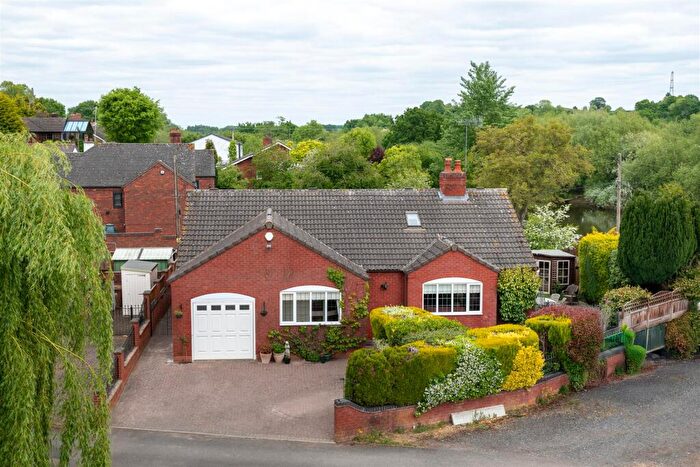
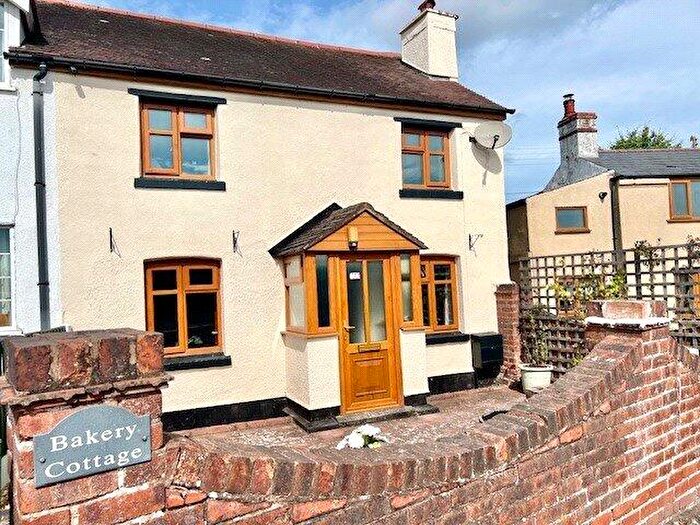
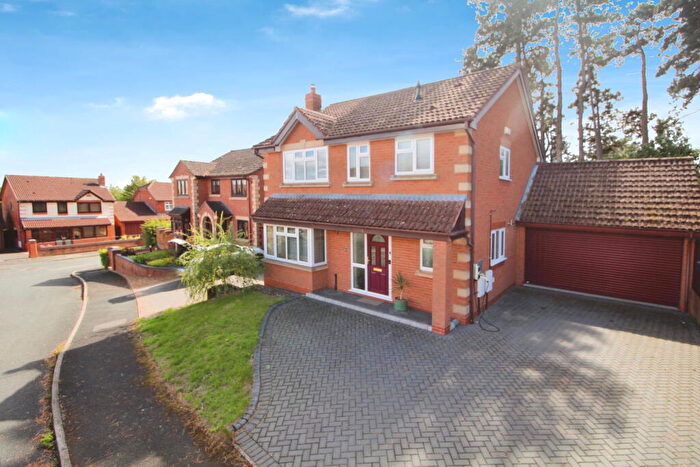
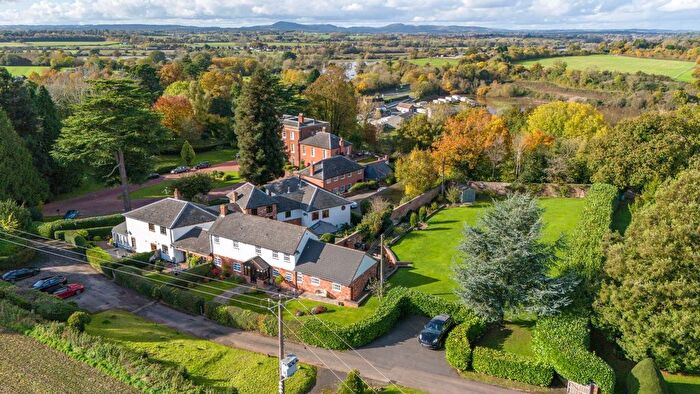
Properties for sale in Ombersley
Roads and Postcodes in Ombersley
Navigate through our locations to find the location of your next house in Ombersley, Droitwich for sale or to rent.
| Streets | Postcodes |
|---|---|
| Abberley View | WR9 0LB |
| Apple Tree Walk | WR9 0HQ |
| Bishops Wood Road | WR9 0LD WR9 0LE |
| Boreley Lane | WR9 0HS WR9 0HT WR9 0HU WR9 0HW WR9 0HX WR9 0HZ WR9 0HY |
| Chapel Lane | WR9 0DT |
| Chestnut Walk | WR9 0EB |
| Church Lane | WR9 0ER |
| Dough Bank | WR9 0HN |
| Droitwich Road | WR9 0DQ WR9 0DR |
| Faber Orchard | WR9 0FL |
| Hadley Heath | WR9 0AR |
| Hawford Wood | WR9 0EZ |
| Haye Lane | WR9 0EJ |
| Hill Crest Cottages | WR9 0AY |
| Hilltop | WR9 0ES |
| Holly Lane | WR9 0JD |
| Holt Fleet Road | WR9 0HJ WR9 0HG WR9 0HH |
| Hunt Green | WR9 0AW |
| Kidderminster Road | WR9 0JH |
| Lineholt | WR9 0LF WR9 0LG WR9 0LH WR9 0LQ |
| Lineholt Lane | WR9 0JU WR9 0JX WR9 0JZ WR9 0JY WR9 0LA |
| Long Headland | WR9 0DU |
| Longheadland | WR9 0DX WR9 0JB |
| Lord Hill Gardens | WR9 0FG |
| Main Road | WR9 0DP WR9 0DS WR9 0EH WR9 0EL WR9 0EP WR9 0ET WR9 0EW WR9 0EY WR9 0JG WR9 0JQ WR9 0EX WR9 0JJ |
| Northampton Lane | WR9 0LJ |
| Oakfield Road | WR9 0EE |
| Old Rectory Lane | WR9 0FS |
| Oldfield Lane | WR9 0JL WR9 0JN |
| Owlhill Lane | WR9 0LS |
| Parsonage Lane | WR9 0HP WR9 0HR |
| Powers | WR9 0HL |
| Racks Lane | WR9 0EN |
| Sandys Road | WR9 0DY WR9 0ED |
| Sinton Lane | WR9 0EU |
| Southall Farm Cottages | WR9 0QB |
| The Hamptons | WR9 0EA |
| Uphampton | WR9 0JP WR9 0JR WR9 0JS WR9 0JT |
| Uphampton Lane | WR9 0JW |
| Wellington Road | WR9 0DZ |
| Woodfield Lane | WR9 0LL |
| Woodhall Close | WR9 0EG |
| Woodhall Court | WR9 0DW |
| Woodhall Lane | WR9 0EF WR9 0EQ |
| WR9 0AP WR9 0AS WR9 0AT WR9 0AU WR9 0AX WR9 0PF WR9 0QA WR9 0BF WR9 0FJ |
Transport near Ombersley
-
Droitwich Spa Station
-
Hartlebury Station
-
Worcester Foregate Street Station
-
Worcester Shrub Hill Station
-
Kidderminster Station
-
Bromsgrove Station
-
Blakedown Station
- FAQ
- Price Paid By Year
- Property Type Price
Frequently asked questions about Ombersley
What is the average price for a property for sale in Ombersley?
The average price for a property for sale in Ombersley is £542,818. This amount is 65% higher than the average price in Droitwich. There are 317 property listings for sale in Ombersley.
What streets have the most expensive properties for sale in Ombersley?
The streets with the most expensive properties for sale in Ombersley are Lineholt Lane at an average of £942,500, Boreley Lane at an average of £810,000 and Uphampton at an average of £767,000.
What streets have the most affordable properties for sale in Ombersley?
The streets with the most affordable properties for sale in Ombersley are Oakfield Road at an average of £215,000, Northampton Lane at an average of £300,000 and Apple Tree Walk at an average of £331,000.
Which train stations are available in or near Ombersley?
Some of the train stations available in or near Ombersley are Droitwich Spa, Hartlebury and Worcester Foregate Street.
Property Price Paid in Ombersley by Year
The average sold property price by year was:
| Year | Average Sold Price | Price Change |
Sold Properties
|
|---|---|---|---|
| 2025 | £538,600 | -1% |
15 Properties |
| 2024 | £543,652 | -0,3% |
23 Properties |
| 2023 | £545,411 | -12% |
17 Properties |
| 2022 | £612,166 | 14% |
32 Properties |
| 2021 | £524,343 | 18% |
24 Properties |
| 2020 | £428,775 | -9% |
27 Properties |
| 2019 | £467,029 | 15% |
17 Properties |
| 2018 | £395,964 | -29% |
14 Properties |
| 2017 | £510,136 | 24% |
18 Properties |
| 2016 | £386,486 | -9% |
30 Properties |
| 2015 | £421,617 | 27% |
21 Properties |
| 2014 | £308,767 | -29% |
23 Properties |
| 2013 | £399,818 | 34% |
18 Properties |
| 2012 | £265,348 | -56% |
11 Properties |
| 2011 | £413,218 | -1% |
16 Properties |
| 2010 | £415,772 | 12% |
11 Properties |
| 2009 | £365,493 | -8% |
16 Properties |
| 2008 | £396,283 | -2% |
9 Properties |
| 2007 | £405,275 | 4% |
20 Properties |
| 2006 | £388,779 | 16% |
25 Properties |
| 2005 | £327,534 | -12% |
13 Properties |
| 2004 | £367,946 | 32% |
29 Properties |
| 2003 | £250,497 | 10% |
22 Properties |
| 2002 | £226,595 | -13% |
20 Properties |
| 2001 | £256,772 | 20% |
33 Properties |
| 2000 | £206,694 | 14% |
18 Properties |
| 1999 | £176,986 | 22% |
29 Properties |
| 1998 | £138,780 | 9% |
25 Properties |
| 1997 | £125,872 | -6% |
21 Properties |
| 1996 | £133,371 | 22% |
18 Properties |
| 1995 | £104,506 | - |
17 Properties |
Property Price per Property Type in Ombersley
Here you can find historic sold price data in order to help with your property search.
The average Property Paid Price for specific property types in the last three years are:
| Property Type | Average Sold Price | Sold Properties |
|---|---|---|
| Semi Detached House | £406,031.00 | 16 Semi Detached Houses |
| Detached House | £665,031.00 | 32 Detached Houses |
| Terraced House | £296,785.00 | 7 Terraced Houses |

