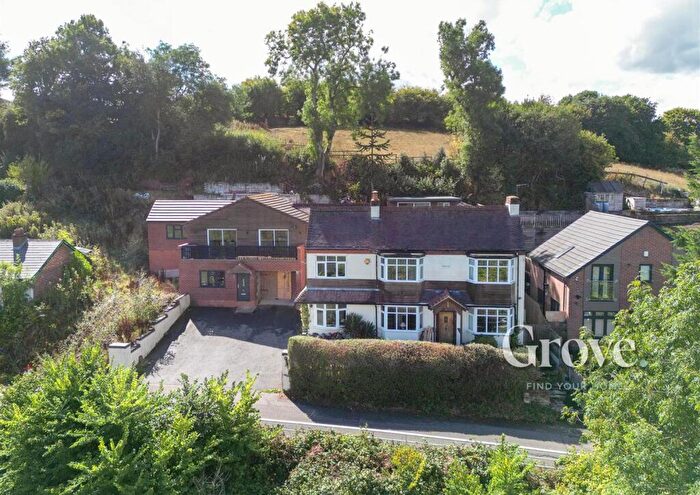
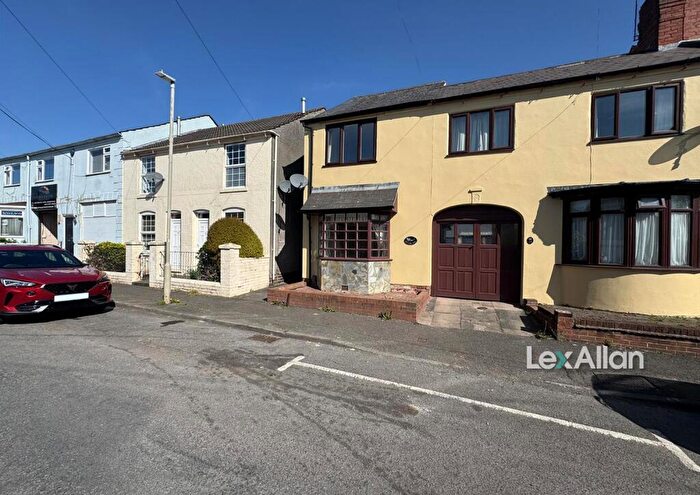
Houses for sale & to rent in Uffdown, Halesowen
House Prices in Uffdown
Properties in Uffdown have an average house price of £453,335.00 and had 79 Property Transactions within the last 3 years¹.
Uffdown is an area in Halesowen, Worcestershire with 840 households², where the most expensive property was sold for £1,475,000.00.
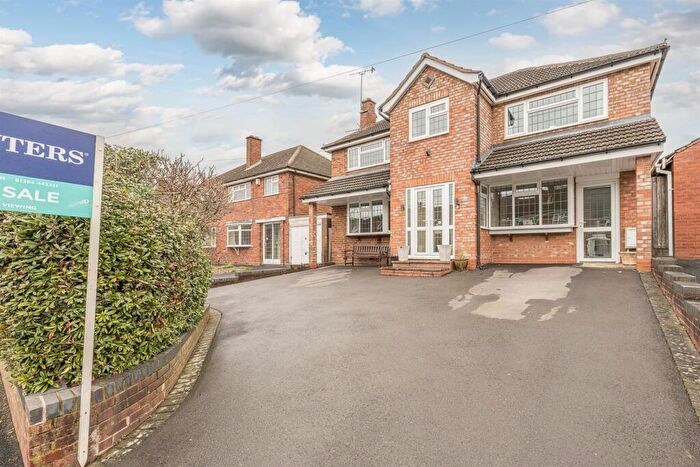
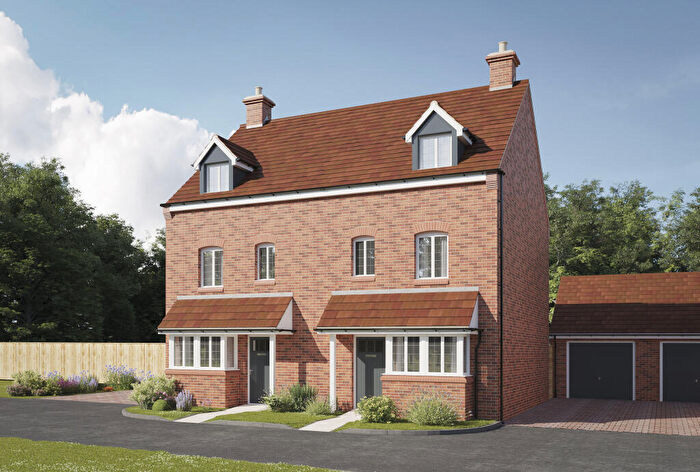
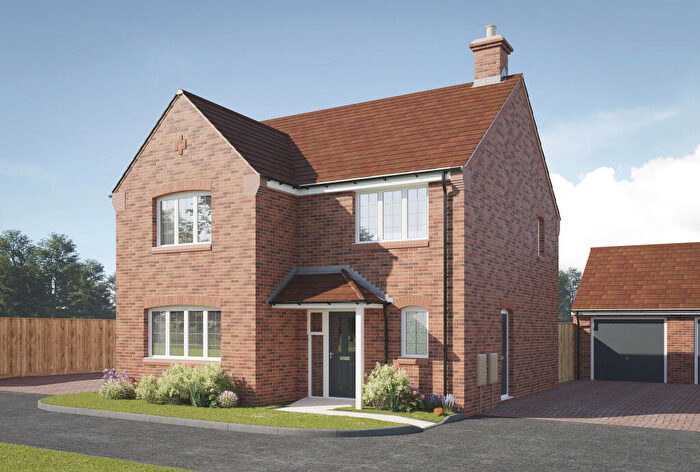
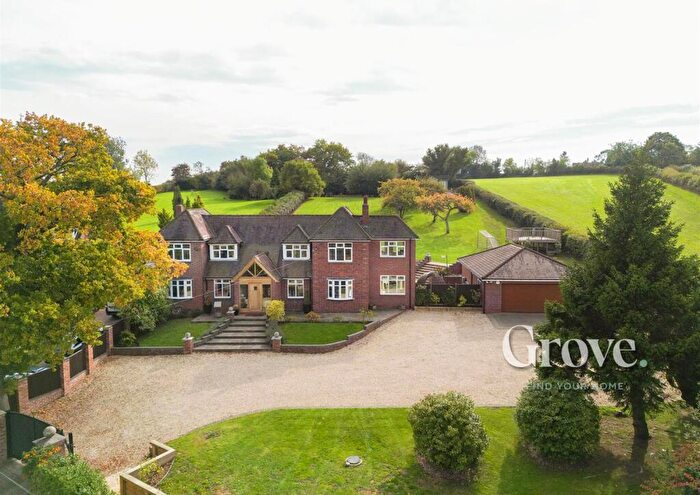
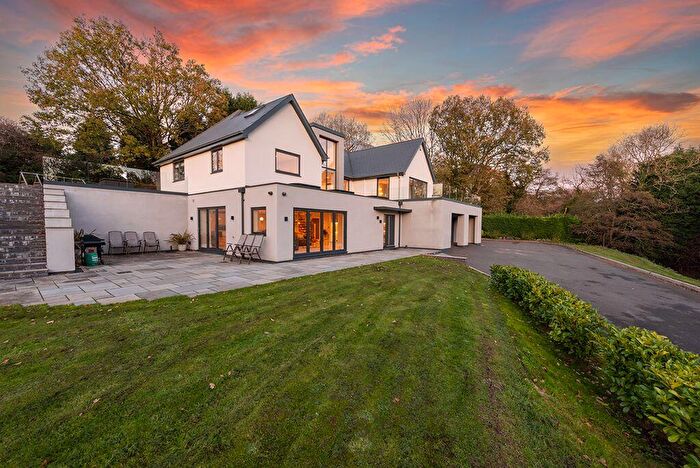
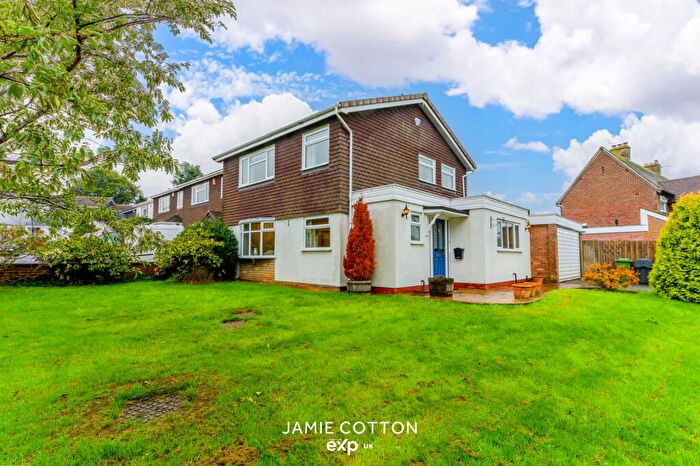
Properties for sale in Uffdown
Roads and Postcodes in Uffdown
Navigate through our locations to find the location of your next house in Uffdown, Halesowen for sale or to rent.
| Streets | Postcodes |
|---|---|
| Bromsgrove Road | B62 0ET B62 0JJ B62 0JL B62 0JN B62 0JS B62 0JU B62 0JW B62 0JX B62 0LA B62 0LE B62 0LF B62 0LH |
| Chapel Lane | B62 0NG |
| Chapmans Hill | B62 0HA B62 0HD |
| Dark Lane | B62 0PJ B62 0PL B62 0PN B62 0PW |
| Dayhouse Bank | B62 0EU |
| Eastleigh Drive | B62 0PA |
| Farley Lane | B62 0LG B62 0LN |
| Fieldhouse Lane | B62 0NH |
| Green Lane | B62 0HB |
| Hillcrest Road | B62 0PB B62 0PE B62 0PF |
| Holt Lane | B62 0ND |
| Ivy Lane | B62 0NJ |
| Newtown Lane | B62 0EJ |
| Old House Lane | B62 0EX |
| Poplar Lane | B62 0PP |
| Shut Mill Lane | B62 0LY |
| Spring Lane | B62 0NA |
| St Kenelms Road | B62 0NE B62 0NF B62 0NT B62 0NU B62 0PG B62 0PQ |
| The Alders | B62 0PT |
| The Close | B62 0JP |
| The Hedgerows | B62 0PS |
| Uffmoor Lane | B62 0NW |
| Waverley Crescent | B62 0NY B62 0NZ |
| Winston Drive | B62 0PD |
| Yew Tree Place | B62 0NX |
Transport near Uffdown
-
Longbridge Station
-
Hagley Station
-
Old Hill Station
-
Stourbridge Junction Station
-
Lye Station
-
Cradley Heath Station
-
Northfield Station
-
Rowley Regis Station
-
Stourbridge Town Station
-
Barnt Green Station
- FAQ
- Price Paid By Year
- Property Type Price
Frequently asked questions about Uffdown
What is the average price for a property for sale in Uffdown?
The average price for a property for sale in Uffdown is £453,335. This amount is 3% lower than the average price in Halesowen. There are 395 property listings for sale in Uffdown.
What streets have the most expensive properties for sale in Uffdown?
The streets with the most expensive properties for sale in Uffdown are Old House Lane at an average of £760,000, Fieldhouse Lane at an average of £680,500 and Bromsgrove Road at an average of £663,850.
What streets have the most affordable properties for sale in Uffdown?
The streets with the most affordable properties for sale in Uffdown are The Close at an average of £197,800, Dayhouse Bank at an average of £229,375 and Waverley Crescent at an average of £288,285.
Which train stations are available in or near Uffdown?
Some of the train stations available in or near Uffdown are Longbridge, Hagley and Old Hill.
Property Price Paid in Uffdown by Year
The average sold property price by year was:
| Year | Average Sold Price | Price Change |
Sold Properties
|
|---|---|---|---|
| 2025 | £532,578 | 17% |
19 Properties |
| 2024 | £441,435 | 5% |
27 Properties |
| 2023 | £417,446 | 6% |
33 Properties |
| 2022 | £391,203 | -14% |
27 Properties |
| 2021 | £446,216 | 11% |
46 Properties |
| 2020 | £397,357 | 16% |
21 Properties |
| 2019 | £335,553 | 2% |
27 Properties |
| 2018 | £328,435 | -26% |
37 Properties |
| 2017 | £414,055 | 24% |
27 Properties |
| 2016 | £315,778 | 15% |
39 Properties |
| 2015 | £268,624 | 6% |
42 Properties |
| 2014 | £251,660 | -1% |
34 Properties |
| 2013 | £254,722 | 5% |
27 Properties |
| 2012 | £242,019 | -16% |
23 Properties |
| 2011 | £280,071 | -2% |
21 Properties |
| 2010 | £286,690 | 13% |
23 Properties |
| 2009 | £250,099 | -7% |
10 Properties |
| 2008 | £266,428 | 10% |
21 Properties |
| 2007 | £238,854 | -9% |
35 Properties |
| 2006 | £261,177 | -4% |
35 Properties |
| 2005 | £272,297 | 9% |
34 Properties |
| 2004 | £249,110 | 8% |
32 Properties |
| 2003 | £229,765 | 23% |
48 Properties |
| 2002 | £176,777 | 14% |
34 Properties |
| 2001 | £152,387 | -5% |
31 Properties |
| 2000 | £159,248 | 27% |
40 Properties |
| 1999 | £115,938 | 4% |
34 Properties |
| 1998 | £110,753 | -8% |
25 Properties |
| 1997 | £119,066 | 2% |
30 Properties |
| 1996 | £116,337 | 9% |
38 Properties |
| 1995 | £105,290 | - |
31 Properties |
Property Price per Property Type in Uffdown
Here you can find historic sold price data in order to help with your property search.
The average Property Paid Price for specific property types in the last three years are:
| Property Type | Average Sold Price | Sold Properties |
|---|---|---|
| Semi Detached House | £378,447.00 | 24 Semi Detached Houses |
| Detached House | £638,360.00 | 34 Detached Houses |
| Terraced House | £237,093.00 | 16 Terraced Houses |
| Flat | £246,600.00 | 5 Flats |

