Houses for sale & to rent in Wells, Malvern
House Prices in Wells
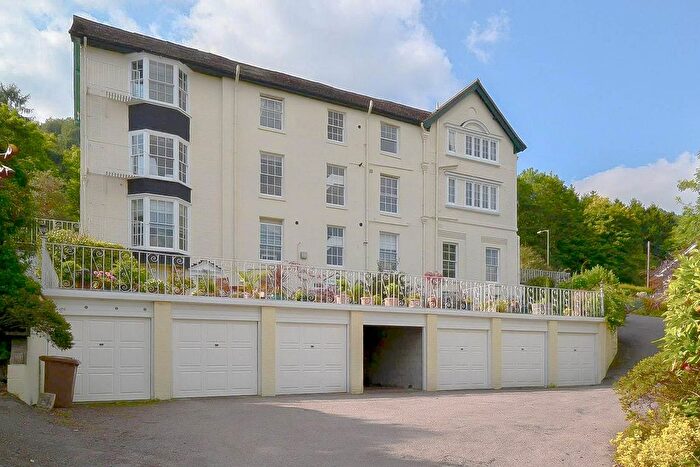
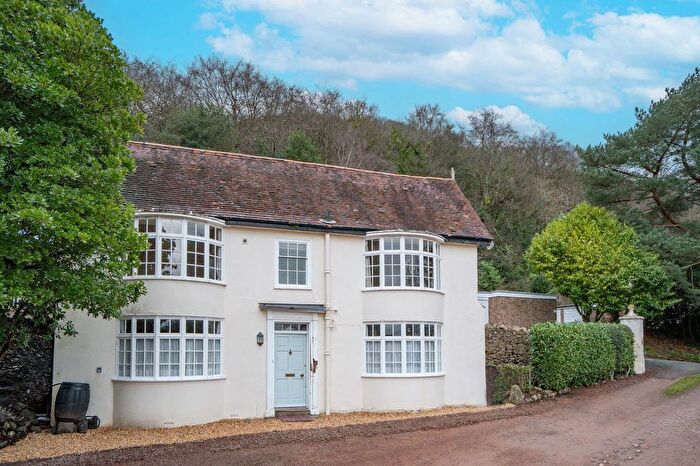
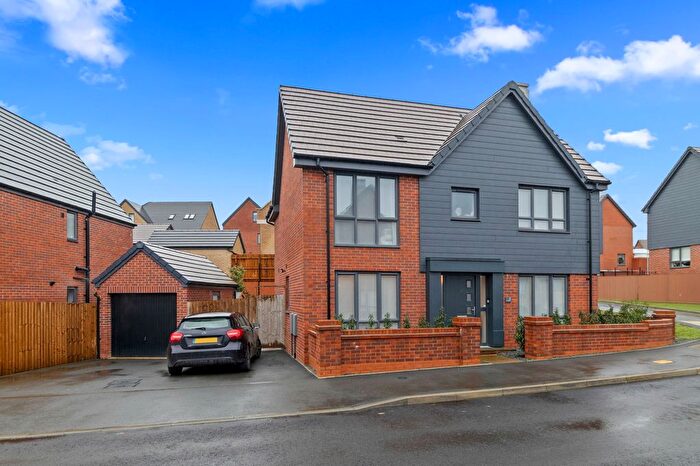
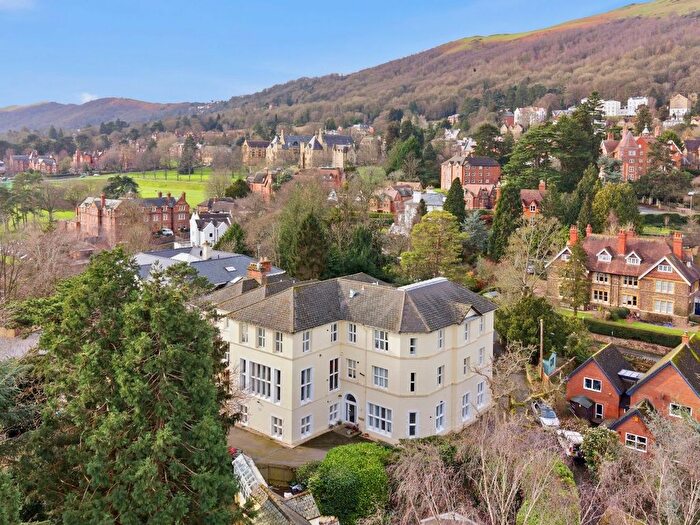
Properties in Wells have an average house price of £396,939.00 and had 173 Property Transactions within the last 3 years¹.
Wells is an area in Malvern, Worcestershire with 1,419 households², where the most expensive property was sold for £1,015,000.00.
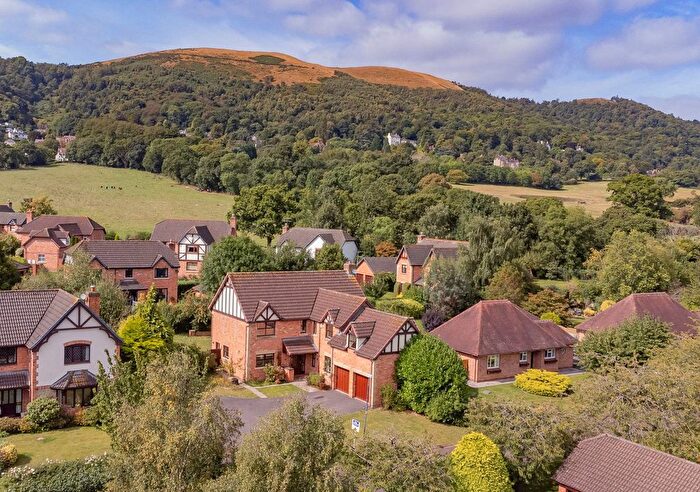
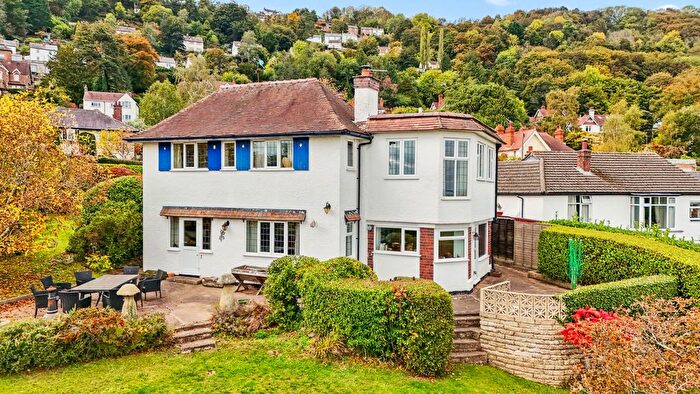
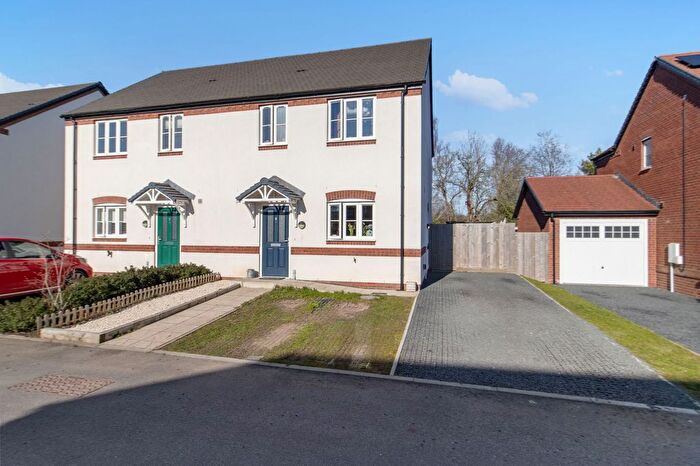
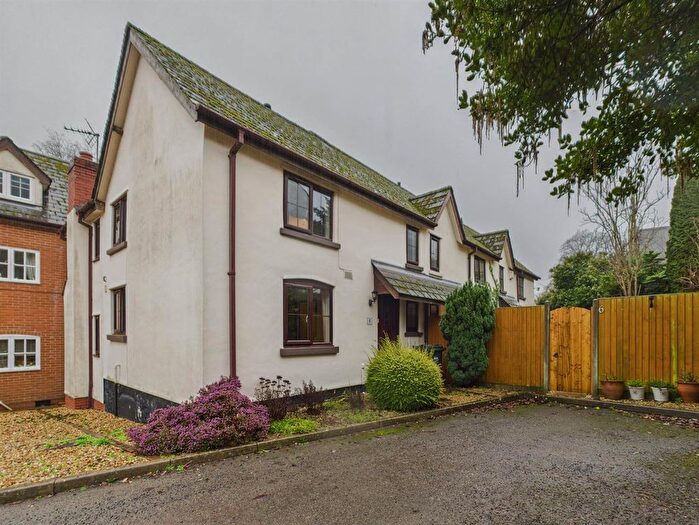
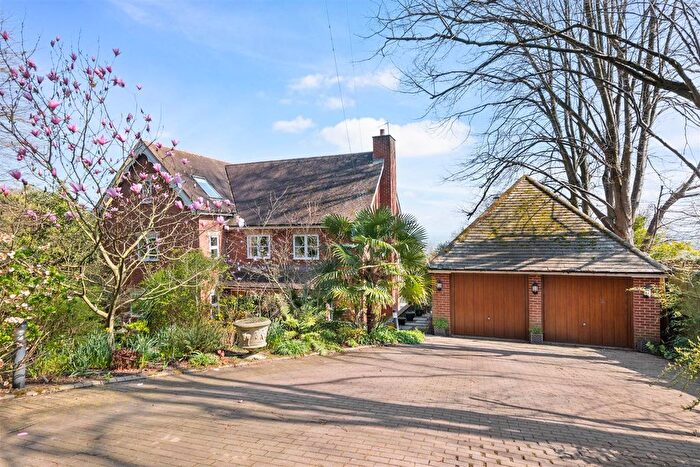
Properties for sale in Wells
Previously listed properties in Wells
Roads and Postcodes in Wells
Navigate through our locations to find the location of your next house in Wells, Malvern for sale or to rent.
| Streets | Postcodes |
|---|---|
| Assarts Lane | WR14 4JR |
| Assarts Road | WR14 4HW |
| Benbow Close | WR14 4JJ |
| Benton Close | WR14 4LL |
| Blackhill | WR14 4JT |
| Blackmore Park Road | WR13 6PH |
| Cambridge Close | WR14 4JZ |
| Chase Road | WR14 4JY |
| Cherry Tree Drive | WR14 4AU |
| Chestnut Drive | WR14 4AS |
| Eaton Road | WR14 4PE |
| Fruitlands | WR14 4AH WR14 4XA WR14 4XB WR14 4XF WR14 4XQ |
| Gordon Terrace | WR14 4ER |
| Green Lane | WR14 4HT WR14 4HU WR14 4JQ |
| Grundys Lane | WR14 4HS |
| Hancocks Lane | WR14 4JP |
| Hanley Road | WR14 4HY WR14 4HZ WR14 4PH WR14 4PQ |
| Hanley Terrace | WR14 4PF |
| Heathlands Close | WR14 4HR |
| Hillside Close | WR14 4EU |
| Holly View Drive | WR14 4AQ WR14 4BF |
| Holywell Road | WR14 4LE WR14 4LF WR14 4LH WR14 4LQ WR14 4LG |
| Homestead Close | WR14 4HG |
| Jasmine Road | WR14 4XD |
| Juniper Way | WR14 4XG |
| King Edwards Road | WR14 4AJ |
| Kings Road | WR14 4HL |
| Lime Tree Avenue | WR14 4XE |
| Little Malvern | WR14 4JN |
| Lower Wyche Road | WR14 4ET |
| Merebrook Close | WR14 4JW |
| Mulberry Drive | WR14 4AT |
| Oaklands | WR14 4JE |
| Old Wyche Road | WR14 4EP |
| Peachfield Close | WR14 4AN |
| Peachfield Road | WR14 3LE WR14 4AL WR14 4AP WR14 4AR WR14 3LD |
| Pear Tree Close | WR14 4AW |
| Rothwell Road | WR14 4HX |
| Shuttlefast Lane | WR14 4JB |
| South Lawn | WR14 4RY |
| St Peters Close | WR14 4JS |
| St Wulstans Drive | WR14 4JA |
| The Crescent | WR14 4JG |
| The Moorlands | WR14 4PS |
| Treetops Drive | WR14 4XH |
| Upper Welland Road | WR14 4HJ WR14 4HN WR14 4JU WR14 4LA WR14 4LB |
| Walnut Crescent | WR14 4AX |
| Watery Lane | WR14 4JX |
| Welland | WR13 6SP |
| Wells Close | WR14 4HP |
| Wells Road | WR14 4HA WR14 4HB WR14 4HD WR14 4HE WR14 4HF WR14 4HH WR14 4JH WR14 4JL WR14 4PA WR14 4PB WR14 4PD WR14 4PG WR14 4JF |
| Westminster Road | WR14 4ES |
| Woodfarm Road | WR14 4PL WR14 4PP WR14 4PR WR14 4PN |
| Woodlands Close | WR14 4JD |
| Wyche Road | WR14 4EF WR14 4EG WR14 4EQ |
| Yew Tree Lane | WR14 4LJ |
| WR13 6NW |
Transport near Wells
- FAQ
- Price Paid By Year
- Property Type Price
Frequently asked questions about Wells
What is the average price for a property for sale in Wells?
The average price for a property for sale in Wells is £396,939. This amount is 14% higher than the average price in Malvern. There are 618 property listings for sale in Wells.
What streets have the most expensive properties for sale in Wells?
The streets with the most expensive properties for sale in Wells are St Wulstans Drive at an average of £810,000, St Peters Close at an average of £805,000 and Eaton Road at an average of £675,000.
What streets have the most affordable properties for sale in Wells?
The streets with the most affordable properties for sale in Wells are Chestnut Drive at an average of £130,750, Mulberry Drive at an average of £206,250 and Westminster Road at an average of £265,775.
Which train stations are available in or near Wells?
Some of the train stations available in or near Wells are Colwall, Great Malvern and Malvern Link.
Property Price Paid in Wells by Year
The average sold property price by year was:
| Year | Average Sold Price | Price Change |
Sold Properties
|
|---|---|---|---|
| 2025 | £376,711 | -16% |
56 Properties |
| 2024 | £436,171 | 13% |
54 Properties |
| 2023 | £381,292 | -1% |
63 Properties |
| 2022 | £385,663 | - |
76 Properties |
| 2021 | £385,527 | 12% |
94 Properties |
| 2020 | £340,831 | 12% |
58 Properties |
| 2019 | £300,372 | 0,3% |
61 Properties |
| 2018 | £299,558 | -6% |
79 Properties |
| 2017 | £318,145 | 13% |
76 Properties |
| 2016 | £276,590 | 3% |
67 Properties |
| 2015 | £268,455 | -10% |
69 Properties |
| 2014 | £295,954 | 14% |
67 Properties |
| 2013 | £255,019 | -3% |
69 Properties |
| 2012 | £262,834 | 1% |
68 Properties |
| 2011 | £259,166 | -2% |
55 Properties |
| 2010 | £265,362 | 20% |
33 Properties |
| 2009 | £211,836 | -29% |
55 Properties |
| 2008 | £273,334 | -3% |
39 Properties |
| 2007 | £280,373 | 6% |
75 Properties |
| 2006 | £264,888 | 7% |
81 Properties |
| 2005 | £246,470 | 15% |
75 Properties |
| 2004 | £209,710 | -7% |
74 Properties |
| 2003 | £223,703 | 3% |
80 Properties |
| 2002 | £216,275 | 30% |
100 Properties |
| 2001 | £150,730 | 16% |
93 Properties |
| 2000 | £126,261 | 9% |
73 Properties |
| 1999 | £114,398 | 13% |
98 Properties |
| 1998 | £100,046 | -30% |
76 Properties |
| 1997 | £129,989 | 25% |
103 Properties |
| 1996 | £97,944 | -0,2% |
81 Properties |
| 1995 | £98,115 | - |
73 Properties |
Property Price per Property Type in Wells
Here you can find historic sold price data in order to help with your property search.
The average Property Paid Price for specific property types in the last three years are:
| Property Type | Average Sold Price | Sold Properties |
|---|---|---|
| Semi Detached House | £290,187.00 | 31 Semi Detached Houses |
| Detached House | £506,642.00 | 98 Detached Houses |
| Terraced House | £238,470.00 | 10 Terraced Houses |
| Flat | £224,676.00 | 34 Flats |

