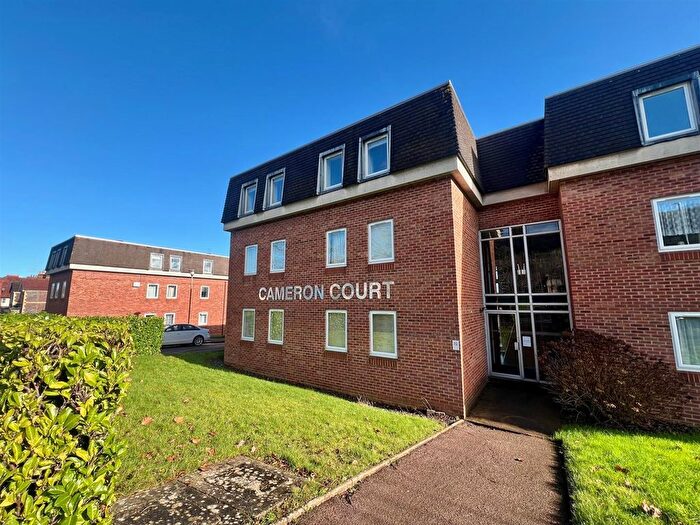
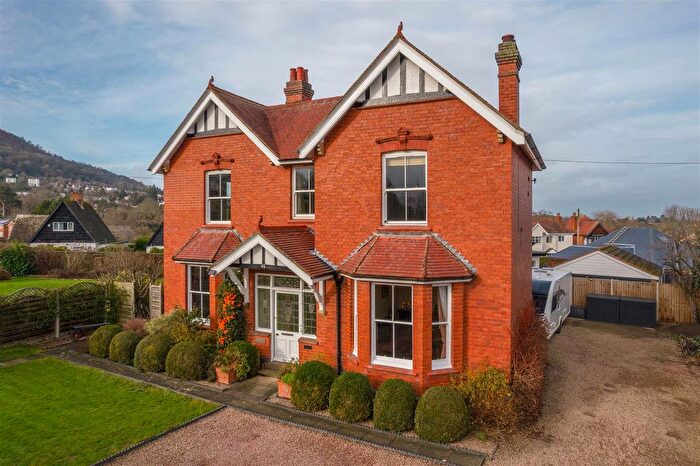
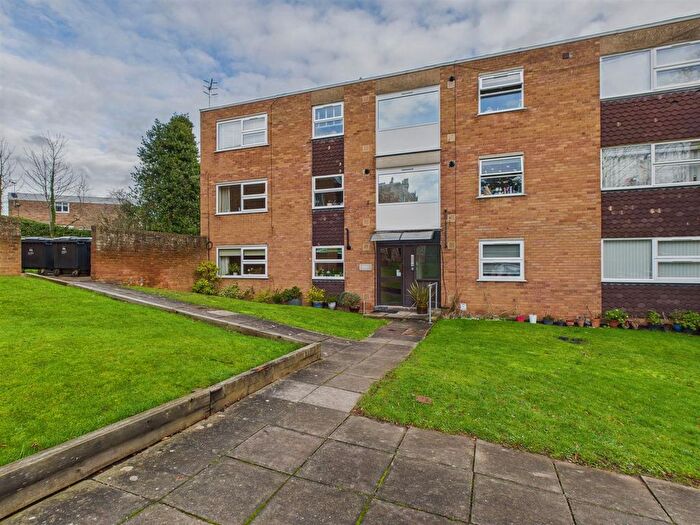
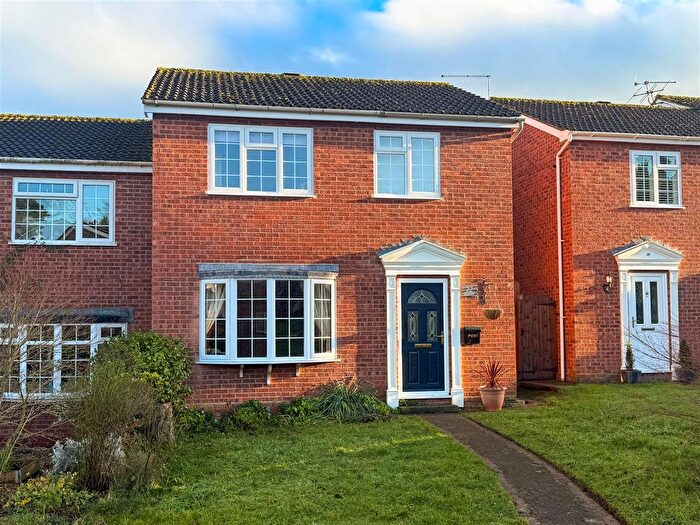
Houses for sale & to rent in West, Malvern
House Prices in West
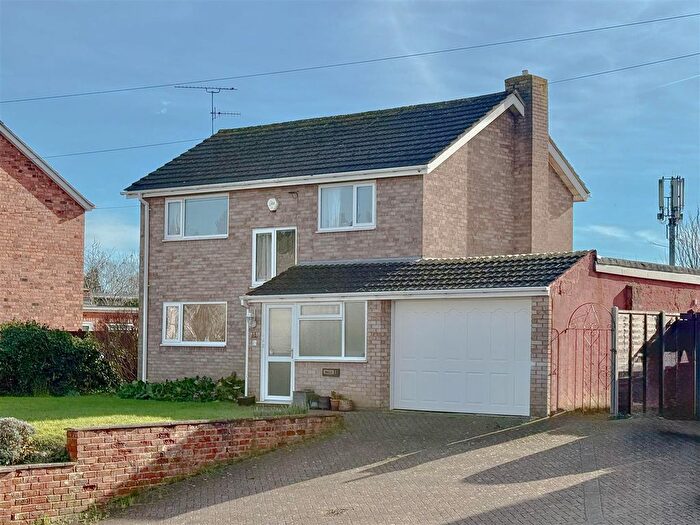
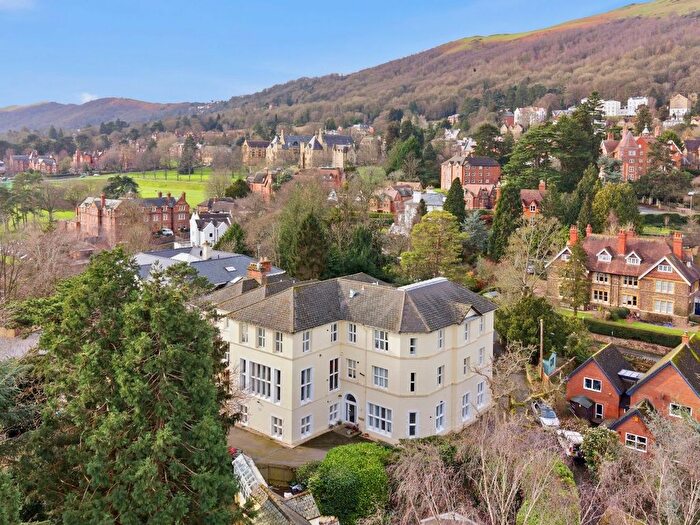
Properties in West have an average house price of £376,891.00 and had 179 Property Transactions within the last 3 years¹.
West is an area in Malvern, Worcestershire with 1,818 households², where the most expensive property was sold for £1,350,000.00.
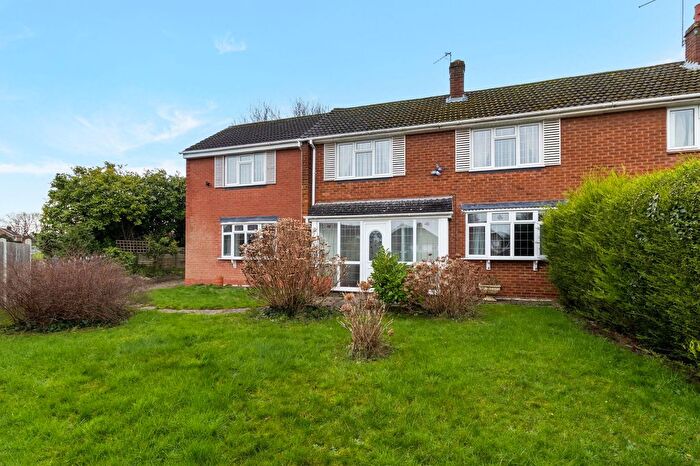
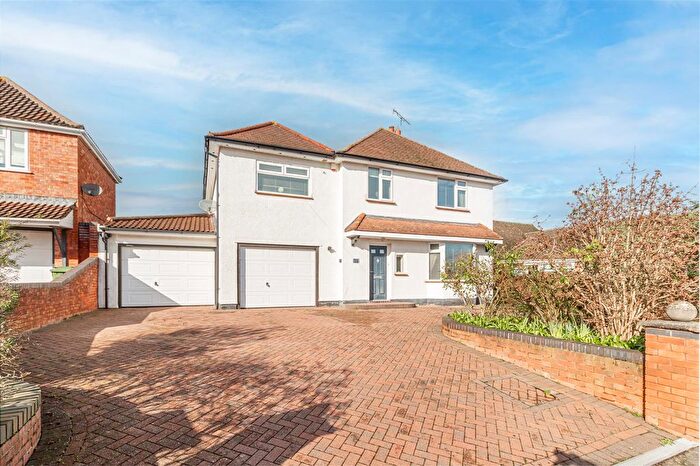
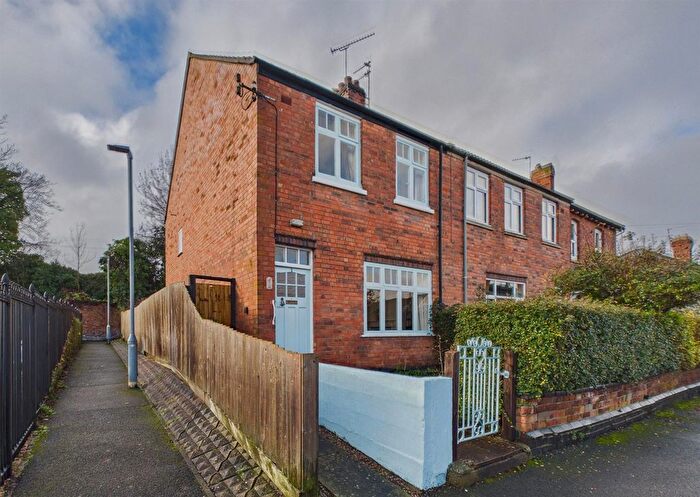
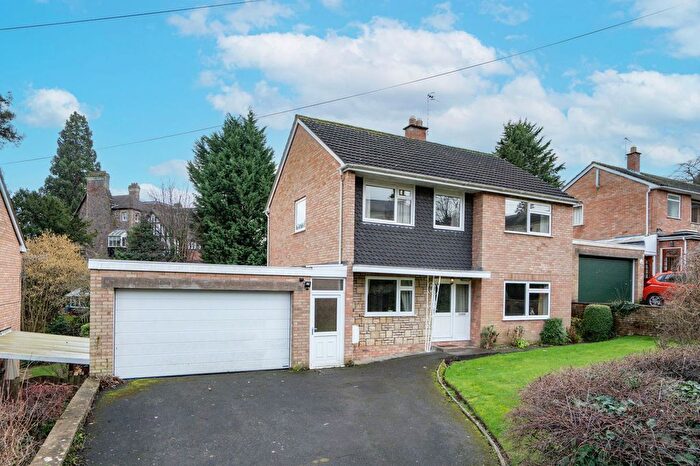
Properties for sale in West
Roads and Postcodes in West
Navigate through our locations to find the location of your next house in West, Malvern for sale or to rent.
| Streets | Postcodes |
|---|---|
| Albion Road | WR14 1PU |
| Albion Walk | WR14 1PX |
| Archer Close | WR14 1PS |
| Belmont Road | WR14 1PB WR14 1PL WR14 1PN |
| Belvoir Bank | WR14 4LY |
| Blackheath Way | WR14 4DR |
| Blackmore Road | WR14 1QT WR14 1QX |
| Broadlands Drive | WR14 1PW |
| Brockhill Road | WR14 4DL |
| Cales Avenue | WR14 1PT |
| Camp Hill | WR14 4BZ |
| Chester Place | WR14 1RQ |
| Clayfield Drive | WR14 1RB |
| Cowleigh Bank | WR14 1PH WR14 1QP WR14 1QR |
| Cowleigh Park | WR13 5HJ WR13 5HL WR13 5HN |
| Cowleigh Road | WR14 1QD WR14 1QE WR14 1QF WR14 1QL WR14 1QN WR14 1QW WR14 1RD WR14 1TG |
| Croft Bank | WR14 4BW WR14 4DU |
| Croft Farm Drive | WR14 4DT |
| Damson Close | WR14 1SN |
| Danebury Park | WR14 1QA |
| De Walden Road | WR14 4BL WR14 4DF |
| Ebrington Road | WR14 4NL |
| Gibson Grove | WR14 1NX |
| Grafton Close | WR14 1PA |
| Harcourt Road | WR14 4DN WR14 4DW |
| Hawkwood Close | WR14 1QU |
| Henley Place | WR14 1PG |
| Hillview Drive | WR14 1RE |
| Hornyold Avenue | WR14 1QJ |
| Hornyold Road | WR14 1QH WR14 1QQ |
| Hospital Bank | WR14 1PQ |
| Howey Close | WR14 1WB |
| Lamb Bank | WR14 4NE |
| Larchfield Close | WR14 1RA |
| Leigh Sinton Road | WR14 1JL WR14 1JN WR14 1JW |
| Lower Dingle | WR14 4BQ |
| Lower Montpelier Road | WR14 4BT |
| Lower Road | WR14 4BX |
| Mathon Road | WR14 4BU |
| Montpelier Road | WR14 4BP WR14 4BS |
| Newtown Road | WR14 1NZ WR14 1PD WR14 1PE WR14 1PF WR14 1PJ |
| North Hill Gardens | WR14 4PT |
| North Malvern Road | WR14 4LR WR14 4LT WR14 4LX |
| Nursery Road | WR14 1QY |
| Old Hollow | WR14 4DY WR14 4NN WR14 4NP WR14 4NW WR14 4BY WR14 4NR |
| Park Road | WR14 4BH WR14 4BJ WR14 4DS |
| Pump Street | WR14 4LU |
| Queens Close | WR14 1SQ |
| Queens Road | WR14 1RG |
| Sayers Avenue | WR14 1PR |
| St James Crescent | WR14 4NH |
| St Peters Road | WR14 1QS |
| Tanglewood Heights | WR14 1GN |
| Trinity Bank | WR14 1QG |
| Uplands Drive | WR14 1FE |
| West Malvern Road | WR14 4AY WR14 4AZ WR14 4BA WR14 4BB WR14 4BD WR14 4BE WR14 4BG WR14 4DG WR14 4DH WR14 4NA WR14 4NB WR14 4ND WR14 4NF WR14 4NG WR14 4NJ WR14 4NQ |
| Westminster Bank | WR14 4BN |
| Woodbury Rise | WR14 1QZ |
Transport near West
- FAQ
- Price Paid By Year
- Property Type Price
Frequently asked questions about West
What is the average price for a property for sale in West?
The average price for a property for sale in West is £376,891. This amount is 8% higher than the average price in Malvern. There are 1,291 property listings for sale in West.
What streets have the most expensive properties for sale in West?
The streets with the most expensive properties for sale in West are Harcourt Road at an average of £1,350,000, North Hill Gardens at an average of £720,000 and Blackmore Road at an average of £620,000.
What streets have the most affordable properties for sale in West?
The streets with the most affordable properties for sale in West are Clayfield Drive at an average of £181,500, Belmont Road at an average of £199,983 and Trinity Bank at an average of £225,000.
Which train stations are available in or near West?
Some of the train stations available in or near West are Malvern Link, Great Malvern and Colwall.
Property Price Paid in West by Year
The average sold property price by year was:
| Year | Average Sold Price | Price Change |
Sold Properties
|
|---|---|---|---|
| 2025 | £316,906 | -20% |
56 Properties |
| 2024 | £378,876 | -15% |
69 Properties |
| 2023 | £436,560 | -5% |
54 Properties |
| 2022 | £458,925 | 20% |
81 Properties |
| 2021 | £368,444 | 10% |
80 Properties |
| 2020 | £332,983 | 11% |
75 Properties |
| 2019 | £296,707 | -2% |
76 Properties |
| 2018 | £302,506 | 16% |
65 Properties |
| 2017 | £252,832 | 9% |
73 Properties |
| 2016 | £230,215 | -14% |
90 Properties |
| 2015 | £261,542 | 16% |
86 Properties |
| 2014 | £220,528 | -9% |
75 Properties |
| 2013 | £240,959 | 9% |
53 Properties |
| 2012 | £218,080 | 5% |
70 Properties |
| 2011 | £207,993 | -21% |
62 Properties |
| 2010 | £251,684 | 6% |
61 Properties |
| 2009 | £237,024 | 2% |
58 Properties |
| 2008 | £232,092 | -13% |
57 Properties |
| 2007 | £262,964 | 14% |
94 Properties |
| 2006 | £224,901 | 3% |
97 Properties |
| 2005 | £218,098 | 11% |
79 Properties |
| 2004 | £194,844 | 7% |
114 Properties |
| 2003 | £180,920 | 11% |
98 Properties |
| 2002 | £160,236 | 25% |
96 Properties |
| 2001 | £120,603 | -1% |
81 Properties |
| 2000 | £122,210 | 22% |
93 Properties |
| 1999 | £95,282 | -3% |
124 Properties |
| 1998 | £97,921 | 22% |
94 Properties |
| 1997 | £76,169 | 11% |
101 Properties |
| 1996 | £67,417 | 6% |
87 Properties |
| 1995 | £63,402 | - |
55 Properties |
Property Price per Property Type in West
Here you can find historic sold price data in order to help with your property search.
The average Property Paid Price for specific property types in the last three years are:
| Property Type | Average Sold Price | Sold Properties |
|---|---|---|
| Semi Detached House | £380,309.00 | 67 Semi Detached Houses |
| Detached House | £499,597.00 | 59 Detached Houses |
| Terraced House | £243,925.00 | 40 Terraced Houses |
| Flat | £211,500.00 | 13 Flats |

