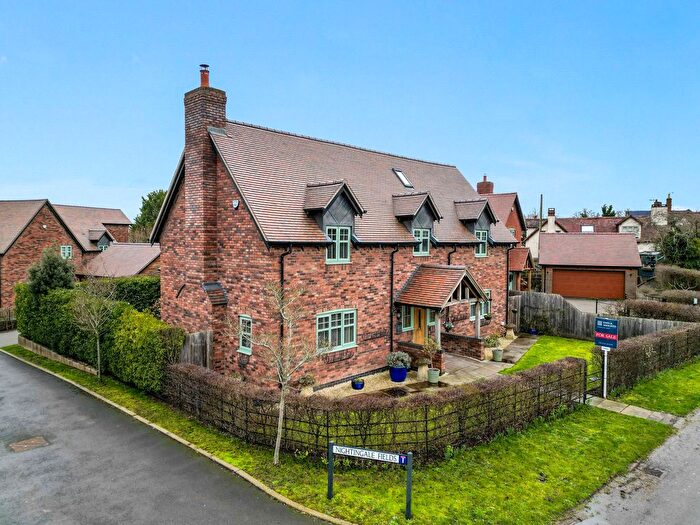
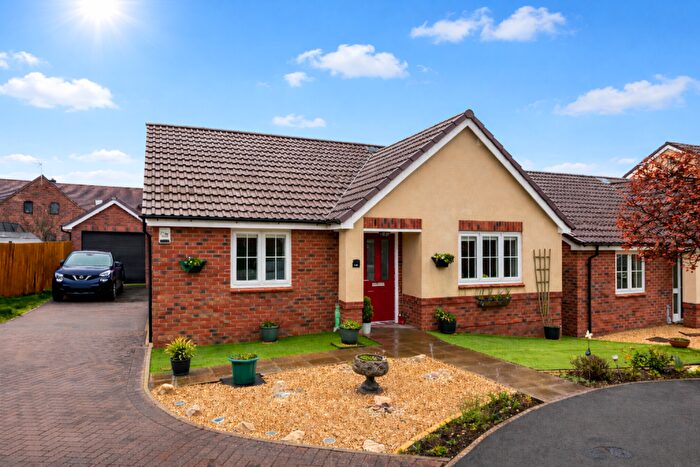
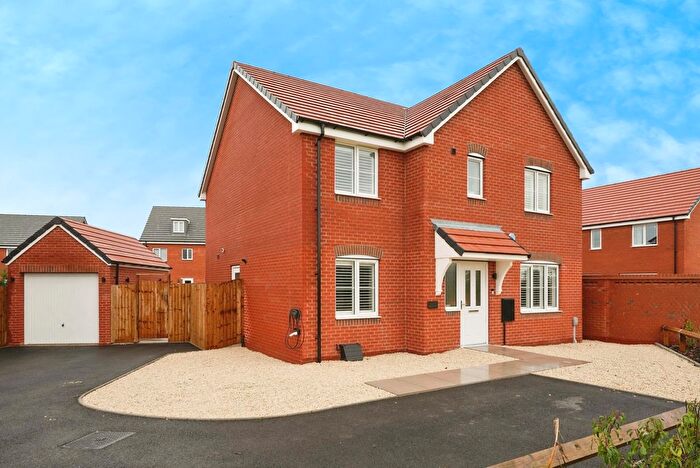
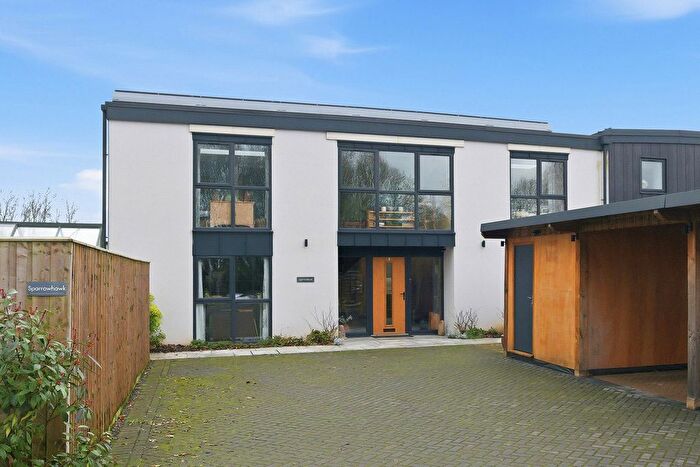
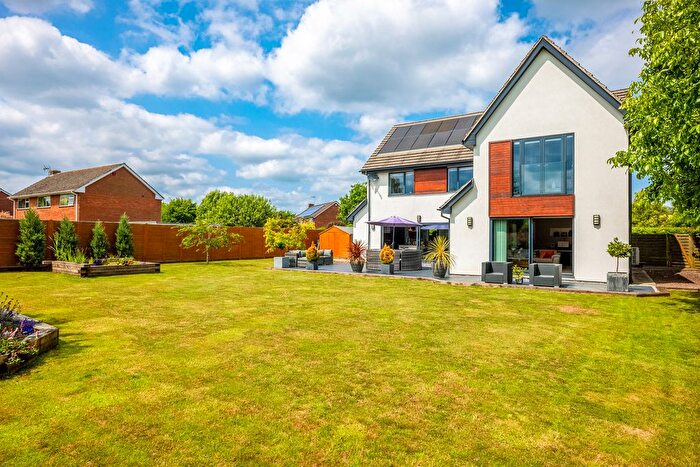
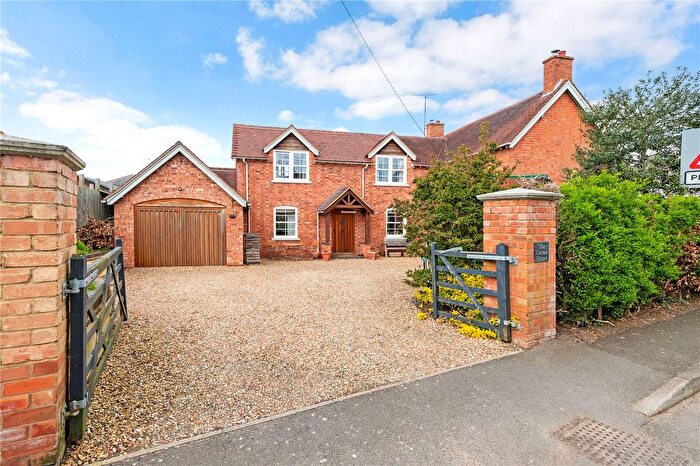
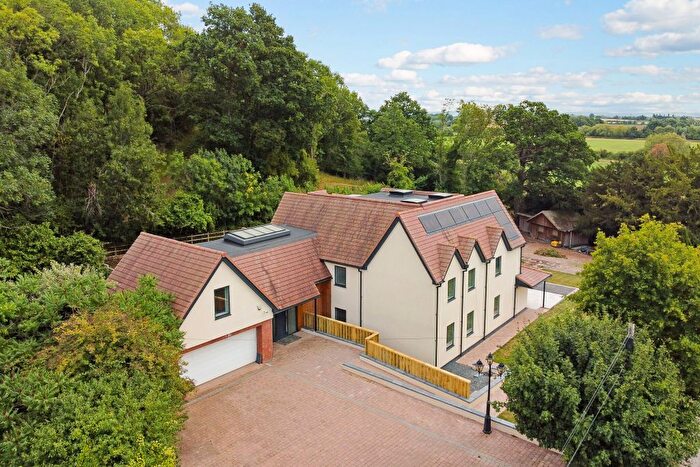
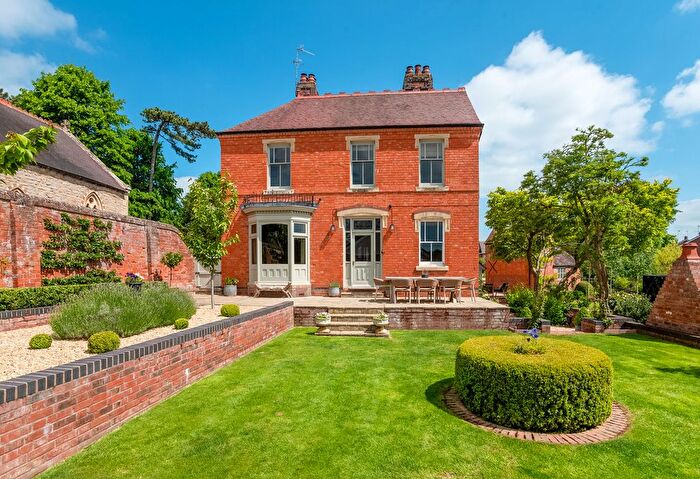
Houses for sale & to rent in Fladbury, Pershore
House Prices in Fladbury
Properties in Fladbury have an average house price of £478,108.00 and had 85 Property Transactions within the last 3 years¹.
Fladbury is an area in Pershore, Worcestershire with 1,061 households², where the most expensive property was sold for £1,400,000.00.
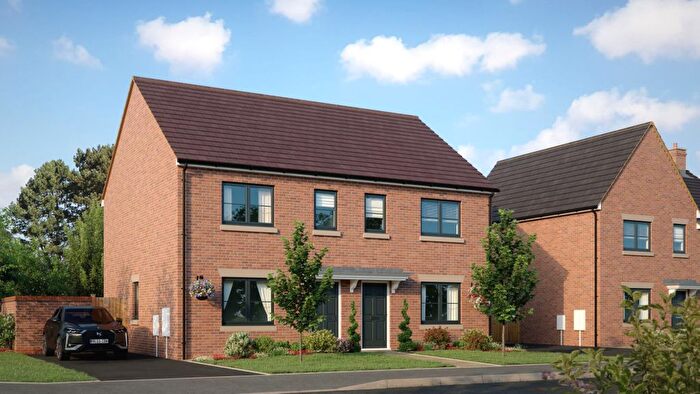
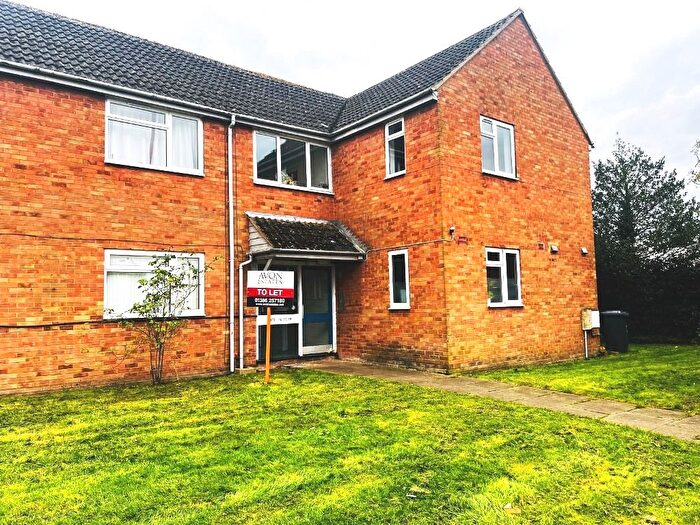
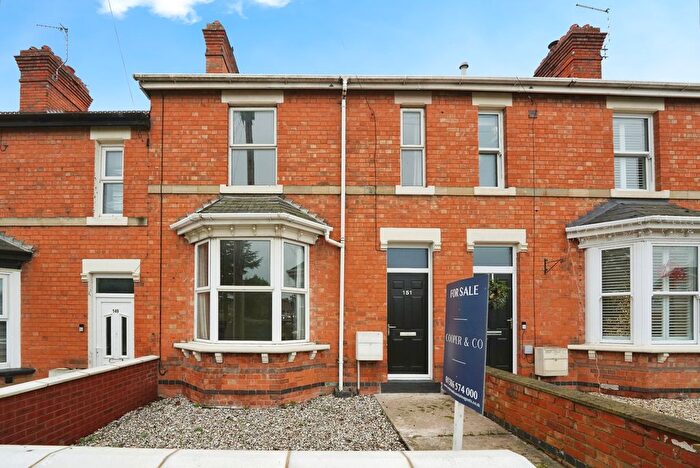
Properties for sale in Fladbury
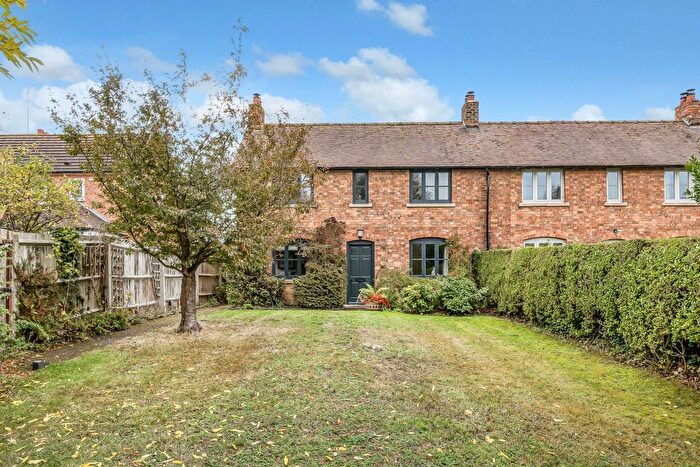
Previously listed properties in Fladbury
Roads and Postcodes in Fladbury
Navigate through our locations to find the location of your next house in Fladbury, Pershore for sale or to rent.
| Streets | Postcodes |
|---|---|
| Anchor Lane | WR10 2PY |
| Avon Bank | WR10 3JP |
| Blacksmiths Lane | WR10 3LX |
| Broadway Close | WR10 2QQ |
| Broadway Lane | WR10 2QF WR10 2QG |
| Brook Lane | WR10 3JX WR10 3LG WR10 3JY |
| Brook View | WR10 3LS |
| Butt Furlong | WR10 2QZ |
| Canada Bank | WR10 3LB |
| Chequers Lane | WR10 2PZ |
| Cherry Orchard | WR10 3LD |
| Church Street | WR10 2QB |
| Coach Drive | WR10 2QN |
| Cooks Hill | WR10 3PA |
| Evesham Road | WR10 2QR WR10 2QS WR10 2QT WR10 3JR |
| Farm Street | WR10 2QD |
| Fern Hill | WR10 3NQ |
| Field Barn Lane | WR10 3LY |
| Fladbury Villas | WR10 2QP |
| Kennel Bank | WR10 3ND |
| Lazy Lane | WR10 2QL |
| Llewellyn Close | WR10 2RR |
| Lower Croft | WR10 3NA |
| Lower End | WR10 3HL |
| Main Road | WR10 3NE |
| Main Street | WR10 3LT WR10 3LU WR10 3NB WR10 3NH WR10 3NU WR10 3NZ |
| Manor Farm Court | WR10 3PX |
| Merryfield | WR10 3LN |
| Middle Lane | WR10 3LZ |
| Neigh Lane | WR10 3NG |
| Old Rectory Green | WR10 2QX |
| Old Vicarage Gardens | WR10 3LR |
| Orchard Row | WR10 3NJ |
| Owletts Lane | WR10 3PB |
| Paynes Lane | WR10 2QH |
| Rutters Farm Court | WR10 3JN |
| Ruyhalls Place | WR10 3NX |
| Ryden Lane | WR10 3LH WR10 3LQ |
| Salters Lane | WR10 2PE |
| Sandys Close | WR10 2QE |
| School Cottages | WR10 3HJ |
| School Lane | WR10 3PD |
| Sheppey Corner | WR10 3BF |
| Sidings Lane | WR10 3LA |
| Smokey Lane | WR10 3NF |
| Station Road | WR10 2QW |
| The Bight | WR10 3LF |
| The Chantry | WR10 2QY |
| The Dovecote | WR10 3LL |
| The Green | WR10 2QA WR10 3LJ |
| The Hollies | WR10 3LP |
| The Lane | WR10 3HH |
| The Meadows | WR10 2RA |
| The Strand | WR10 3JZ |
| Timber Down | WR10 3NY |
| Timber Lane | WR10 3NW |
| Top Street | WR10 3LE |
| Townsend Cottages | WR10 2QJ |
| Weston Orchard | WR10 2QU |
| Wick House Close | WR10 3NT |
| Woodward Parks | WR10 2RB |
| Yock Lane | WR10 3NS |
| WR10 2NE WR10 3HQ WR10 3JT WR10 3JS WR10 2GY |
Transport near Fladbury
- FAQ
- Price Paid By Year
- Property Type Price
Frequently asked questions about Fladbury
What is the average price for a property for sale in Fladbury?
The average price for a property for sale in Fladbury is £478,108. This amount is 24% higher than the average price in Pershore. There are 247 property listings for sale in Fladbury.
What streets have the most expensive properties for sale in Fladbury?
The streets with the most expensive properties for sale in Fladbury are Yock Lane at an average of £1,250,000, Fladbury Villas at an average of £1,087,500 and Kennel Bank at an average of £725,000.
What streets have the most affordable properties for sale in Fladbury?
The streets with the most affordable properties for sale in Fladbury are Old Vicarage Gardens at an average of £165,000, Church Street at an average of £167,000 and Lower Croft at an average of £243,750.
Which train stations are available in or near Fladbury?
Some of the train stations available in or near Fladbury are Evesham, Pershore and Honeybourne.
Property Price Paid in Fladbury by Year
The average sold property price by year was:
| Year | Average Sold Price | Price Change |
Sold Properties
|
|---|---|---|---|
| 2025 | £419,432 | -36% |
26 Properties |
| 2024 | £570,303 | 22% |
28 Properties |
| 2023 | £444,048 | -5% |
31 Properties |
| 2022 | £465,320 | -6% |
39 Properties |
| 2021 | £491,568 | 24% |
52 Properties |
| 2020 | £372,000 | -4% |
23 Properties |
| 2019 | £387,032 | 8% |
26 Properties |
| 2018 | £356,929 | 0,3% |
36 Properties |
| 2017 | £355,800 | 0,1% |
52 Properties |
| 2016 | £355,565 | -3% |
59 Properties |
| 2015 | £366,816 | 8% |
39 Properties |
| 2014 | £338,944 | 22% |
42 Properties |
| 2013 | £262,861 | -3% |
28 Properties |
| 2012 | £270,732 | -12% |
26 Properties |
| 2011 | £302,670 | 3% |
29 Properties |
| 2010 | £292,933 | 5% |
24 Properties |
| 2009 | £278,136 | -25% |
22 Properties |
| 2008 | £347,017 | 11% |
14 Properties |
| 2007 | £308,922 | 6% |
36 Properties |
| 2006 | £289,475 | 3% |
46 Properties |
| 2005 | £280,094 | 1% |
38 Properties |
| 2004 | £276,107 | 5% |
33 Properties |
| 2003 | £263,054 | 40% |
54 Properties |
| 2002 | £156,666 | -20% |
52 Properties |
| 2001 | £188,289 | 9% |
47 Properties |
| 2000 | £171,069 | 23% |
42 Properties |
| 1999 | £132,145 | 14% |
46 Properties |
| 1998 | £113,768 | -5% |
40 Properties |
| 1997 | £119,386 | 8% |
49 Properties |
| 1996 | £110,019 | 13% |
46 Properties |
| 1995 | £96,120 | - |
47 Properties |
Property Price per Property Type in Fladbury
Here you can find historic sold price data in order to help with your property search.
The average Property Paid Price for specific property types in the last three years are:
| Property Type | Average Sold Price | Sold Properties |
|---|---|---|
| Semi Detached House | £369,990.00 | 22 Semi Detached Houses |
| Detached House | £593,884.00 | 48 Detached Houses |
| Terraced House | £266,200.00 | 15 Terraced Houses |

