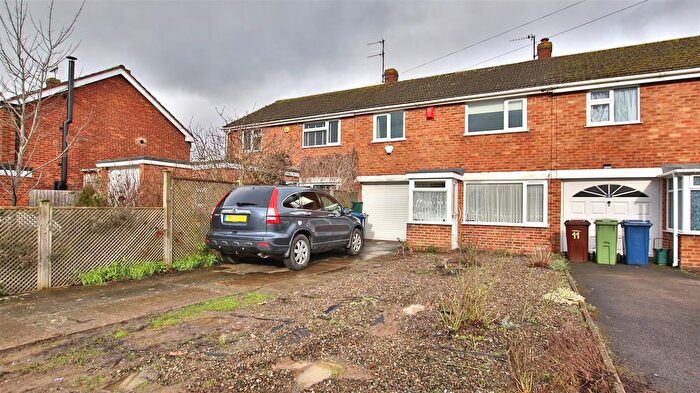
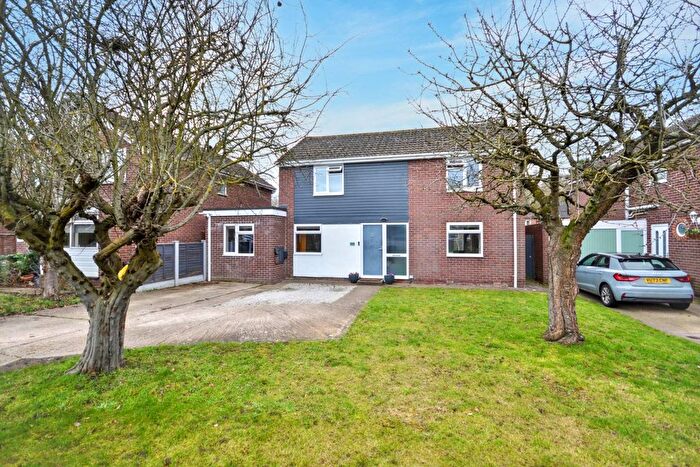
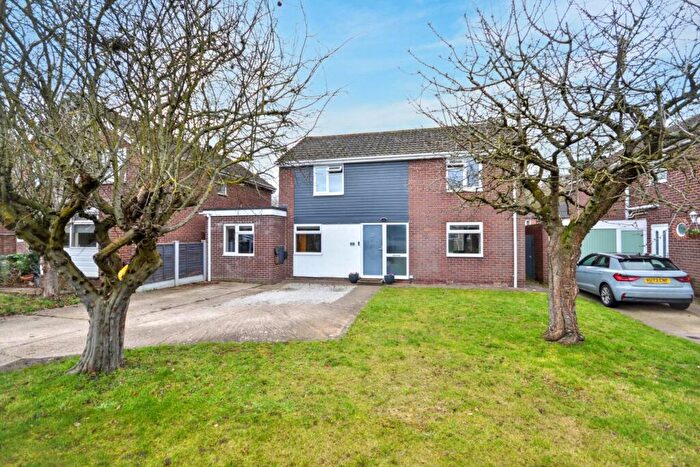
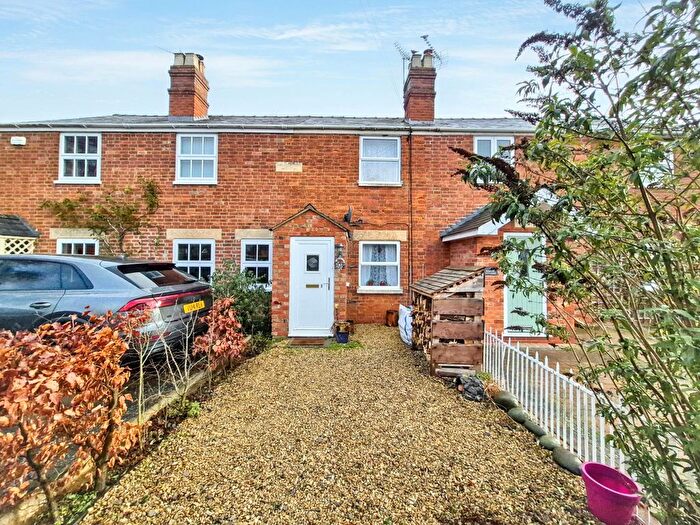
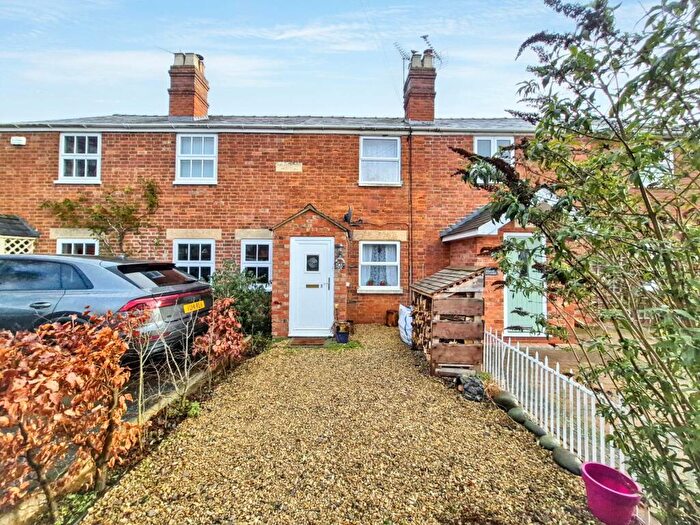
Houses for sale & to rent in Bredon, Tewkesbury
House Prices in Bredon
Properties in Bredon have an average house price of £441,039.00 and had 81 Property Transactions within the last 3 years¹.
Bredon is an area in Tewkesbury, Worcestershire with 1,067 households², where the most expensive property was sold for £1,460,000.00.
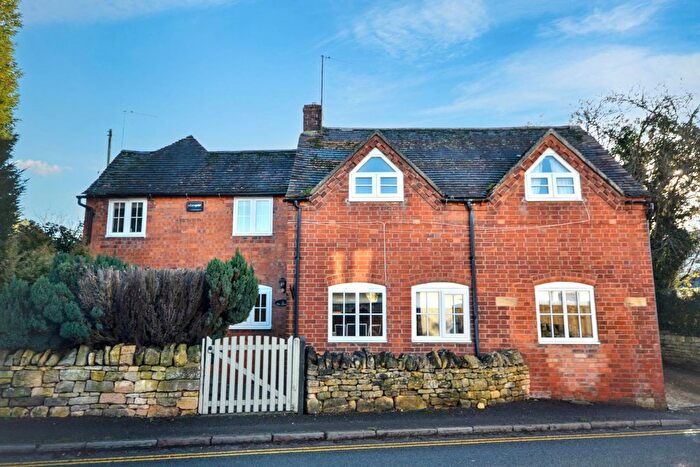
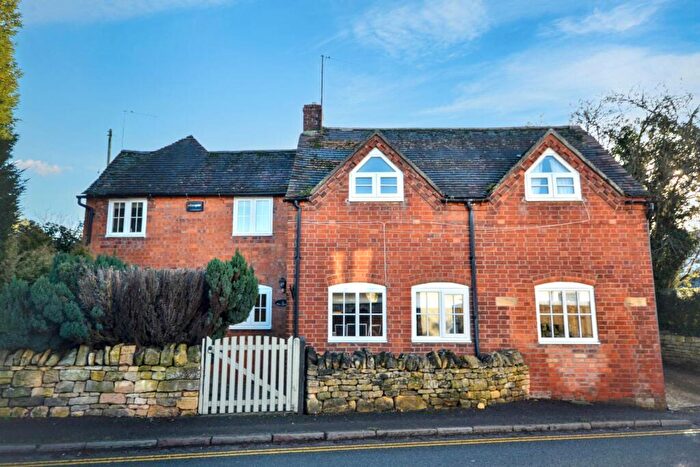
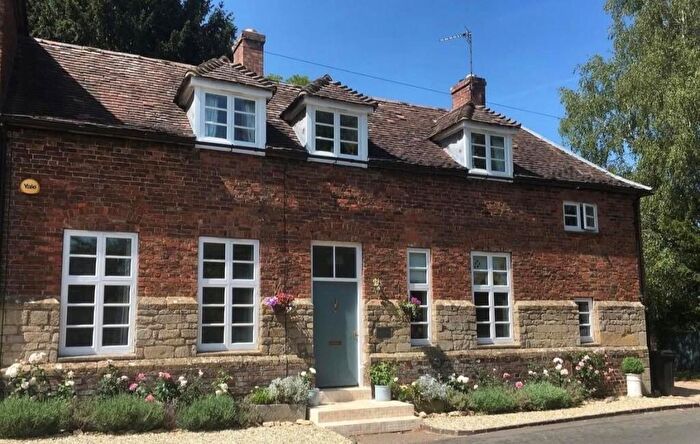
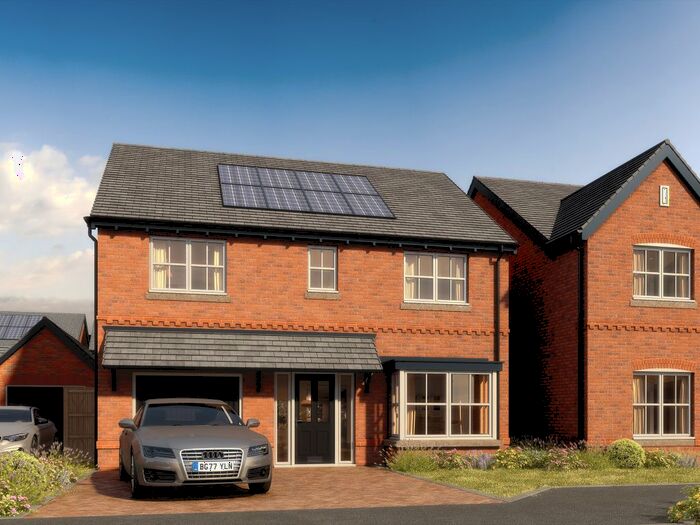
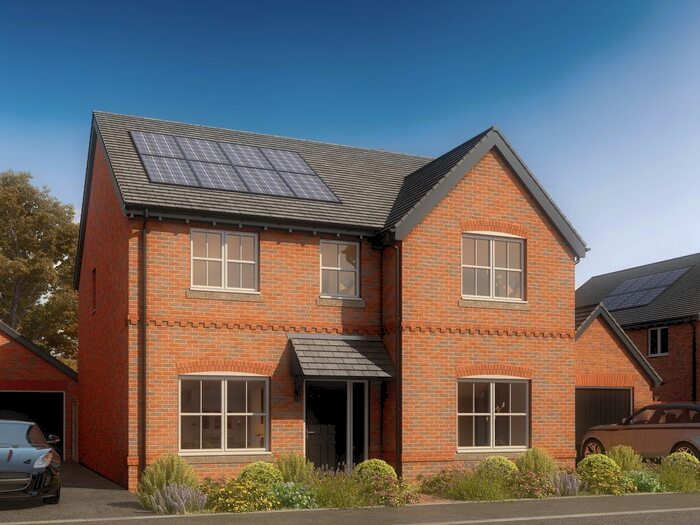
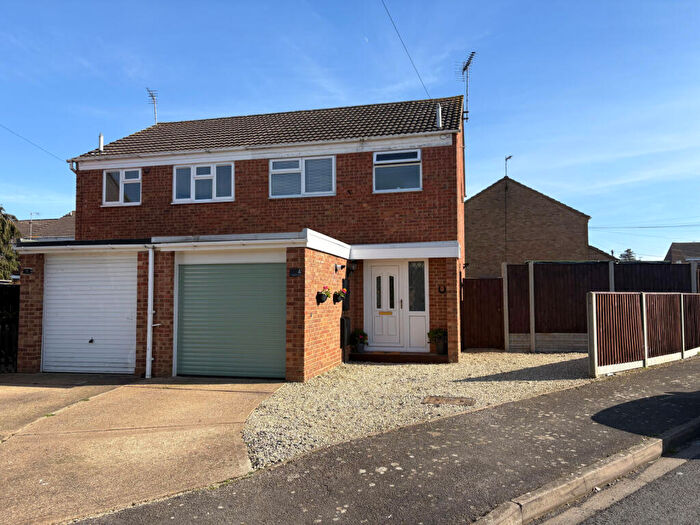
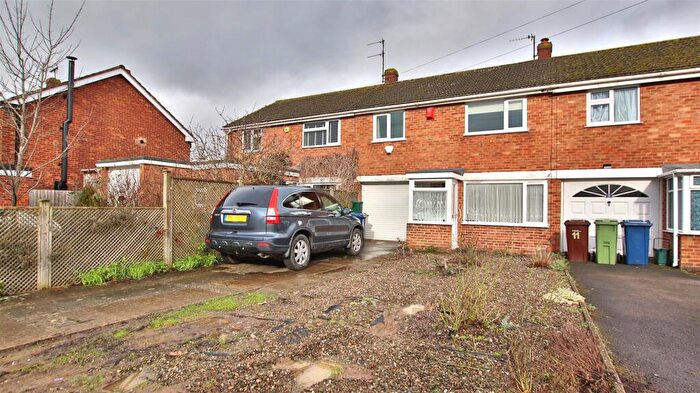
Properties for sale in Bredon
Roads and Postcodes in Bredon
Navigate through our locations to find the location of your next house in Bredon, Tewkesbury for sale or to rent.
| Streets | Postcodes |
|---|---|
| April Cottage | GL20 7EE |
| Back Lane | GL20 7LH |
| Blenheim Drive | GL20 7LY GL20 7NQ GL20 7QQ |
| Brasenose Road | GL20 7EJ |
| Bredon Lodge | GL20 7LP |
| Bredon Road | GL20 7EB |
| Brensham Court | GL20 7LX |
| Bricknell Avenue | GL20 7QH |
| Broadacre Close | GL20 7NW |
| Chapel Lane | GL20 8HR GL20 8HS |
| Cheltenham Road | GL20 7LZ GL20 7ND GL20 8GF |
| Cherry Orchard | GL20 7HJ |
| Church Street | GL20 7LA GL20 7LF GL20 7LL GL20 7LD |
| Church Walk | GL20 7FG |
| College Road | GL20 7EH |
| Cotswold Close | GL20 7QW |
| Dock Lane | GL20 7LG GL20 7LN |
| Eckington Road | GL20 7EX GL20 7EY GL20 7HD GL20 7HE WR10 3FB |
| Farm Lane | GL20 7HF |
| Fleet Lane | GL20 7EF |
| Glebeland Drive | GL20 7QF |
| Grange Field Road | GL20 7AZ |
| Gravel Pits Close | GL20 7QL |
| Homestead Close | GL20 7NN |
| Jubilee Drive | GL20 7QJ |
| Kemerton Road | GL20 7JS |
| Kinsham Close | GL20 8JQ |
| Lower Lane | GL20 7FB GL20 8HT |
| Main Road | GL20 7EG GL20 7EL GL20 7EN GL20 7LT GL20 7LW GL20 7QN |
| Malthouse Lane | GL20 7LE |
| Manor Lane | GL20 7HB |
| Mill End | GL20 7LQ |
| Oak Drive | GL20 7PN |
| Oak Gardens | GL20 7LS |
| Oak Lane | GL20 7LR |
| Oak Tree Place | GL20 7HG |
| Old Mansion Drive | GL20 7JZ |
| Orchard Close | GL20 7NH |
| Perwell Close | GL20 7LJ |
| Pippins Road | GL20 7NJ |
| Plantation Crescent | GL20 7QG |
| Queensmead | GL20 7NE GL20 7NF GL20 7NG |
| Russet Close | GL20 7QE |
| Saunders Cottage | GL20 8HP |
| St Giles Road | GL20 7EQ |
| Station Drive | GL20 7HH |
| Station Villas | GL20 7LU |
| The Croftlands | GL20 7NL |
| The Dell | GL20 7QP |
| Vallenders Road | GL20 7HL |
| Waterloo Close | GL20 7WL |
| Waterloo Way | GL20 7NA GL20 7UA |
| Watery Lane | GL20 8HU |
| Wellington Lodge Close | GL20 7PJ |
| Woodhull Close | GL20 7PW |
| GL20 7ED GL20 7EZ GL20 7HA |
Transport near Bredon
- FAQ
- Price Paid By Year
- Property Type Price
Frequently asked questions about Bredon
What is the average price for a property for sale in Bredon?
The average price for a property for sale in Bredon is £441,039. This amount is 9% lower than the average price in Tewkesbury. There are 578 property listings for sale in Bredon.
What streets have the most expensive properties for sale in Bredon?
The streets with the most expensive properties for sale in Bredon are Manor Lane at an average of £1,066,666, Kemerton Road at an average of £750,000 and Watery Lane at an average of £750,000.
What streets have the most affordable properties for sale in Bredon?
The streets with the most affordable properties for sale in Bredon are Bredon Lodge at an average of £249,642, Station Drive at an average of £270,000 and Plantation Crescent at an average of £281,323.
Which train stations are available in or near Bredon?
Some of the train stations available in or near Bredon are Ashchurch, Pershore and Evesham.
Property Price Paid in Bredon by Year
The average sold property price by year was:
| Year | Average Sold Price | Price Change |
Sold Properties
|
|---|---|---|---|
| 2025 | £365,368 | -41% |
22 Properties |
| 2024 | £514,396 | 19% |
32 Properties |
| 2023 | £415,755 | -17% |
27 Properties |
| 2022 | £487,046 | 14% |
34 Properties |
| 2021 | £418,003 | 13% |
55 Properties |
| 2020 | £364,927 | 8% |
35 Properties |
| 2019 | £335,306 | -7% |
44 Properties |
| 2018 | £357,750 | 5% |
54 Properties |
| 2017 | £341,580 | 1% |
36 Properties |
| 2016 | £336,602 | 18% |
48 Properties |
| 2015 | £275,262 | -11% |
39 Properties |
| 2014 | £305,345 | 4% |
49 Properties |
| 2013 | £292,664 | 3% |
45 Properties |
| 2012 | £283,650 | 12% |
53 Properties |
| 2011 | £248,300 | -24% |
35 Properties |
| 2010 | £306,892 | 4% |
40 Properties |
| 2009 | £293,766 | 13% |
31 Properties |
| 2008 | £255,315 | -26% |
46 Properties |
| 2007 | £322,284 | 10% |
46 Properties |
| 2006 | £290,298 | 12% |
55 Properties |
| 2005 | £255,315 | -4% |
52 Properties |
| 2004 | £265,863 | 14% |
58 Properties |
| 2003 | £229,959 | 10% |
52 Properties |
| 2002 | £206,675 | 14% |
53 Properties |
| 2001 | £177,646 | 29% |
45 Properties |
| 2000 | £126,801 | -11% |
41 Properties |
| 1999 | £140,212 | 25% |
43 Properties |
| 1998 | £104,662 | -14% |
47 Properties |
| 1997 | £118,884 | 15% |
53 Properties |
| 1996 | £100,876 | 9% |
58 Properties |
| 1995 | £91,858 | - |
56 Properties |
Property Price per Property Type in Bredon
Here you can find historic sold price data in order to help with your property search.
The average Property Paid Price for specific property types in the last three years are:
| Property Type | Average Sold Price | Sold Properties |
|---|---|---|
| Semi Detached House | £330,908.00 | 23 Semi Detached Houses |
| Detached House | £565,042.00 | 43 Detached Houses |
| Terraced House | £254,433.00 | 15 Terraced Houses |

