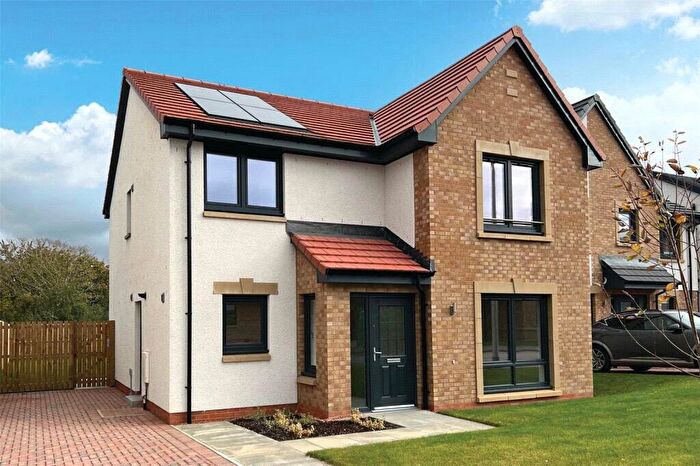
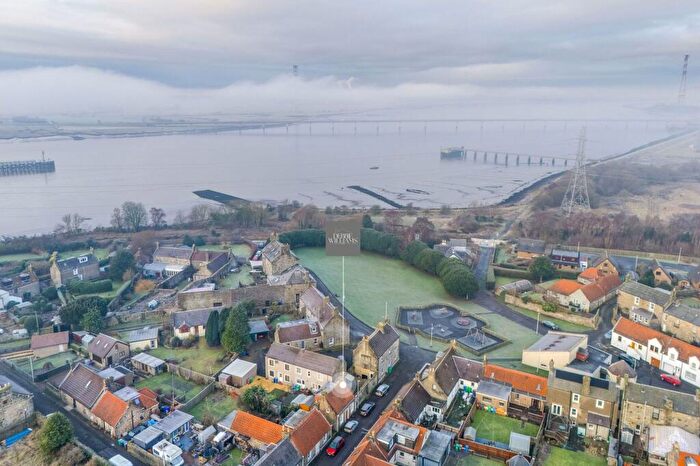
Houses for sale & to rent in Clackmannanshire East, Clackmannan
House Prices in Clackmannanshire East
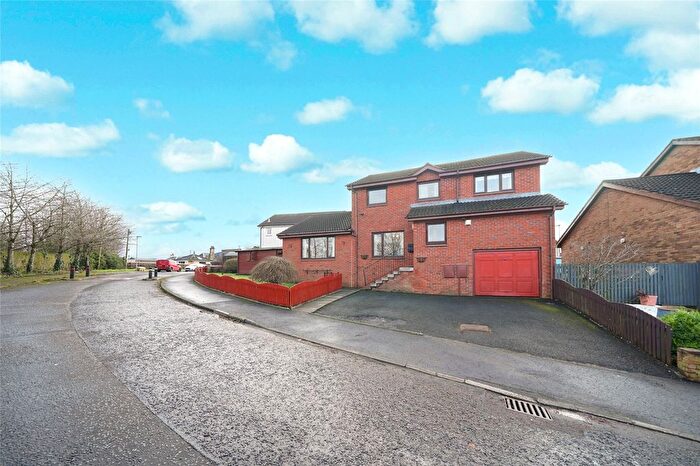
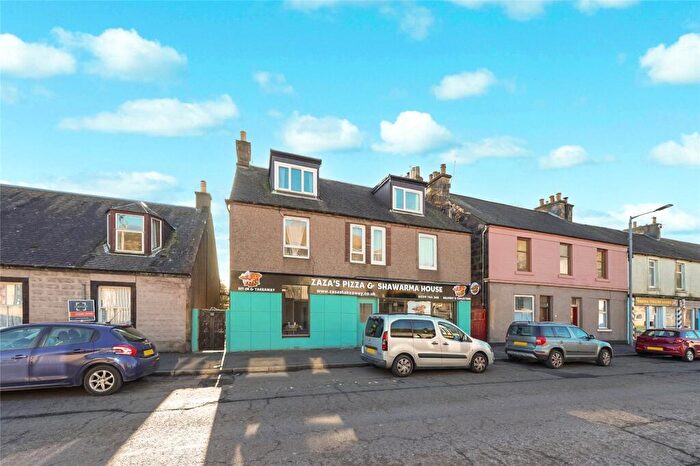
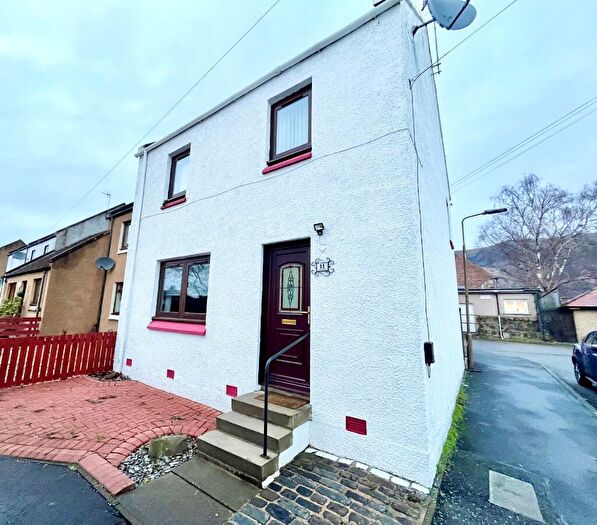
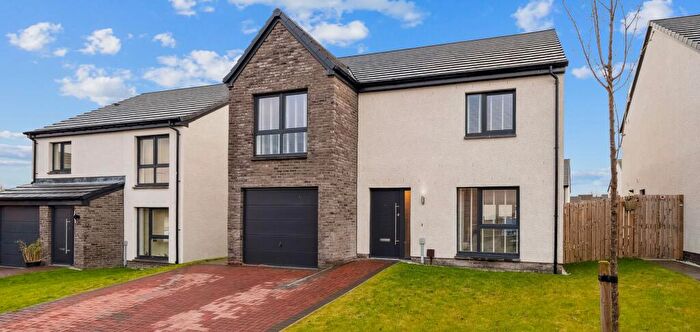
Properties in Clackmannanshire East have an average house price of £173,571.00 and had 120 Property Transactions within the last 3 years¹.
Clackmannanshire East is an area in Clackmannan, Clackmannanshire with 1,878 households², where the most expensive property was sold for £360,000.00.
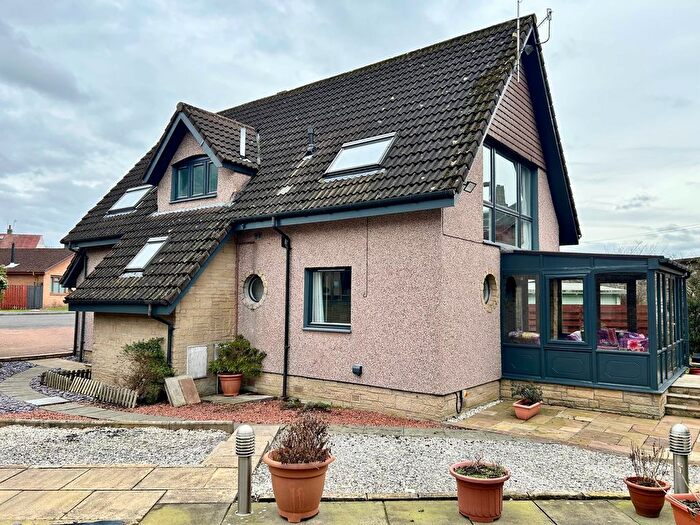
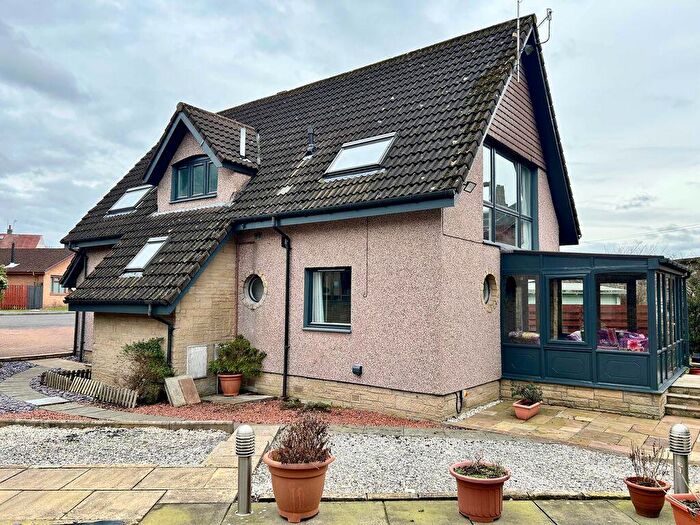
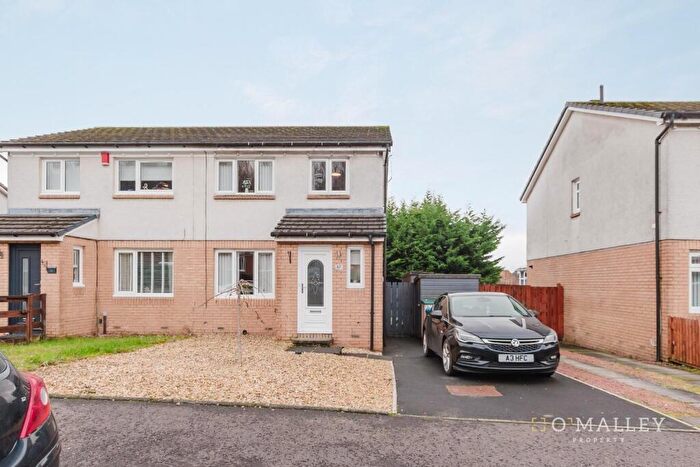
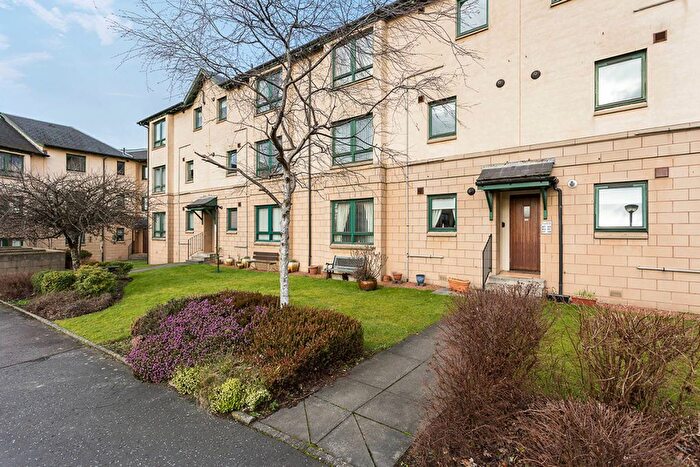
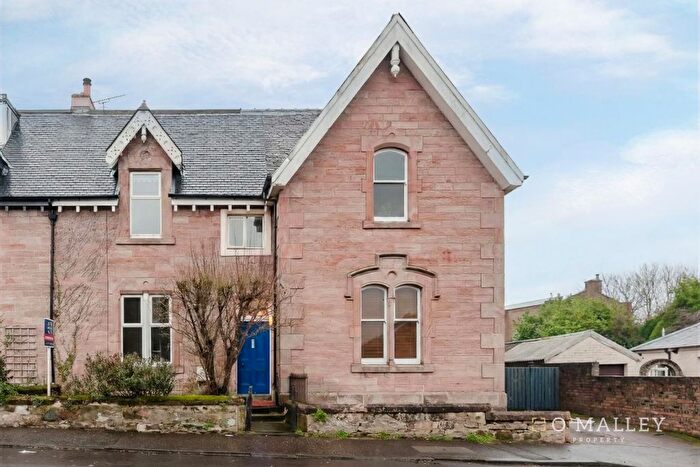
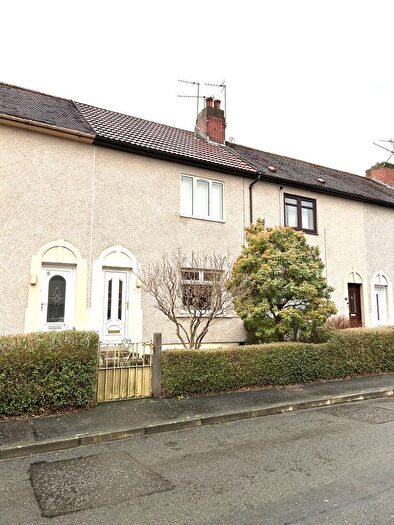
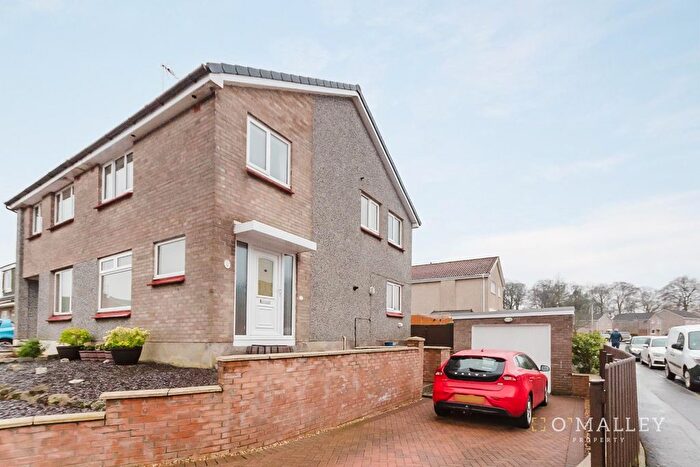
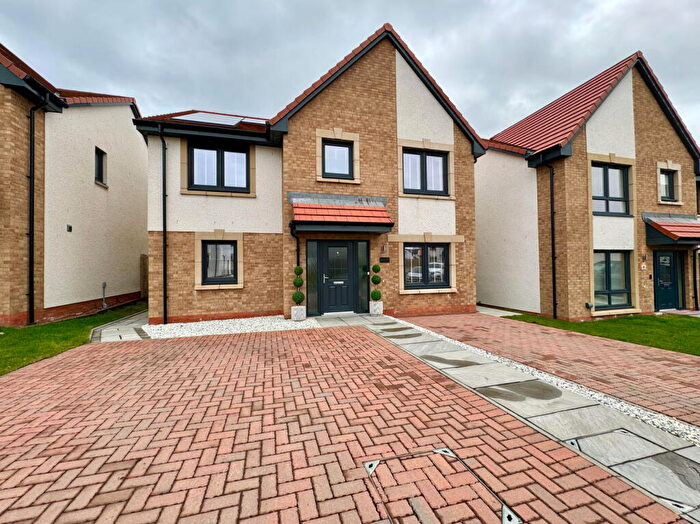
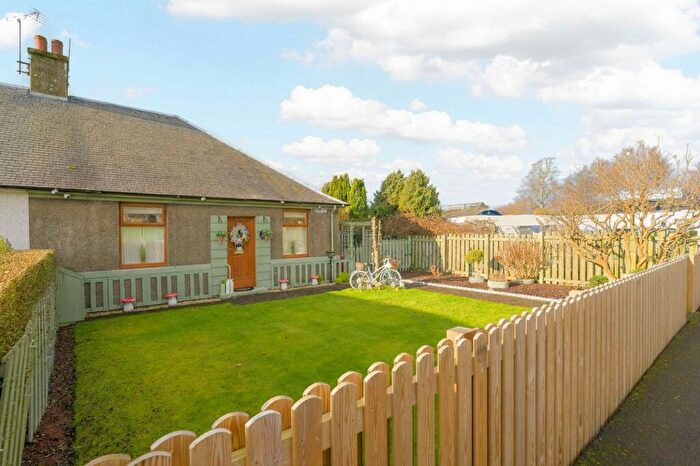
Properties for sale in Clackmannanshire East
Roads and Postcodes in Clackmannanshire East
Navigate through our locations to find the location of your next house in Clackmannanshire East, Clackmannan for sale or to rent.
| Streets | Postcodes |
|---|---|
| Alexander Court | FK10 4HN |
| Alloa Park | FK10 4DF |
| Alloa Park Drive | FK10 1AR FK10 1QX FK10 1QY |
| Alloa Road | FK10 4EX FK10 4EY FK10 4HD FK10 4HG FK10 4HH |
| Backwood Court | FK10 4HS |
| Bruce Street | FK10 4JT |
| Brucefield Crescent | FK10 4DE |
| Burnside Crescent | FK10 4HL |
| Castle Street | FK10 4EJ FK10 4EW |
| Castle Terrace | FK10 4EP |
| Chapelhill | FK10 4JP |
| Cherryton Drive | FK10 4RA |
| Clackmannan Road | FK10 4DA |
| Craigrie Road | FK10 4DQ |
| Craigrie Terrace | FK10 4ER |
| Devonway | FK10 4LD FK10 4LE FK10 4LF |
| Duke Street | FK10 4EF |
| Dundas Crescent | FK10 4HB |
| Dunlin Drive | FK10 1SH |
| Erskine Place | FK10 4HT |
| Forth Crescent | FK10 1QR |
| Garden Place | FK10 4JX |
| Garden Terrace | FK10 4JU |
| Hetherington Drive | FK10 4HQ |
| High Street | FK10 4JG |
| Hiltonhawk Way | FK10 1RQ |
| Izatt Terrace | FK10 4HA |
| Kennet Village | FK10 4DP |
| Kersegreen Road | FK10 4HR |
| Kirk Brae | FK10 4JW |
| Kirk Wynd | FK10 4JF |
| Ladywell Grove | FK10 4JQ |
| Laird's Drive | FK10 4EQ |
| Lapwing Place | FK10 1SJ |
| Laurie Place | FK10 3QH |
| Livingstone Way | FK10 4HX |
| Lochies Road | FK10 4EL FK10 4EN FK10 4JS |
| Look Aboot Ye Brae | FK10 4LQ |
| Main Street | FK10 4JA FK10 4JB |
| Mannan Drive | FK10 4ST FK10 4SU |
| Manse Terrace | FK10 4JZ |
| Mar Terrace | FK10 4JE |
| Marquis Drive | FK10 4EZ |
| Mary Place | FK10 4LA FK10 4LB |
| Mayfield Crescent | FK10 4HP |
| Meadow Grove | FK10 4DD |
| Mercat Place | FK10 4SS |
| Michael Bruce Court | FK10 3QB |
| Mill Road | FK10 4HJ |
| Millbank Crescent | FK10 4SQ |
| Millburn Gardens | FK10 4AD |
| North Street | FK10 4JD |
| Northfield Gardens | FK10 4DG |
| Park Place | FK10 4HE |
| Parklands Place | FK10 3QJ |
| Pennyschool Place | FK10 4JY |
| Port Street | FK10 4JH FK10 4JN |
| Sandpiper Meadow | FK10 1QQ FK10 1QU |
| South Pilmuir Road | FK10 4ET FK10 4EU FK10 4JR |
| St Serfs Grove | FK10 4SP FK10 4SR |
| Tern Crescent | FK10 1SG |
| The Cormorant | FK10 1RL |
| The Glebe | FK10 4JJ |
| The Pheasantry | FK10 1PH |
| Tower Place | FK10 4HW |
| Villa Place | FK10 4HZ |
| Woodside Terrace | FK10 4HU |
| Zetland Street | FK10 4ES |
| FK10 1PG FK10 1PQ FK10 1QW FK10 1QZ FK10 1RE FK10 1RF FK10 1RJ FK10 1RN FK10 3PS FK10 3PU FK10 3PY FK10 3PZ FK10 3QA FK10 3QF FK10 3QG FK10 3QL FK10 3QP FK10 3QW FK10 4BP FK10 4BW FK10 4DH FK10 4DJ FK10 4DL FK10 4DN FK10 4DR FK10 4DW FK10 4DY FK10 4EH FK10 4HF FK10 4JL FK10 4LG FK10 4SX |
Transport near Clackmannanshire East
-
Alloa Station
-
Larbert Station
-
Stirling Station
-
Falkirk Grahamston Station
-
Camelon Station
-
Falkirk High Station
-
Polmont Station
-
Bridge Of Allan Station
-
Dunblane Station
- FAQ
- Price Paid By Year
Frequently asked questions about Clackmannanshire East
What is the average price for a property for sale in Clackmannanshire East?
The average price for a property for sale in Clackmannanshire East is £173,571. This amount is 12% higher than the average price in Clackmannan. There are 2,117 property listings for sale in Clackmannanshire East.
What streets have the most expensive properties for sale in Clackmannanshire East?
The streets with the most expensive properties for sale in Clackmannanshire East are Tern Crescent at an average of £307,500, Sandpiper Meadow at an average of £302,912 and Dunlin Drive at an average of £300,000.
What streets have the most affordable properties for sale in Clackmannanshire East?
The streets with the most affordable properties for sale in Clackmannanshire East are Castle Street at an average of £59,000, Main Street at an average of £59,916 and Manse Terrace at an average of £67,400.
Which train stations are available in or near Clackmannanshire East?
Some of the train stations available in or near Clackmannanshire East are Alloa, Larbert and Stirling.
Property Price Paid in Clackmannanshire East by Year
The average sold property price by year was:
| Year | Average Sold Price | Price Change |
Sold Properties
|
|---|---|---|---|
| 2025 | £193,786 | 3% |
30 Properties |
| 2024 | £187,763 | 19% |
37 Properties |
| 2023 | £152,221 | -28% |
53 Properties |
| 2022 | £195,078 | 6% |
95 Properties |
| 2021 | £184,167 | 5% |
100 Properties |
| 2020 | £174,391 | 2% |
103 Properties |
| 2019 | £170,111 | 7% |
93 Properties |
| 2018 | £158,852 | 1% |
110 Properties |
| 2017 | £156,515 | 2% |
86 Properties |
| 2016 | £153,541 | 9% |
88 Properties |
| 2015 | £139,565 | -1% |
82 Properties |
| 2014 | £140,942 | 10% |
71 Properties |
| 2013 | £126,629 | 1% |
74 Properties |
| 2012 | £125,562 | -7% |
50 Properties |
| 2011 | £133,887 | -6% |
58 Properties |
| 2010 | £141,789 | 2% |
74 Properties |
| 2009 | £138,819 | -3% |
52 Properties |
| 2008 | £143,405 | -5% |
82 Properties |
| 2007 | £150,405 | 27% |
111 Properties |
| 2006 | £110,398 | 24% |
130 Properties |
| 2005 | £83,413 | -16% |
113 Properties |
| 2004 | £96,887 | 53% |
85 Properties |
| 2003 | £45,647 | -7% |
89 Properties |
| 2002 | £49,060 | 6% |
90 Properties |
| 2001 | £45,914 | - |
11 Properties |

