
Houses for sale & to rent in Cumnock, East Ayrshire
House Prices in Cumnock
Properties in Cumnock have an average house price of £107k and had 560 Property Transactions within the last 3 years.¹
Cumnock is an area in East Ayrshire with 9,426 households², where the most expensive property was sold for £570k.
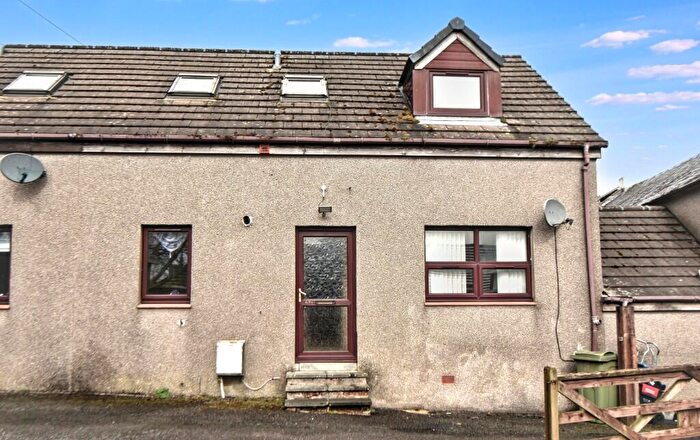
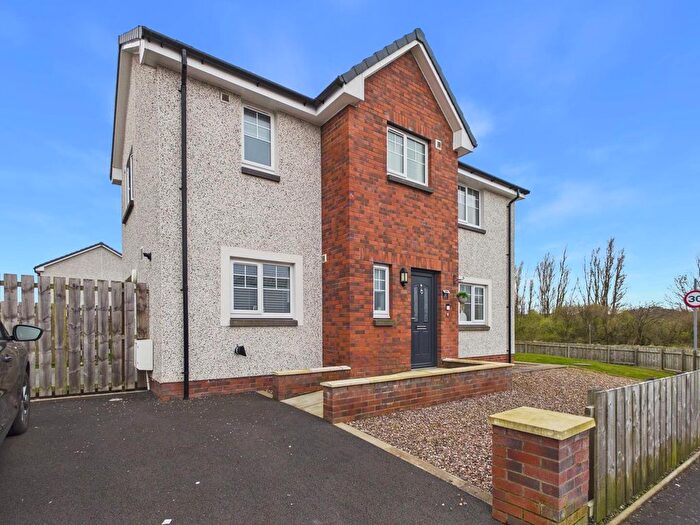
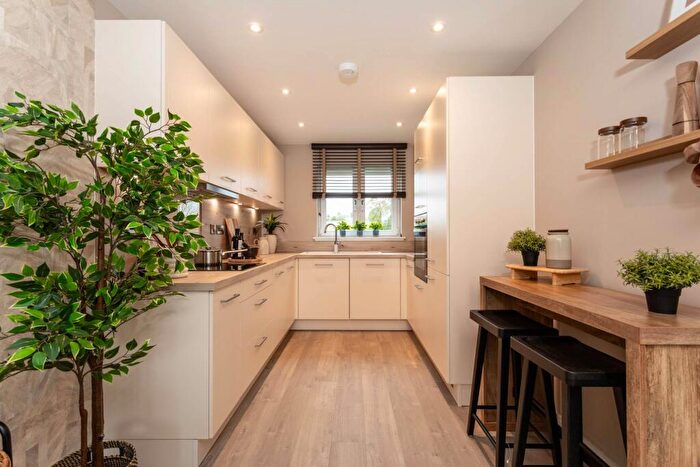
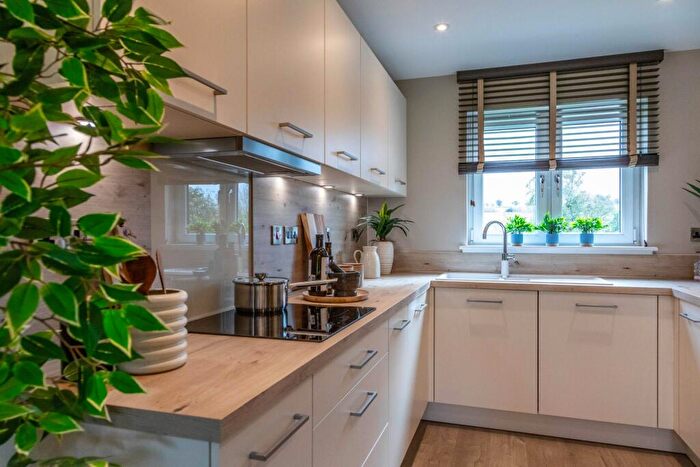
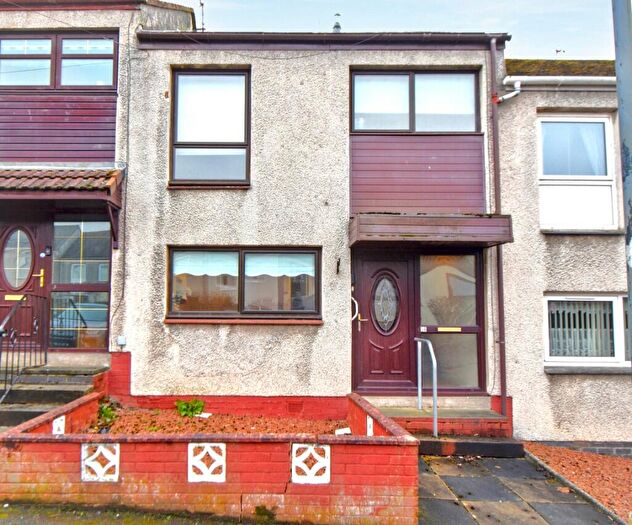
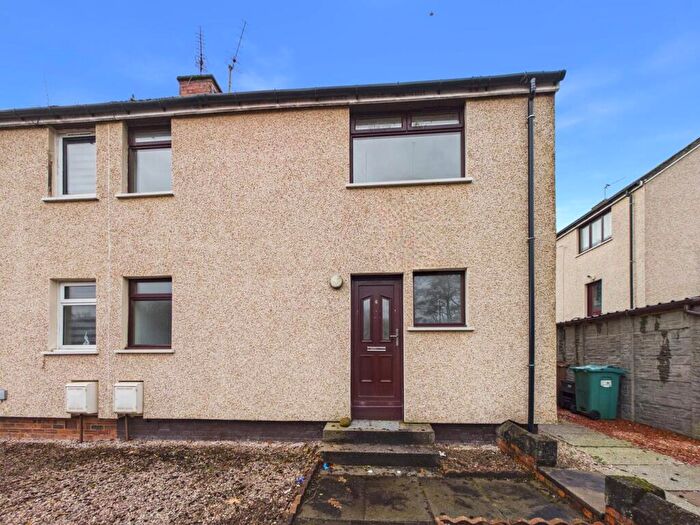
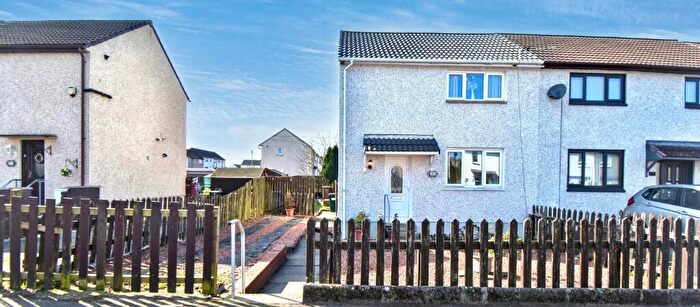
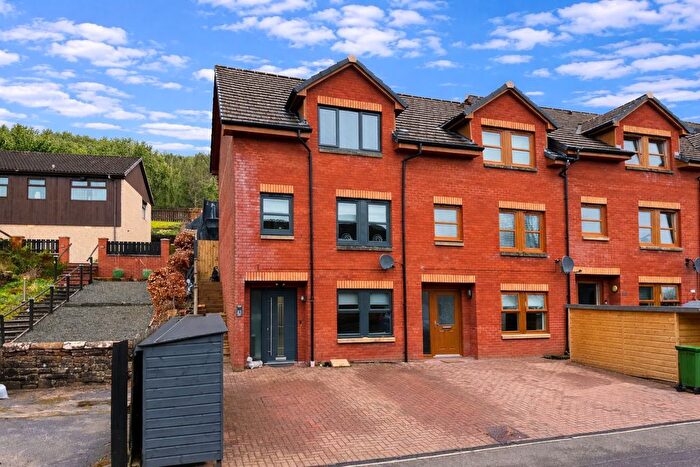
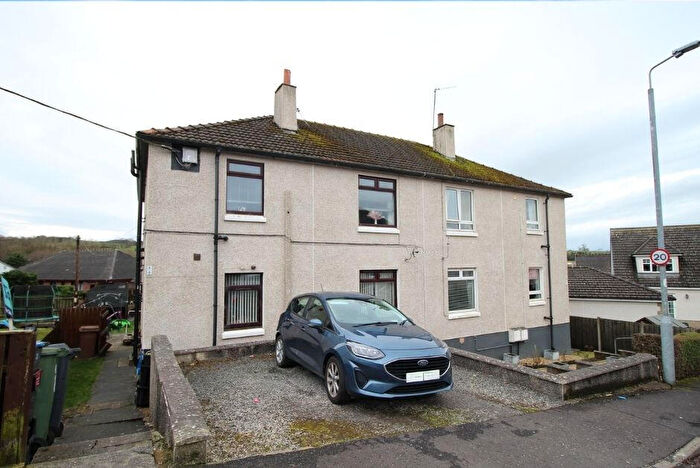
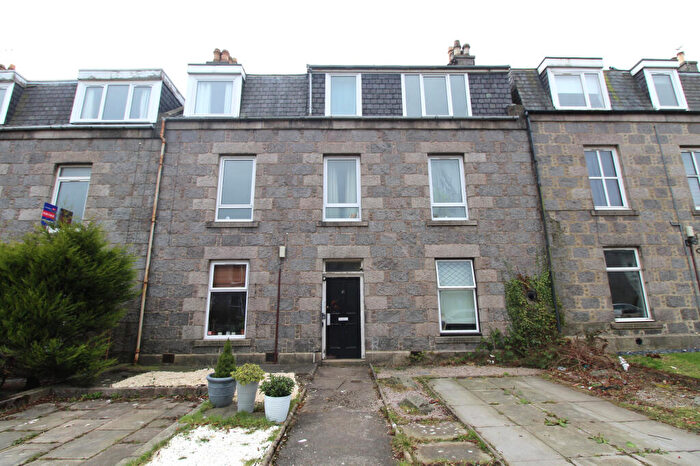
Properties for sale in Cumnock
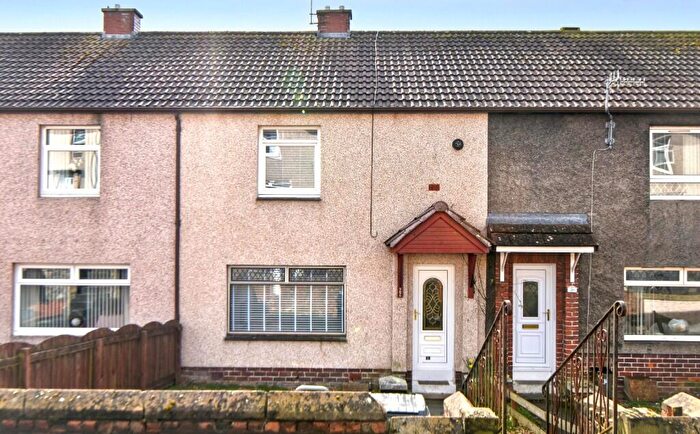
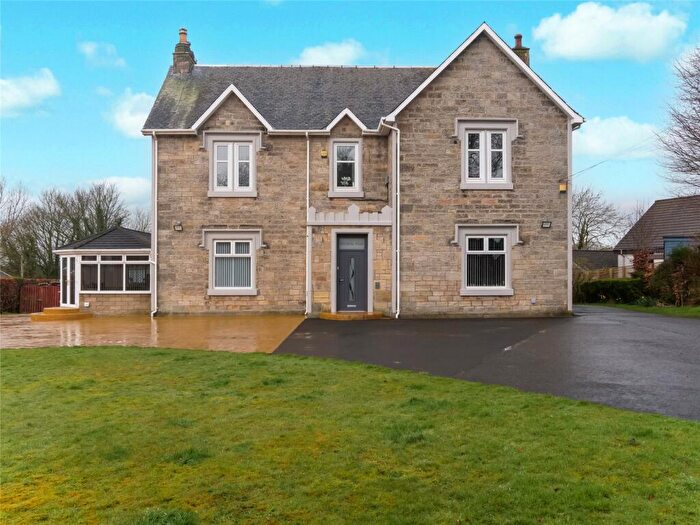
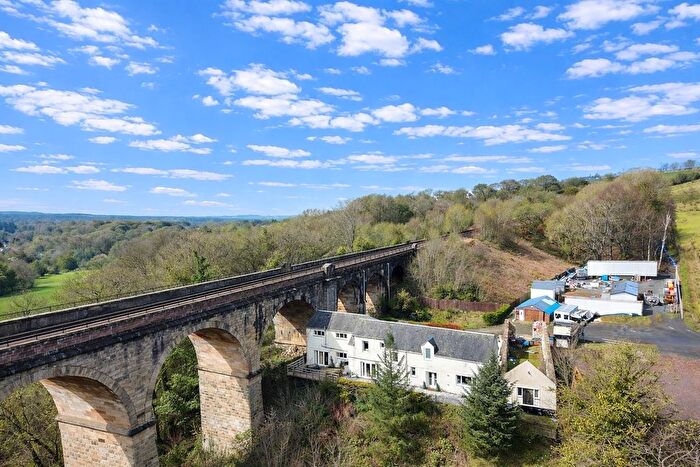
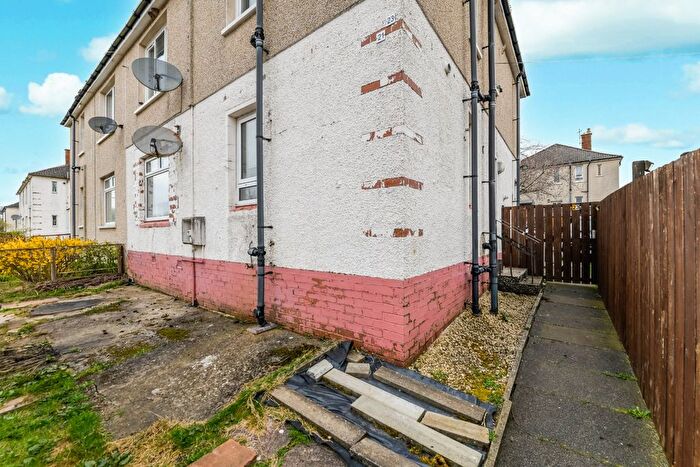
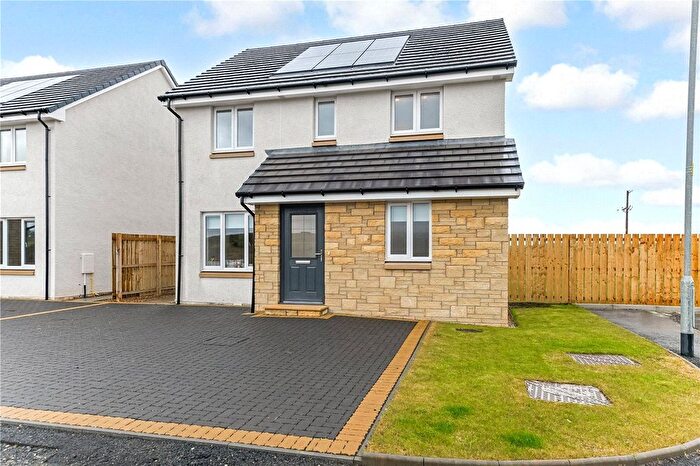
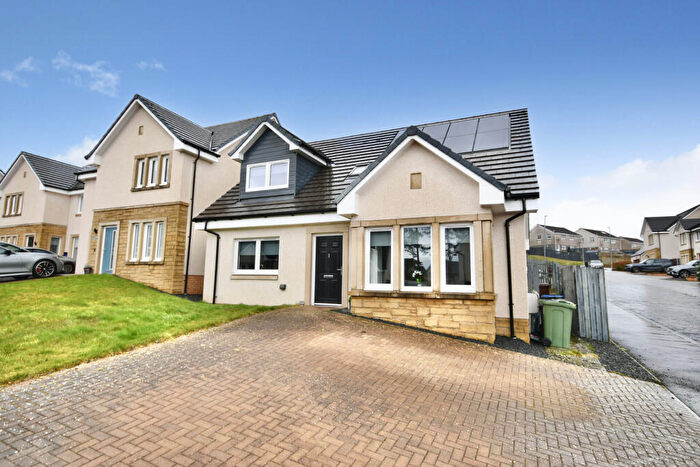
![]()
If you are looking to sell your house, let it out, or receive a property valuation, an expert can help you.
Click the button below to get started.


Neighbourhoods in Cumnock
Navigate through our locations to find the location of your next house in Cumnock, East Ayrshire for sale or to rent.
Transport in Cumnock
Please see below transportation links in this area:

- FAQ
- Price Paid By Year
Frequently asked questions about Cumnock
What is the average price for a property for sale in Cumnock?
The average price for a property for sale in Cumnock is £107,318. This amount is 20% lower than the average price in East Ayrshire. There are 3,189 property listings for sale in Cumnock.
What locations have the most expensive properties for sale in Cumnock?
The location with the most expensive properties for sale in Cumnock is Cumnock and New Cumnock at an average of £114,686.
What locations have the most affordable properties for sale in Cumnock?
The location with the most affordable properties for sale in Cumnock is Ballochmyle at an average of £90,699.
Which train stations are available in or near Cumnock?
Some of the train stations available in or near Cumnock are Auchinleck, New Cumnock and Kirkconnel.
Property Price Paid in Cumnock by Year
The average sold property price by year was:
| Year | Average Sold Price | Price Change |
Sold Properties
|
|---|---|---|---|
| 2025 | £107,135 | 4% |
179 Properties |
| 2024 | £103,032 | -7% |
165 Properties |
| 2023 | £110,744 | -18% |
216 Properties |
| 2022 | £130,533 | 13% |
324 Properties |
| 2021 | £113,011 | 3% |
423 Properties |
| 2020 | £109,950 | 4% |
280 Properties |
| 2019 | £105,517 | 2% |
361 Properties |
| 2018 | £103,529 | 13% |
296 Properties |
| 2017 | £89,557 | 2% |
295 Properties |
| 2016 | £88,034 | -2% |
243 Properties |
| 2015 | £89,548 | 17% |
249 Properties |
| 2014 | £74,676 | -8% |
262 Properties |
| 2013 | £80,656 | -8% |
198 Properties |
| 2012 | £87,117 | -18% |
166 Properties |
| 2011 | £102,646 | 5% |
190 Properties |
| 2010 | £97,084 | 21% |
217 Properties |
| 2009 | £76,924 | -14% |
221 Properties |
| 2008 | £87,571 | 1% |
402 Properties |
| 2007 | £87,076 | 2% |
472 Properties |
| 2006 | £85,016 | 17% |
468 Properties |
| 2005 | £70,204 | 18% |
478 Properties |
| 2004 | £57,910 | 27% |
390 Properties |
| 2003 | £42,108 | 10% |
437 Properties |
| 2002 | £37,882 | -1% |
459 Properties |
| 2001 | £38,316 | - |
38 Properties |