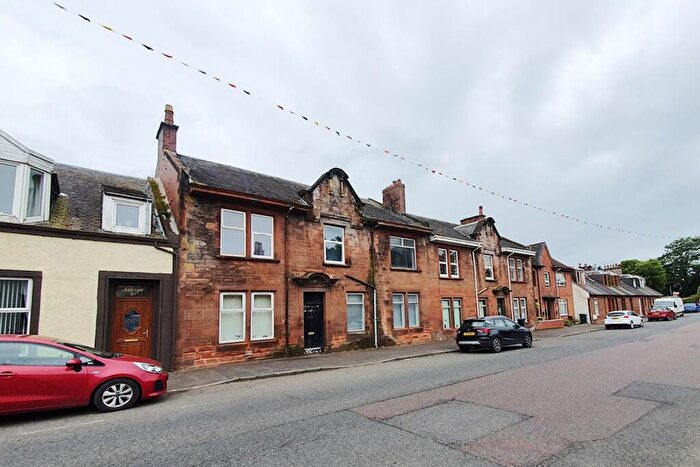
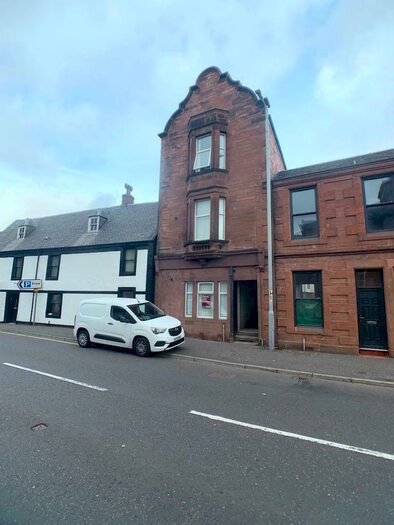
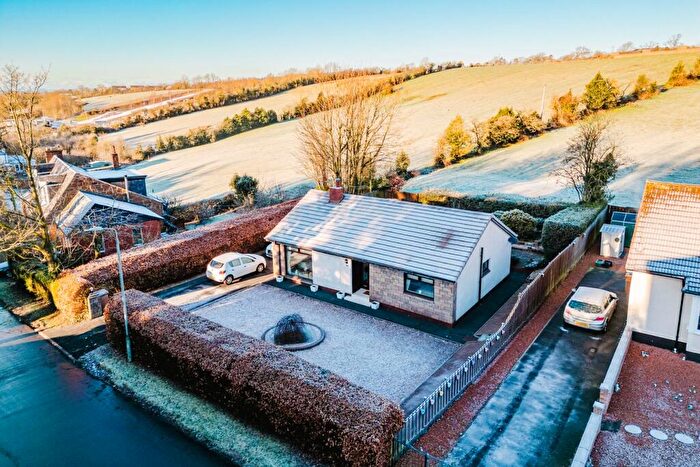
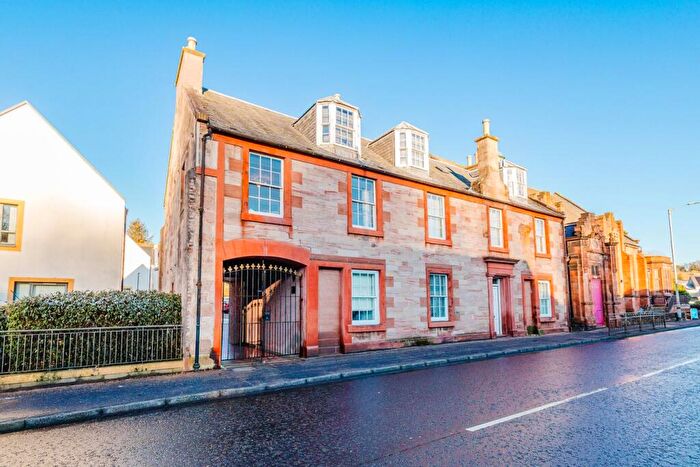
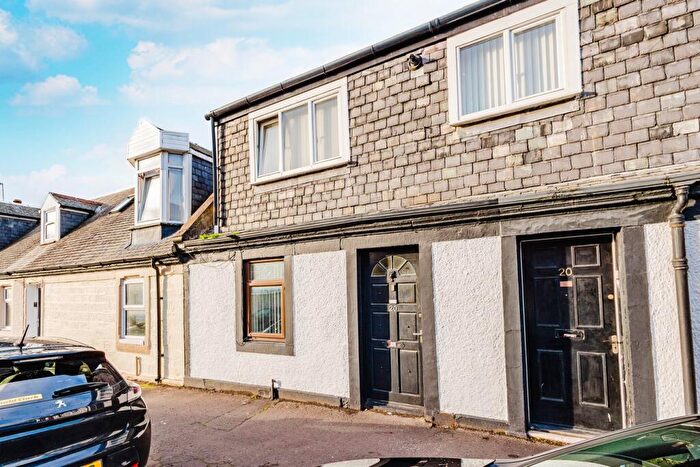
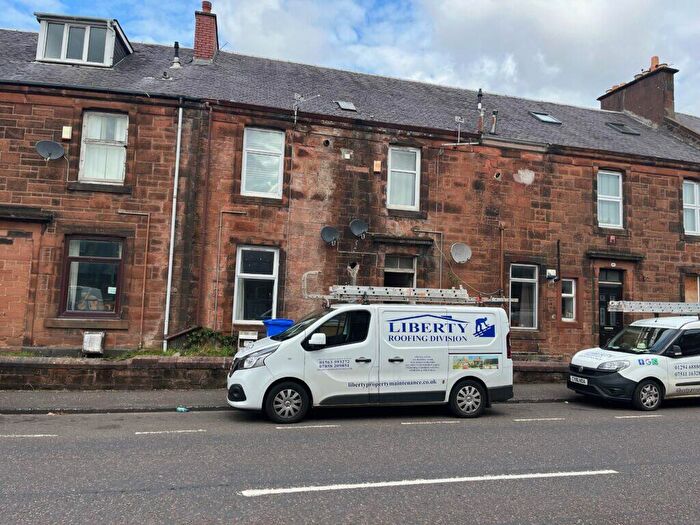
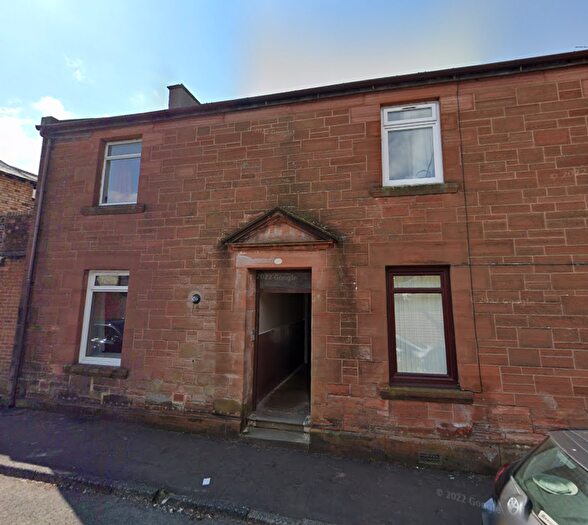
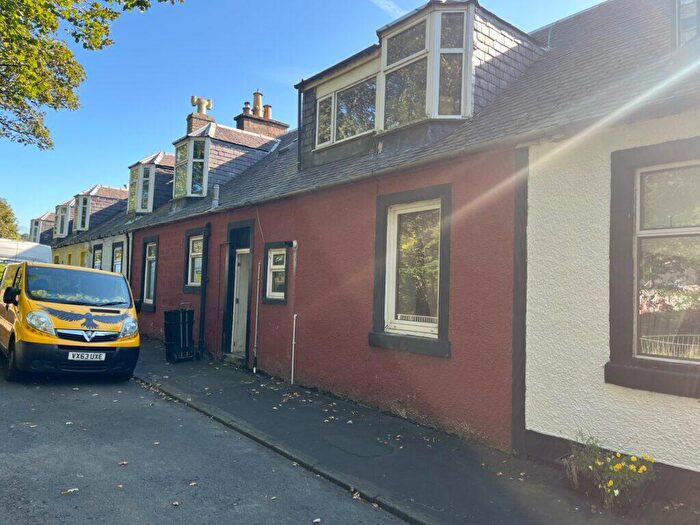
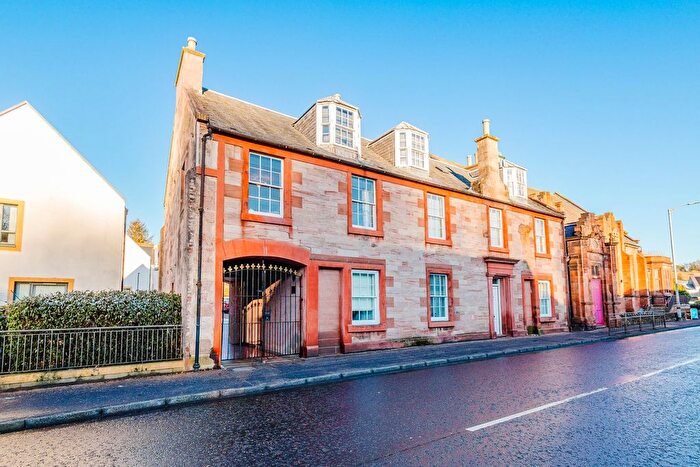
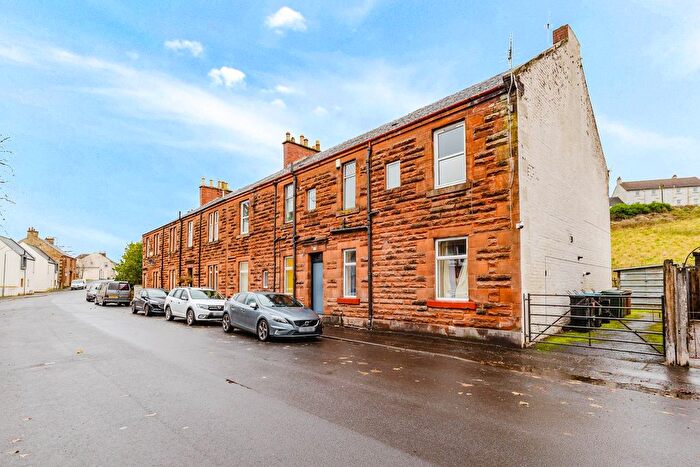
Houses for sale & to rent in Irvine Valley, Newmilns
House Prices in Irvine Valley
Properties in Irvine Valley have an average house price of £85,703.00 and had 113 Property Transactions within the last 3 years¹.
Irvine Valley is an area in Newmilns, East Ayrshire with 1,550 households², where the most expensive property was sold for £573,000.00.
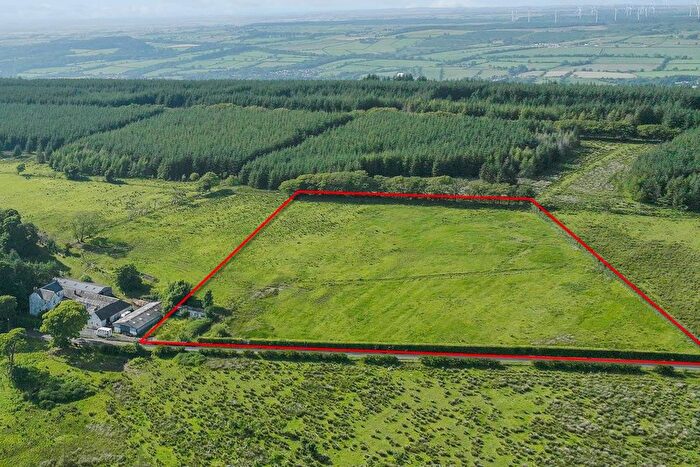
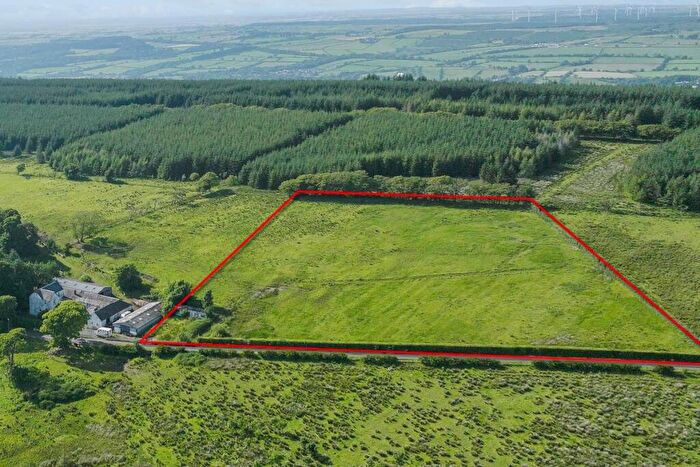
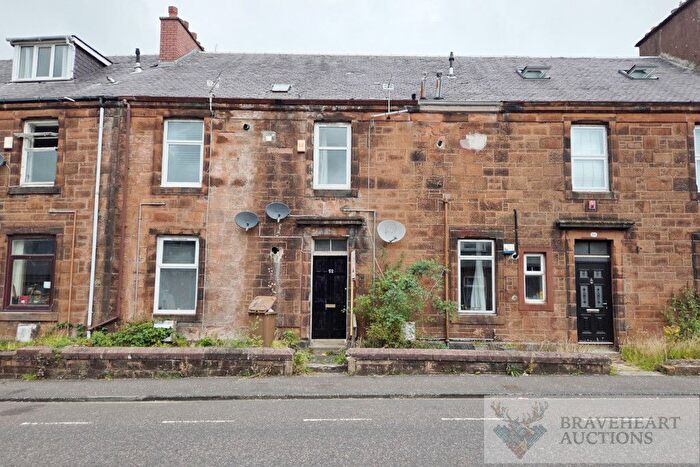
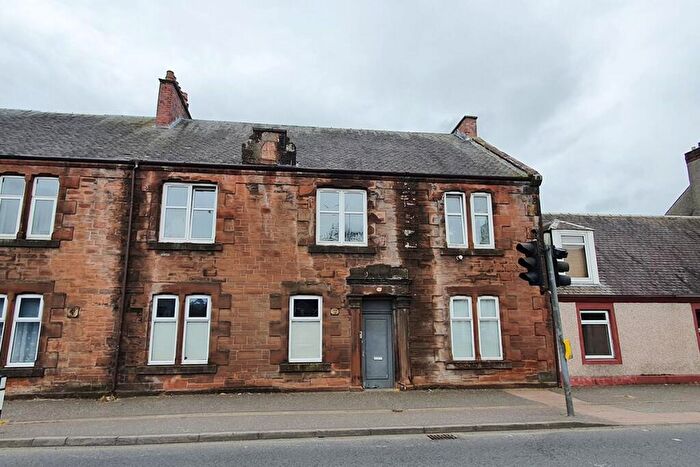
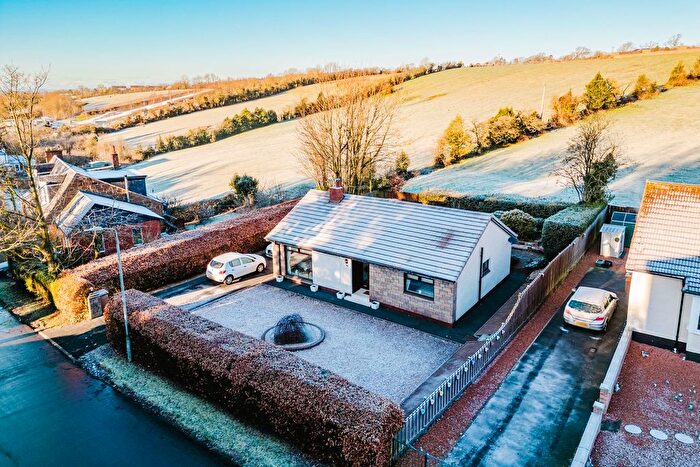
Properties for sale in Irvine Valley
Previously listed properties in Irvine Valley
Roads and Postcodes in Irvine Valley
Navigate through our locations to find the location of your next house in Irvine Valley, Newmilns for sale or to rent.
| Streets | Postcodes |
|---|---|
| Baldies Brae | KA16 9HE |
| Borebrae Crescent | KA16 9EP |
| Bridgend | KA16 9BU |
| Brown Street | KA16 9AA KA16 9AD KA16 9AF KA16 9AG KA16 9BP |
| Browns Road | KA16 9AS |
| Burn Road | KA16 9DR |
| Campbell Court | KA16 9BW |
| Campbell Street | KA16 9DS KA16 9DT KA16 9DU |
| Castle Street | KA16 9DF |
| Clearmount Avenue | KA16 9ER |
| Cochrane Place | KA16 9EY |
| Covenanters Court | KA16 9ET |
| Craigview Road | KA16 9DQ |
| Dalwhatswood Road | KA16 9LT |
| Darnleyhill Walk | KA16 9ES |
| Darvel Road | KA16 9BH KA16 9JX |
| Drygate Street | KA16 9EF |
| East Church Court | KA16 9JQ |
| Foulpapple Road | KA16 9LB KA16 9LD |
| Fraser Court | KA16 9JH |
| Girvan Crescent | KA16 9HZ |
| Greenside | KA16 9AU |
| High Street | KA16 9DZ KA16 9EA KA16 9EB KA16 9EE |
| Hillside Place | KA16 9EH |
| Huggincraig Road | KA16 9EW |
| Irvine Road | KA16 9JB KA16 9JE |
| Isles Street | KA16 9DP |
| Isles Terrace | KA16 9JZ |
| John Law Close | KA16 9ED |
| Kilnholm Street | KA16 9HD |
| King Street | KA16 9DN KA16 9DW |
| King's Crescent | KA16 9DY |
| Ladeside | KA16 9BE |
| Lanfine Estate | KA16 9JP KA16 9JR |
| Lawrie Street | KA16 9JF |
| Loudoun Crescent | KA16 9EL |
| Loudoun Road | KA16 9HF KA16 9HG KA16 9HH KA16 9HJ KA16 9HQ |
| Loudoun Road West | KA16 9JA KA16 9JG |
| Macleod Street | KA16 9JD |
| Main Street | KA16 9BX KA16 9DA KA16 9DB KA16 9DE KA16 9DG KA16 9DH KA16 9DJ KA16 9HA KA16 9HB |
| Mair Street | KA16 9EN |
| Mill Court | KA16 9EX |
| Mill Crescent | KA16 9BB |
| Mill Road | KA16 9BD KA16 9BQ |
| Murdoch Nisbet Court | KA16 9DD |
| Mure Place | KA16 9HR |
| Nelson Street | KA16 9AP |
| Queen's Crescent | KA16 9HP |
| Regents Court | KA16 9JJ |
| Riverbank Street | KA16 9HL |
| Shields Road | KA16 9HN |
| Stoneygate Road | KA16 9AJ KA16 9AL |
| Strath Crescent | KA16 9AN |
| Stratholm Terrace | KA16 9AW |
| Union Street | KA16 9AZ KA16 9BJ |
| Weavers Place | KA16 9BT |
| West Campbell Street | KA16 9DX |
| West Church Street | KA16 9EG |
| KA16 9AT KA16 9AX KA16 9AY KA16 9EJ KA16 9EQ KA16 9HS KA16 9HT KA16 9HU KA16 9HX KA16 9HY KA16 9JT KA16 9JY KA16 9LA KA16 9LE KA16 9LF KA16 9LG KA16 9LH KA16 9LJ KA16 9LL KA16 9LP KA16 9LQ KA16 9LR KA16 9LS KA16 9LW |
Transport near Irvine Valley
- FAQ
- Price Paid By Year
Frequently asked questions about Irvine Valley
What is the average price for a property for sale in Irvine Valley?
The average price for a property for sale in Irvine Valley is £85,703. There are 680 property listings for sale in Irvine Valley.
Which train stations are available in or near Irvine Valley?
Some of the train stations available in or near Irvine Valley are Kilmarnock, Kilmaurs and Stewarton.
Property Price Paid in Irvine Valley by Year
The average sold property price by year was:
| Year | Average Sold Price | Price Change |
Sold Properties
|
|---|---|---|---|
| 2023 | £62,351 | -47% |
22 Properties |
| 2022 | £91,348 | 7% |
91 Properties |
| 2021 | £84,948 | 2% |
77 Properties |
| 2020 | £83,295 | 23% |
60 Properties |
| 2019 | £64,253 | -19% |
62 Properties |
| 2018 | £76,721 | 7% |
71 Properties |
| 2017 | £71,155 | -1% |
62 Properties |
| 2016 | £71,811 | -21% |
50 Properties |
| 2015 | £86,588 | 6% |
50 Properties |
| 2014 | £81,119 | -8% |
51 Properties |
| 2013 | £87,909 | 9% |
47 Properties |
| 2012 | £79,967 | -28% |
31 Properties |
| 2011 | £102,255 | 28% |
27 Properties |
| 2010 | £73,141 | -6% |
36 Properties |
| 2009 | £77,546 | -9% |
38 Properties |
| 2008 | £84,509 | -35% |
64 Properties |
| 2007 | £114,449 | 41% |
88 Properties |
| 2006 | £67,476 | -12% |
112 Properties |
| 2005 | £75,682 | 35% |
94 Properties |
| 2004 | £48,824 | 20% |
102 Properties |
| 2003 | £39,073 | -7% |
100 Properties |
| 2002 | £41,940 | 44% |
103 Properties |
| 2001 | £23,585 | - |
7 Properties |

