
Houses for sale in Falkirk, Falkirk
House Prices in Falkirk
Properties in Falkirk have an average house price of £171k and had 2,413 Property Transactions within the last 3 years.¹
Falkirk is an area in Falkirk with 33,478 households², where the most expensive property was sold for £700k.
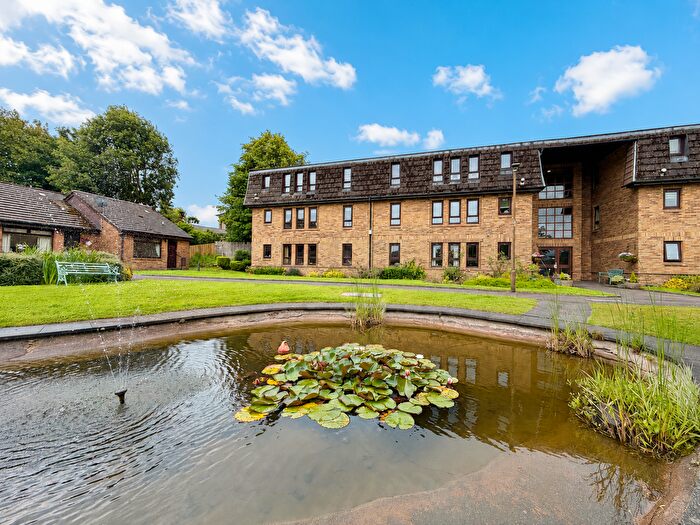
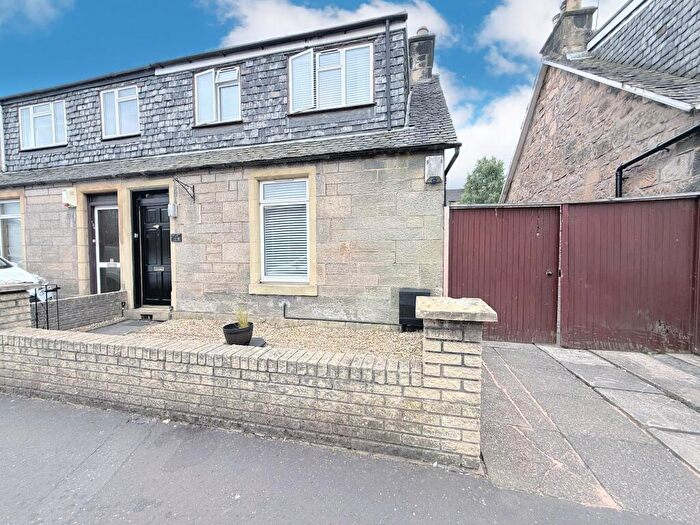
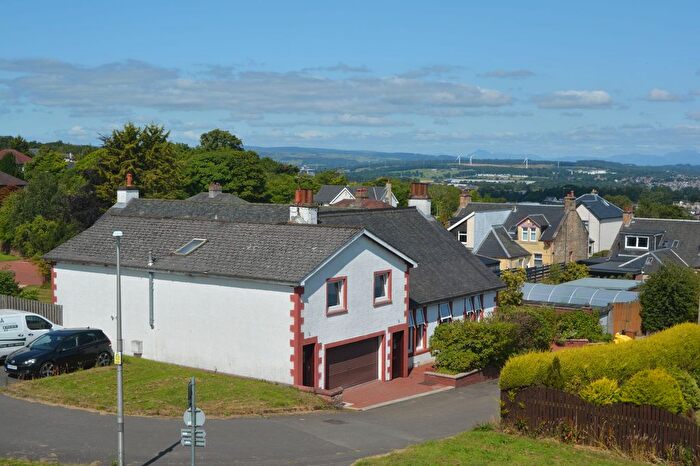
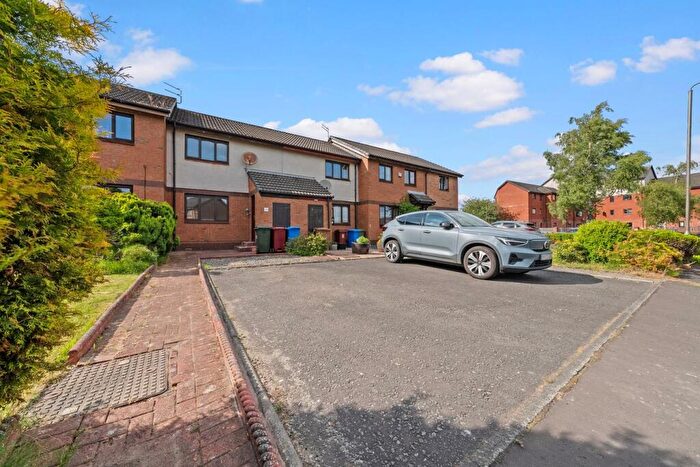
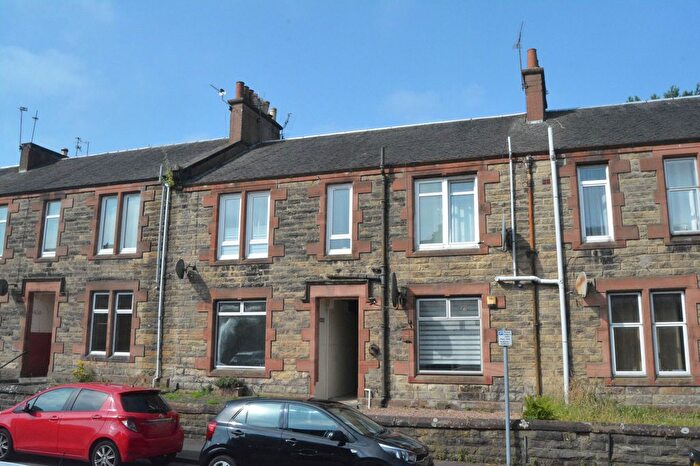
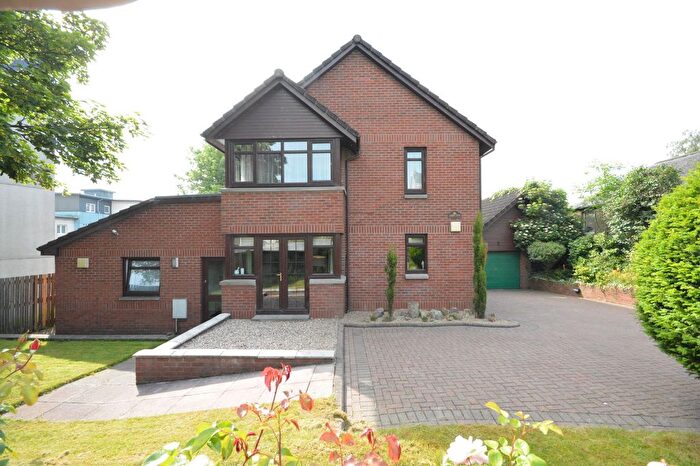
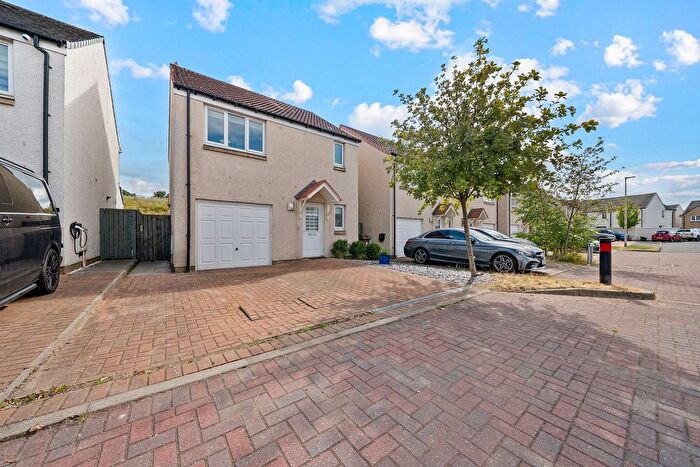
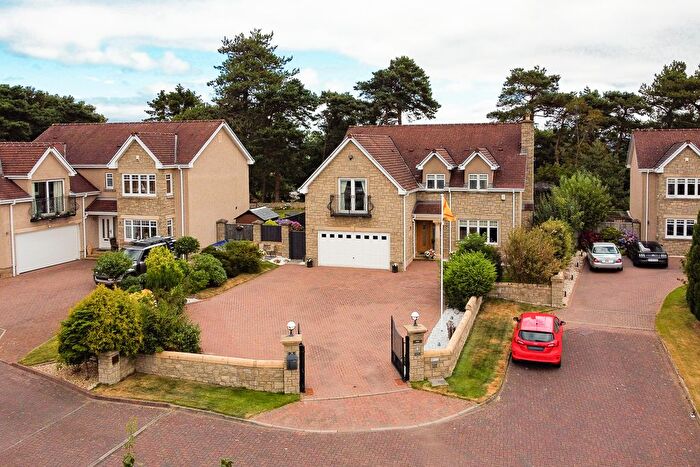
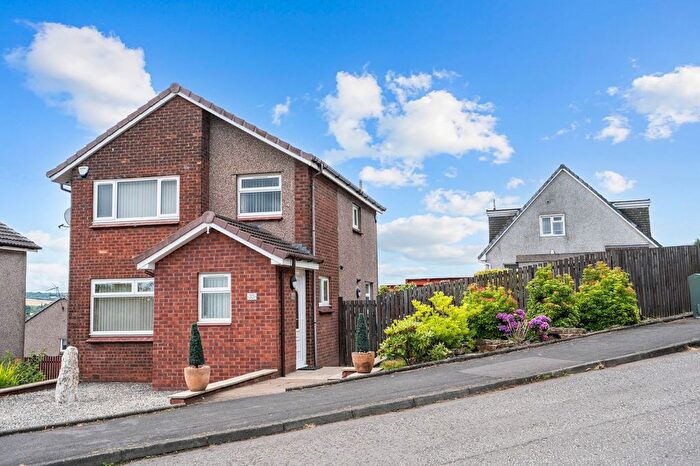
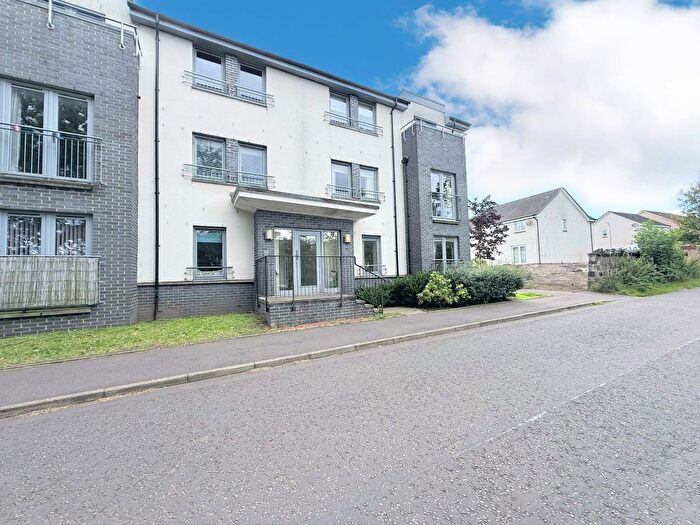
Properties for sale in Falkirk

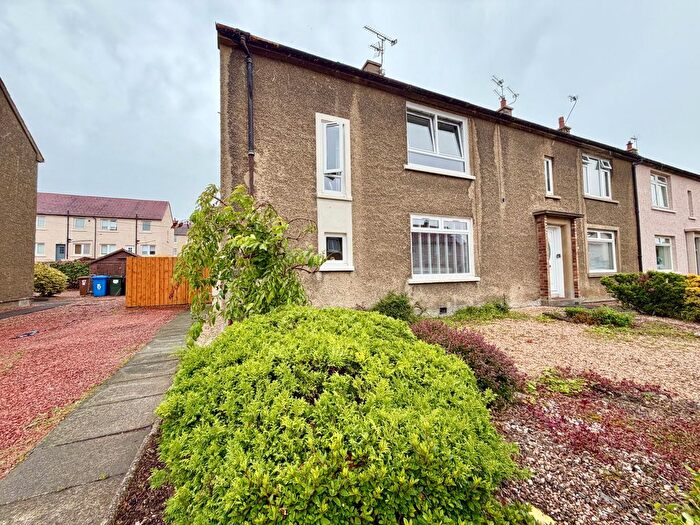
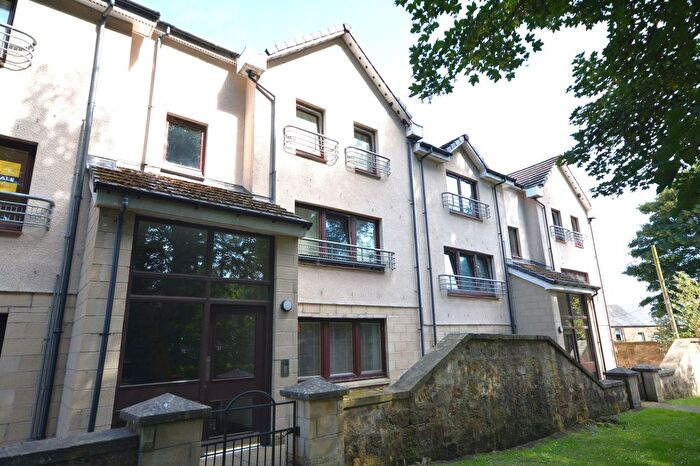
![]()
If you are looking to sell your house, let it out, or receive a property valuation, an expert can help you.
Click the button below to get started.

Neighbourhoods in Falkirk
Navigate through our locations to find the location of your next house in Falkirk, Falkirk for sale or to rent.
Property price trends in Falkirk
According to the latest Registers of Scotland data, the average home in Falkirk sold for £179,221 in 2025. That figure comes from a substantial record of 36,482 sales logged over the past 24 years.
Prices have moved up over the last three years. Compared with 2022, when the typical sale came in around £174,163, that's a rise of roughly 2.9%.
Looking back five years, average prices are up about 12.2% since 2020, a gain of around £19,478 in cash terms.
Zoom out to the past decade for the fuller picture. Back in 2015, homes here averaged £137,892, so the typical sold price has climbed about 30% since then, roughly 2.7% a year. Stretch the view to fifteen years and that annual pace edges up closer to 2.9%.
Frequently asked questions about Falkirk
What is the average price for a property for sale in Falkirk?
The average price for a property for sale in Falkirk is £171,151. This amount is 0.12% higher than the average price in Falkirk. There are more than 10,000 property listings for sale in Falkirk.
What locations have the most expensive properties for sale in Falkirk?
The locations with the most expensive properties for sale in Falkirk are Carse, Kinnaird and Tryst at an average of £211,890, Upper Braes at an average of £207,148 and Lower Braes at an average of £190,609.
What locations have the most affordable properties for sale in Falkirk?
The locations with the most affordable properties for sale in Falkirk are Falkirk North at an average of £128,078 and Falkirk South at an average of £168,177.
Which train stations are available in or near Falkirk?
Some of the train stations available in or near Falkirk are Falkirk Grahamston, Falkirk High and Camelon.
Property Price Paid in Falkirk by Year
The average sold property price by year was:
| Year | Average Sold Price | Price Change |
Sold Properties
|
|---|---|---|---|
| 2025 | £179,221 | 5% |
750 Properties |
| 2024 | £170,541 | 3% |
810 Properties |
| 2023 | £164,635 | -6% |
853 Properties |
| 2022 | £174,163 | 7% |
1,397 Properties |
| 2021 | £161,938 | 1% |
1,525 Properties |
| 2020 | £159,743 | 3% |
1,195 Properties |
| 2019 | £154,153 | 1% |
1,514 Properties |
| 2018 | £152,828 | 9% |
1,506 Properties |
| 2017 | £139,415 | -0,5% |
1,551 Properties |
| 2016 | £140,063 | 2% |
1,662 Properties |
Transport in Falkirk
Please see below transportation links in this area:
