
Houses for sale & to rent in Wester Ross, Strathpeffer and Lochalsh, Achnasheen
House Prices in Wester Ross, Strathpeffer and Lochalsh
Properties in Wester Ross, Strathpeffer and Lochalsh have an average house price of £195,833.00 and had 6 Property Transactions within the last 3 years¹.
Wester Ross, Strathpeffer and Lochalsh is an area in Achnasheen, Highland with 683 households², where the most expensive property was sold for £299,000.00.
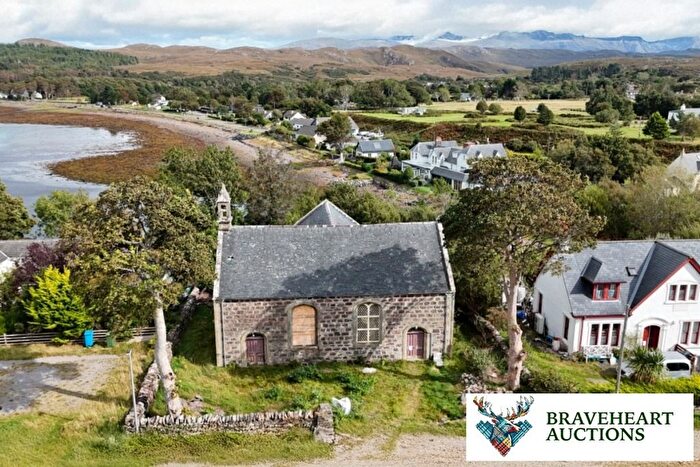
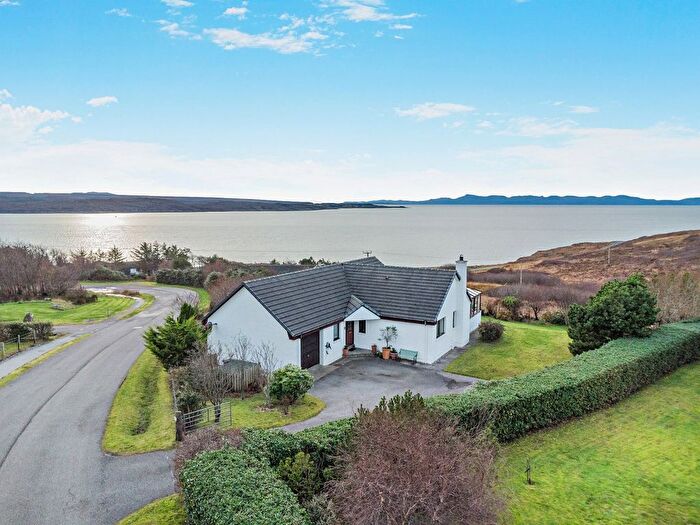
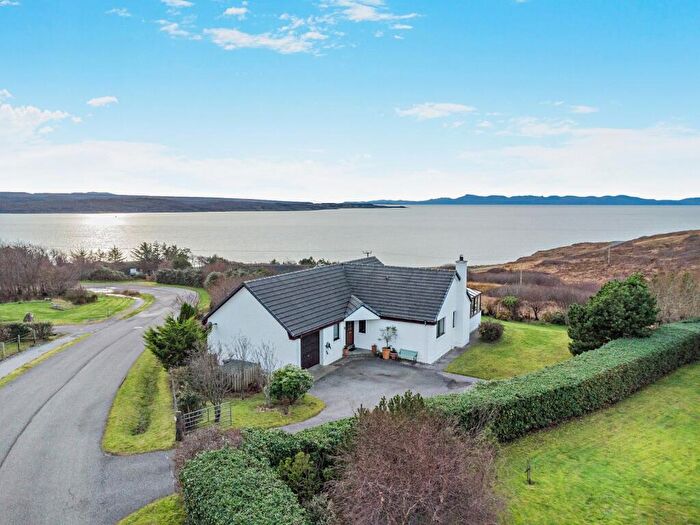
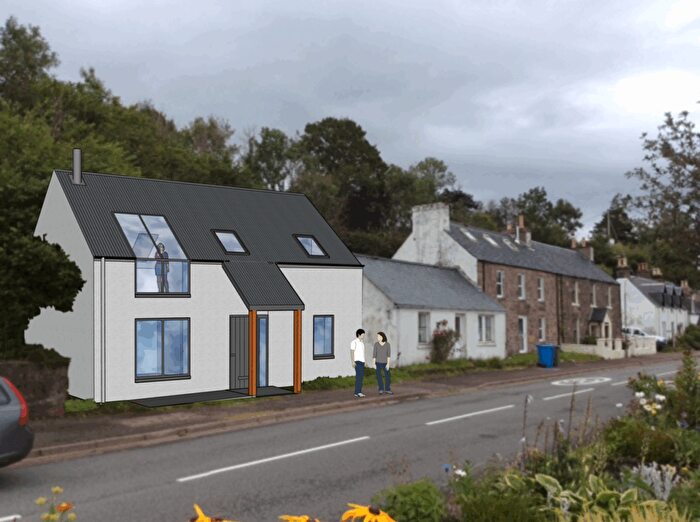
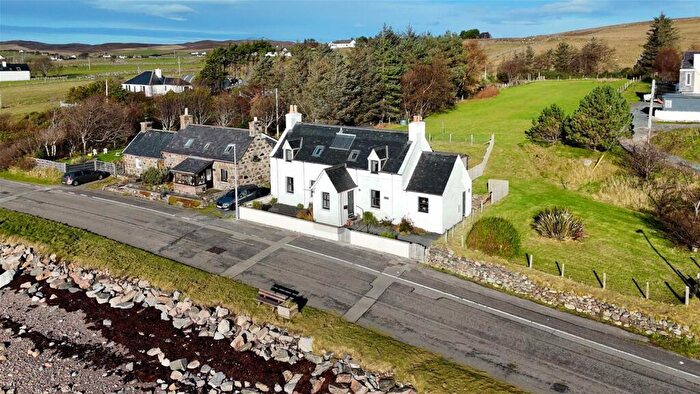
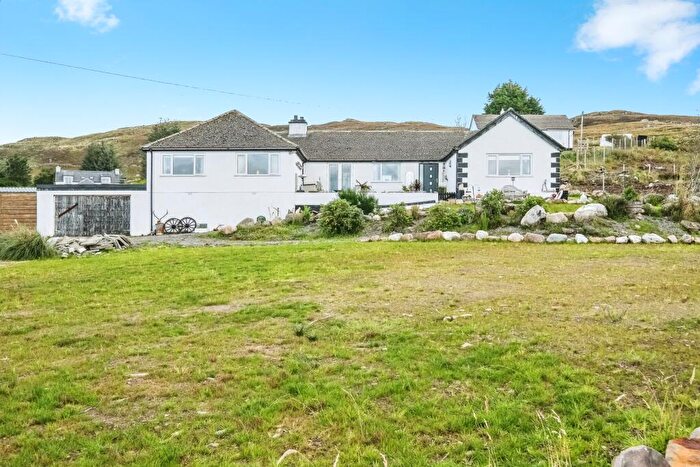
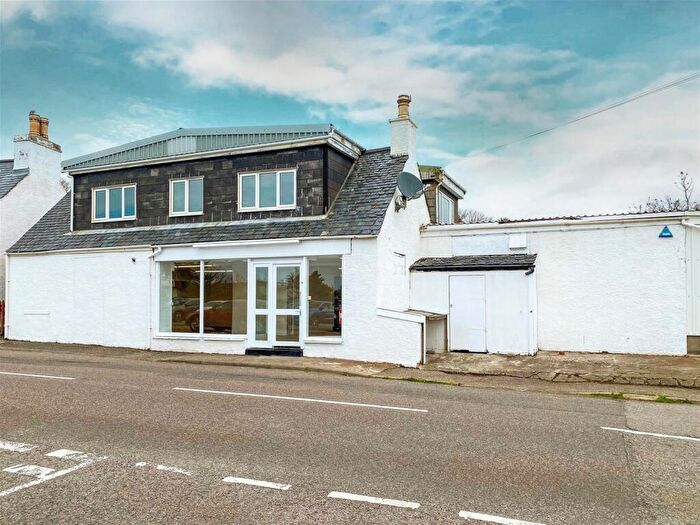
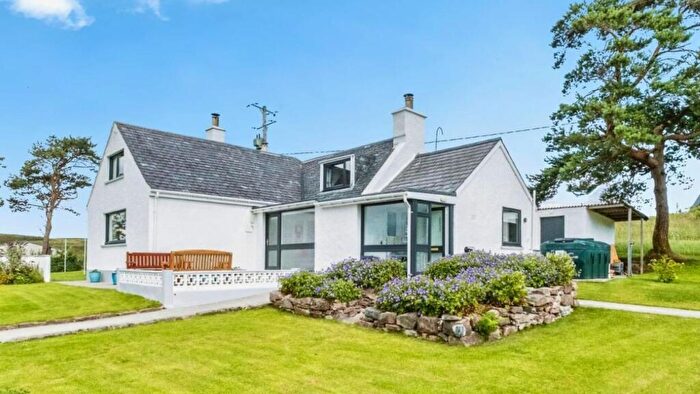
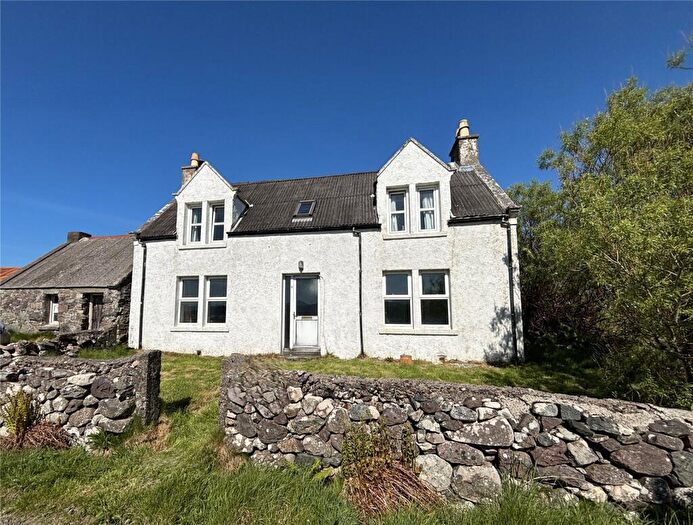
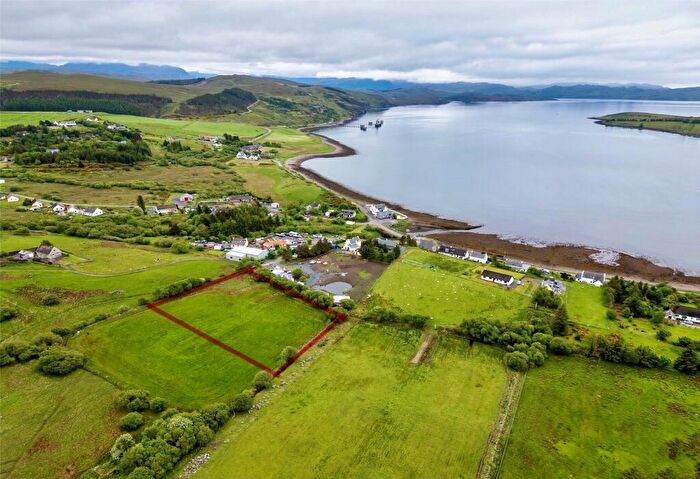
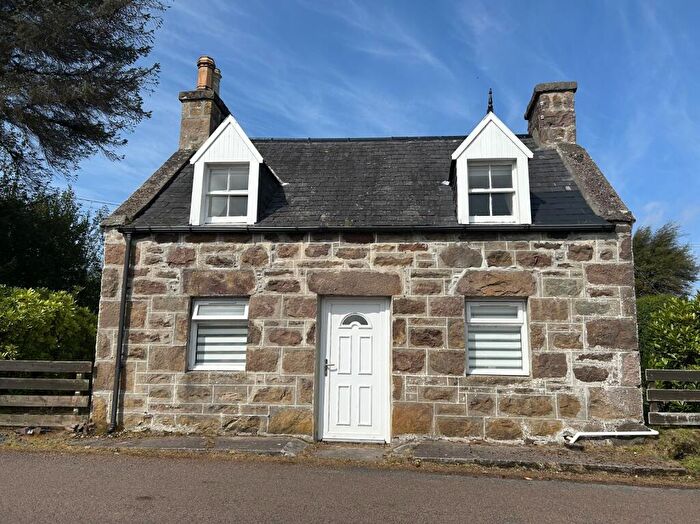
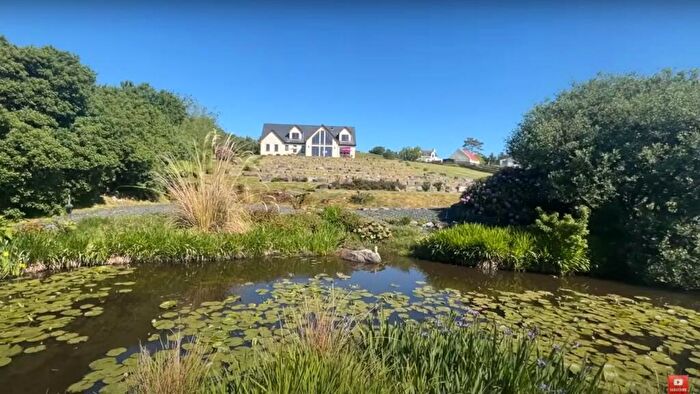
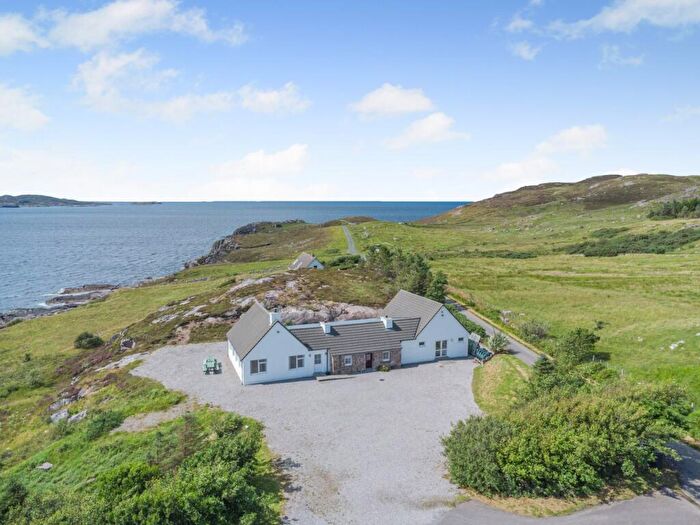
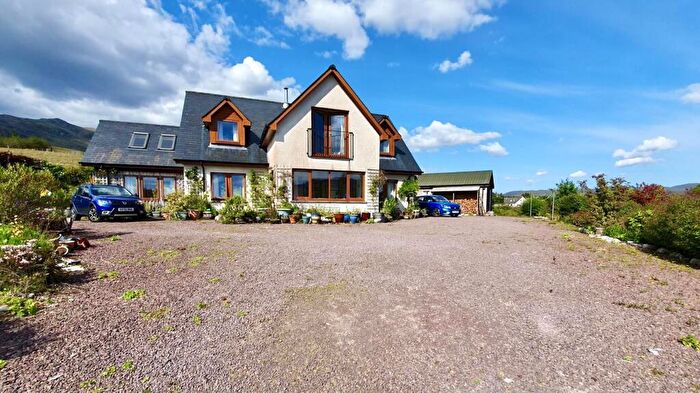
Properties for sale in Wester Ross, Strathpeffer and Lochalsh
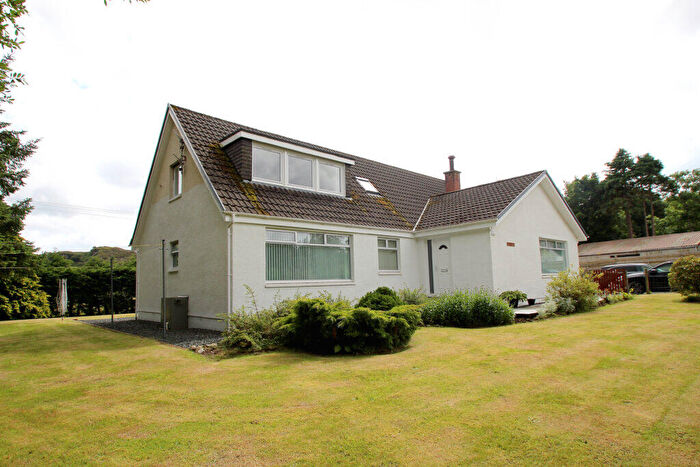
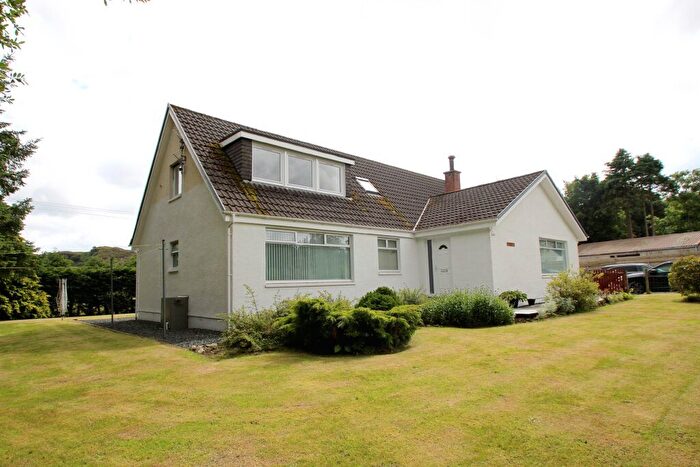
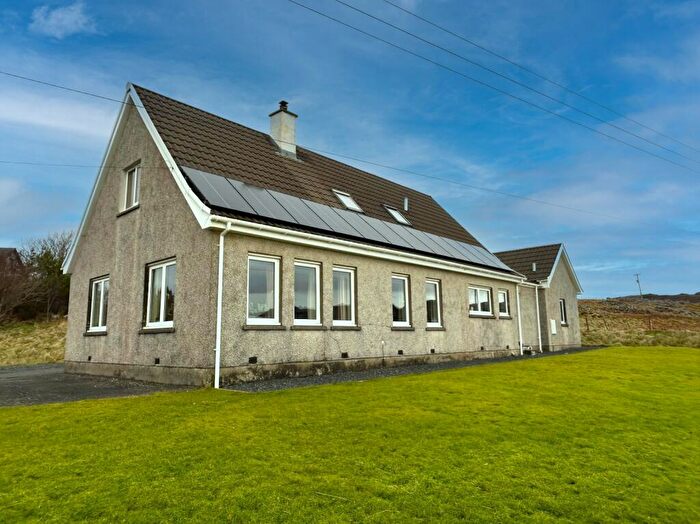
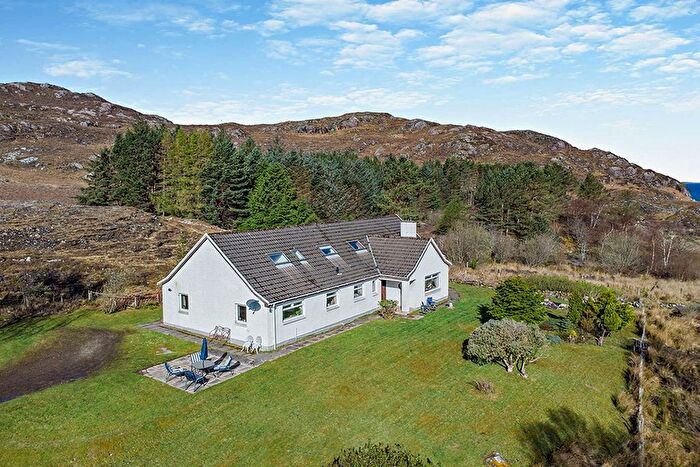
![]()
If you are looking to sell your house, let it out, or receive a property valuation, an expert can help you.
Click the button below to get started.
Roads and Postcodes in Wester Ross, Strathpeffer and Lochalsh
Navigate through our locations to find the location of your next house in Wester Ross, Strathpeffer and Lochalsh, Achnasheen for sale or to rent.
Transport near Wester Ross, Strathpeffer and Lochalsh
-
 Achnashellach Station
 -
Achnasheen Station
-
Strathcarron Station
-
Attadale Station
-
Achanalt Station
-
Stromeferry Station
-
Lochluichart Station
-
Duncraig Station
-
Plockton Station
-
Duirinish Station
- FAQ
- Price Paid By Year
Frequently asked questions about Wester Ross, Strathpeffer and Lochalsh
What is the average price for a property for sale in Wester Ross, Strathpeffer and Lochalsh?
The average price for a property for sale in Wester Ross, Strathpeffer and Lochalsh is £195,833. There are 352 property listings for sale in Wester Ross, Strathpeffer and Lochalsh.
Which train stations are available in or near Wester Ross, Strathpeffer and Lochalsh?
Some of the train stations available in or near Wester Ross, Strathpeffer and Lochalsh are Achnashellach, Achnasheen and Strathcarron.
Property Price Paid in Wester Ross, Strathpeffer and Lochalsh by Year
The average sold property price by year was:
| Year | Average Sold Price | Price Change |
Sold Properties
|
|---|---|---|---|
| 2023 | £195,833 | -71% |
6 Properties |
| 2022 | £335,639 | 28% |
24 Properties |
| 2021 | £242,414 | 24% |
32 Properties |
| 2020 | £183,227 | 6% |
19 Properties |
| 2019 | £171,846 | -15% |
28 Properties |
| 2018 | £197,589 | 26% |
24 Properties |
| 2017 | £146,475 | -11% |
35 Properties |
| 2016 | £162,654 | -20% |
36 Properties |
| 2015 | £194,569 | 14% |
21 Properties |
| 2014 | £166,746 | -16% |
33 Properties |
| 2013 | £193,109 | 23% |
16 Properties |
| 2012 | £148,062 | -31% |
16 Properties |
| 2011 | £194,166 | 2% |
12 Properties |
| 2010 | £189,546 | 49% |
13 Properties |
| 2009 | £97,400 | -7% |
17 Properties |
| 2008 | £104,392 | -27% |
27 Properties |
| 2007 | £132,221 | -1% |
28 Properties |
| 2006 | £133,605 | 7% |
23 Properties |
| 2005 | £123,703 | 24% |
30 Properties |
| 2004 | £94,275 | -3% |
33 Properties |
| 2003 | £97,255 | 9% |
20 Properties |
| 2002 | £88,833 | -18% |
6 Properties |
| 2001 | £104,437 | - |
4 Properties |