
Houses for sale & to rent in Grantown-on-spey, Highland
House Prices in Grantown-on-spey
Properties in Grantown-on-spey have an average house price of £241k and had 78 Property Transactions within the last 3 years.¹
Grantown-on-spey is an area in Highland with 1,639 households², where the most expensive property was sold for £735k.
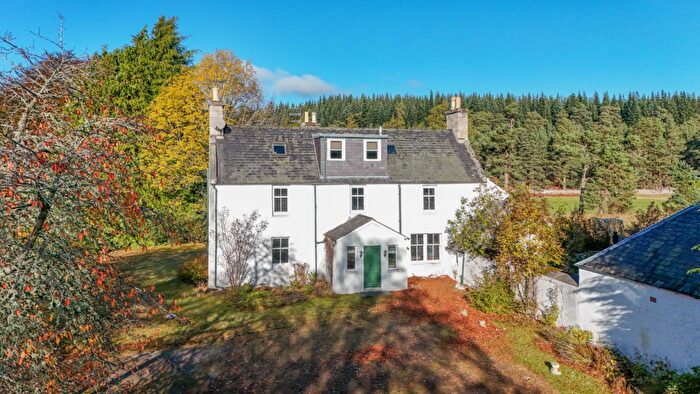
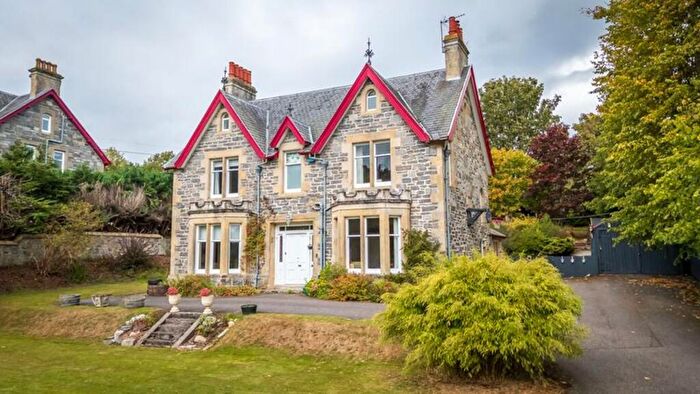
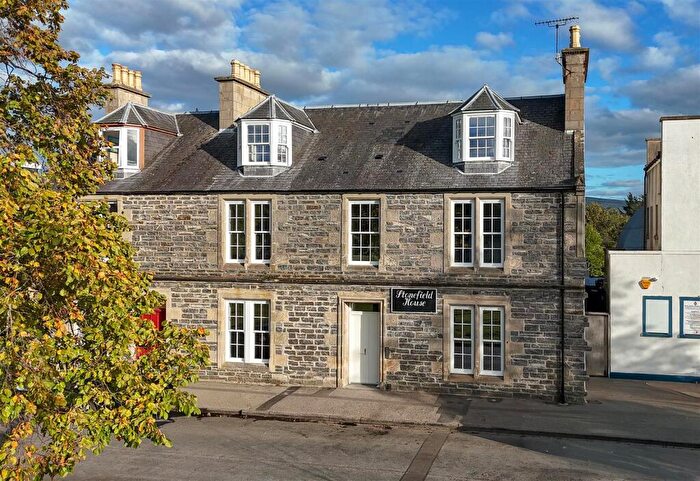
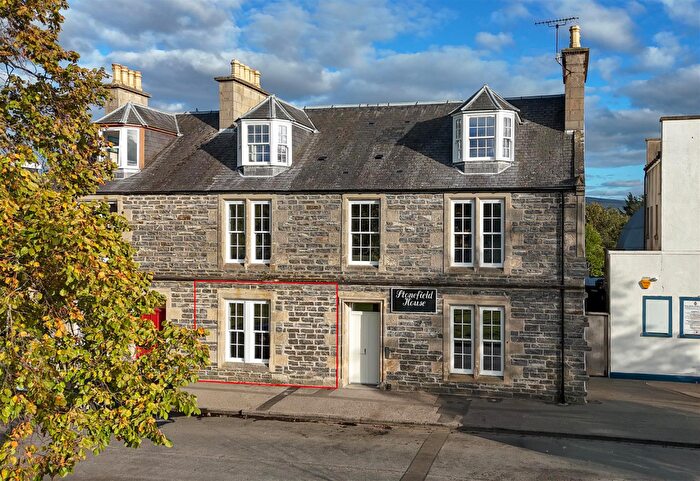
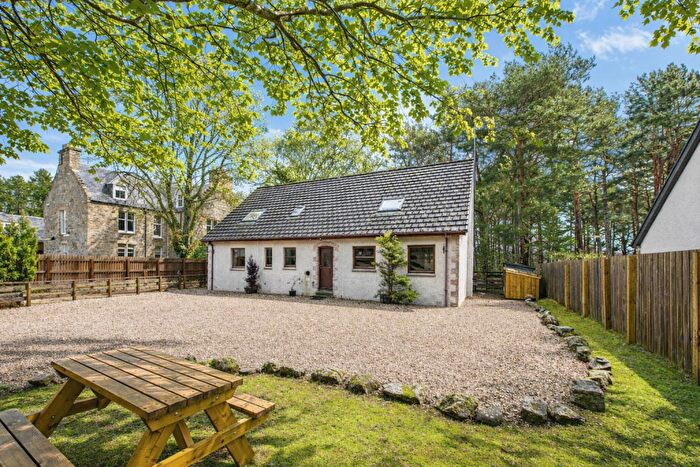
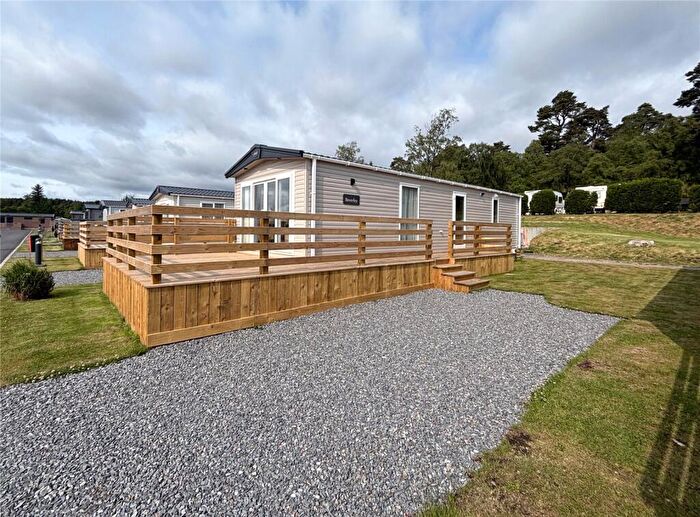
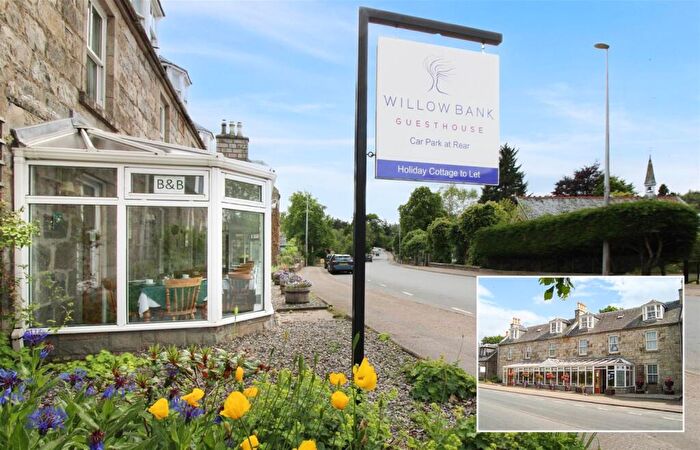
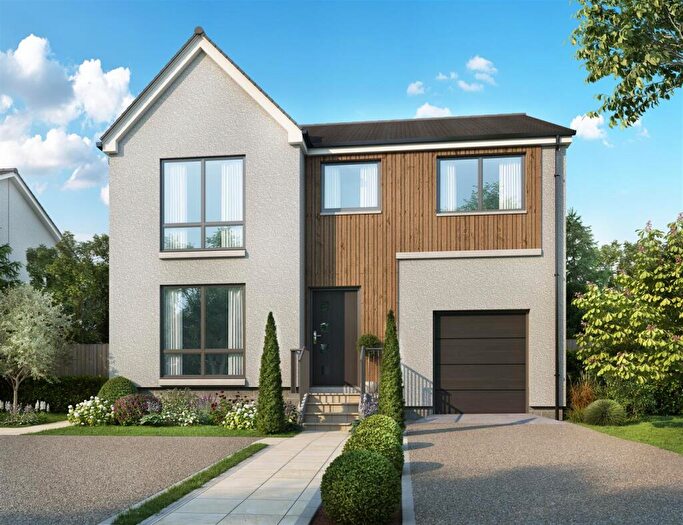
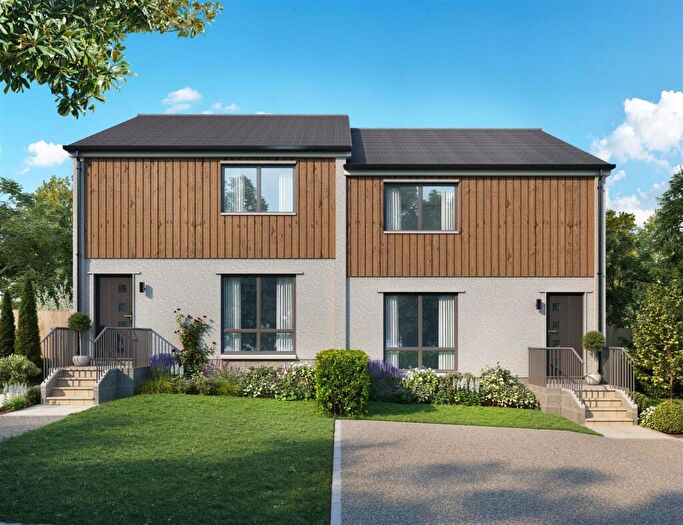
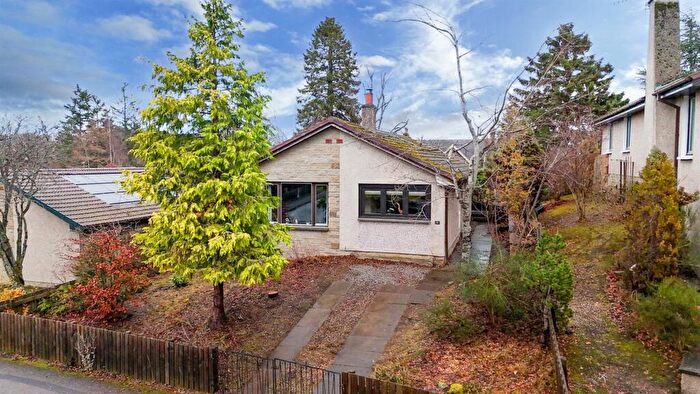
Properties for sale in Grantown-on-spey
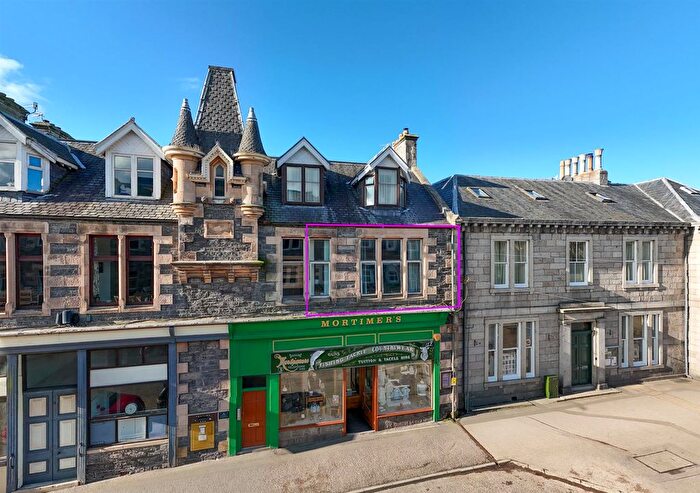
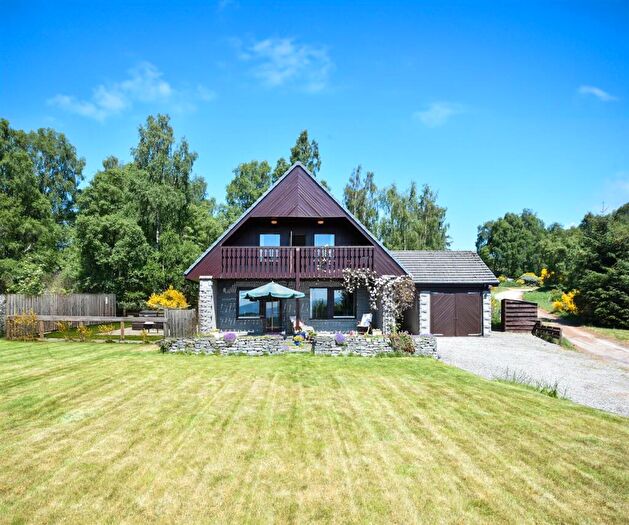

![]()
If you are looking to sell your house, let it out, or receive a property valuation, an expert can help you.
Click the button below to get started.

Neighbourhoods in Grantown-on-spey
Navigate through our locations to find the location of your next house in Grantown-on-spey, Highland for sale or to rent.
Transport in Grantown-on-spey
Please see below transportation links in this area:

- FAQ
- Price Paid By Year
Frequently asked questions about Grantown-on-spey
What is the average price for a property for sale in Grantown-on-spey?
The average price for a property for sale in Grantown-on-spey is £240,545. This amount is 20% higher than the average price in Highland. There are 478 property listings for sale in Grantown-on-spey.
Which train stations are available in or near Grantown-on-spey?
Some of the train stations available in or near Grantown-on-spey are Carrbridge, Aviemore and Forres.
Property Price Paid in Grantown-on-spey by Year
The average sold property price by year was:
| Year | Average Sold Price | Price Change |
Sold Properties
|
|---|---|---|---|
| 2025 | £242,809 | 13% |
31 Properties |
| 2024 | £210,202 | -23% |
19 Properties |
| 2023 | £258,628 | -13% |
28 Properties |
| 2022 | £291,069 | 14% |
56 Properties |
| 2021 | £249,122 | 14% |
85 Properties |
| 2020 | £213,704 | 6% |
86 Properties |
| 2019 | £201,146 | -10% |
83 Properties |
| 2018 | £222,021 | 11% |
57 Properties |
| 2017 | £198,275 | 9% |
73 Properties |
| 2016 | £181,007 | -7% |
67 Properties |
| 2015 | £193,307 | 9% |
68 Properties |
| 2014 | £176,132 | -3% |
102 Properties |
| 2013 | £180,954 | -8% |
71 Properties |
| 2012 | £196,208 | -5% |
60 Properties |
| 2011 | £206,039 | 2% |
50 Properties |
| 2010 | £201,428 | 9% |
65 Properties |
| 2009 | £184,165 | 15% |
57 Properties |
| 2008 | £156,593 | -38% |
57 Properties |
| 2007 | £216,378 | 17% |
88 Properties |
| 2006 | £178,557 | 13% |
110 Properties |
| 2005 | £155,605 | 11% |
84 Properties |
| 2004 | £137,989 | 17% |
86 Properties |
| 2003 | £114,014 | -2% |
78 Properties |
| 2002 | £116,858 | 35% |
31 Properties |
| 2001 | £76,275 | 19% |
16 Properties |
| 2000 | £61,772 | - |
11 Properties |