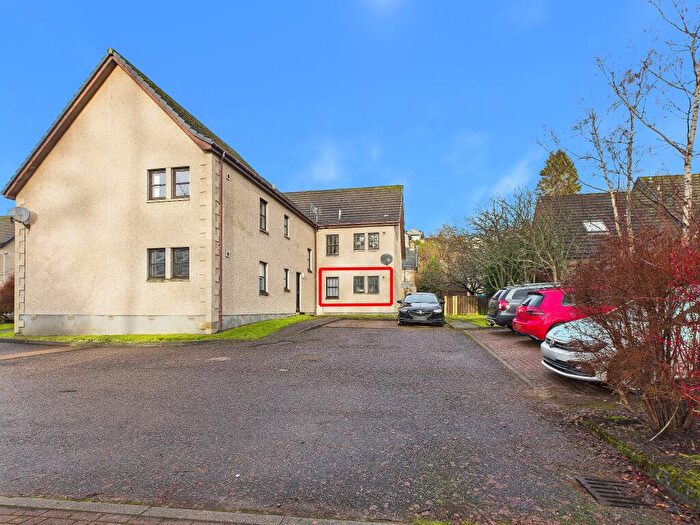
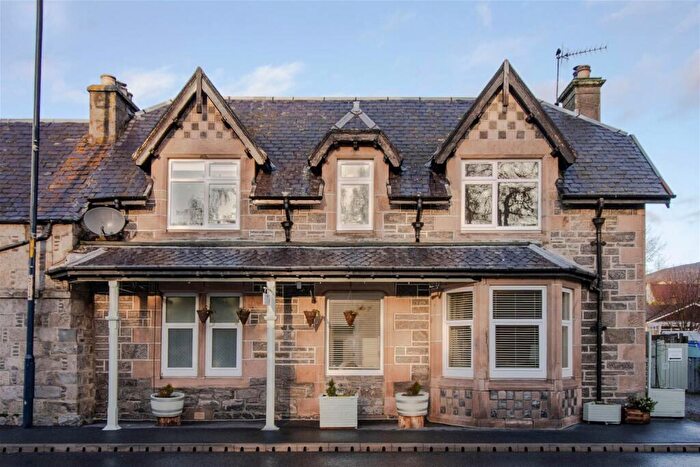
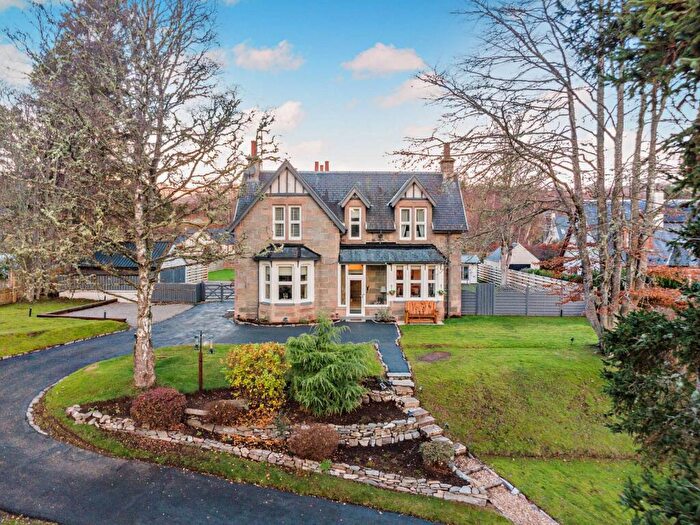
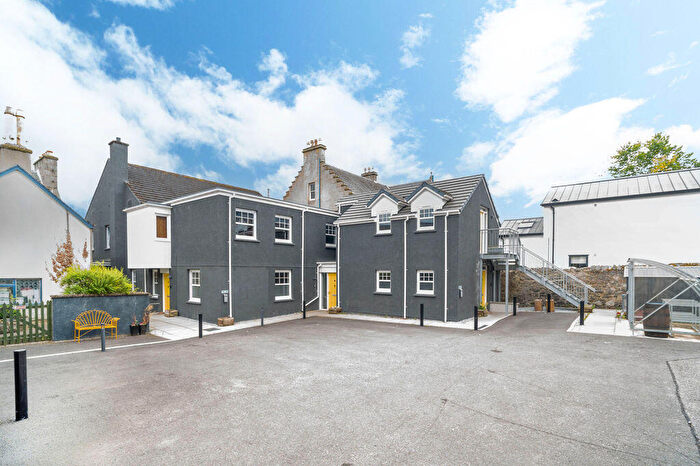
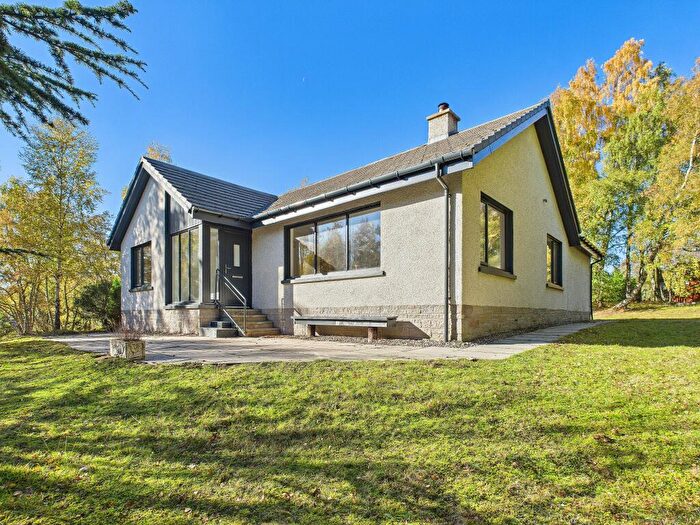
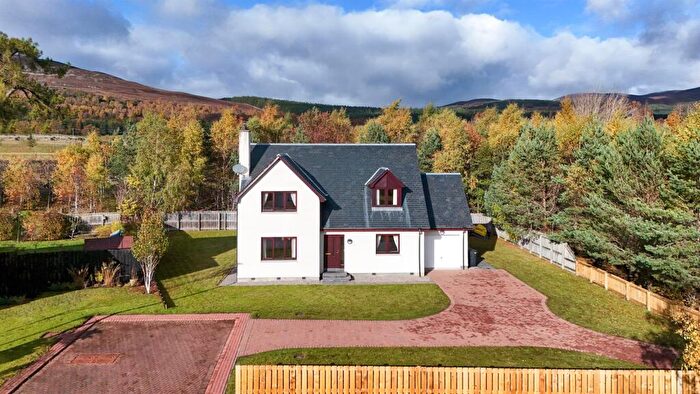
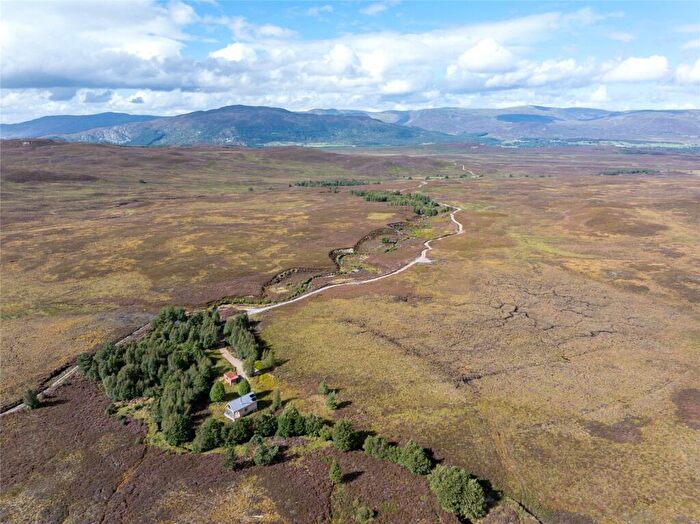
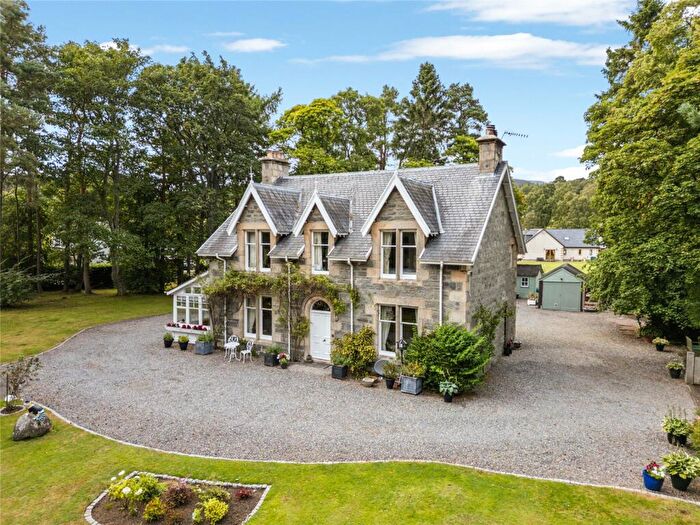
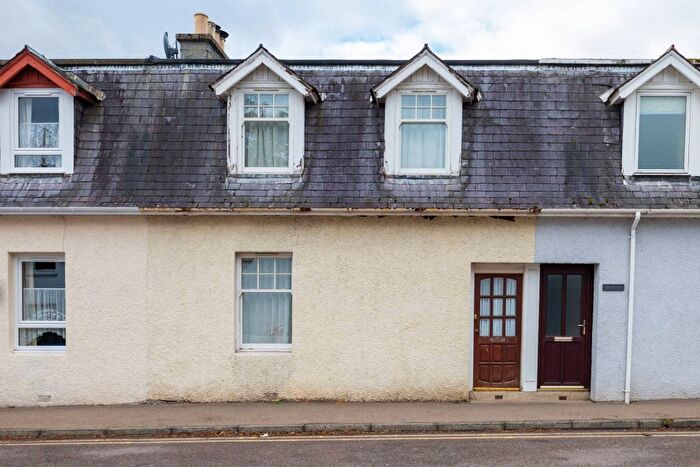
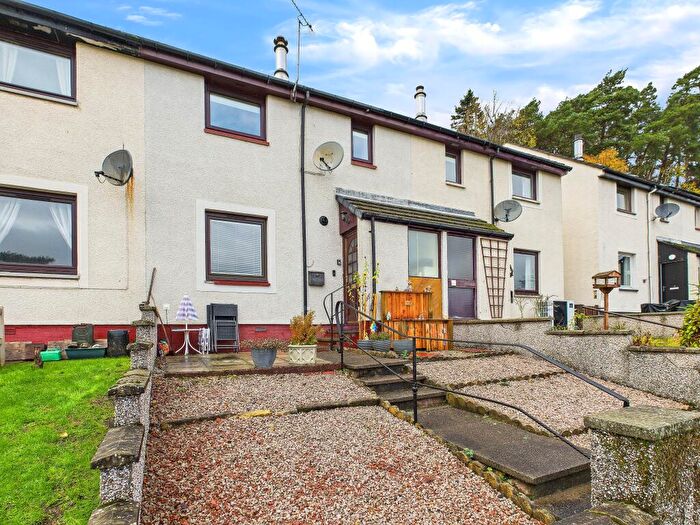
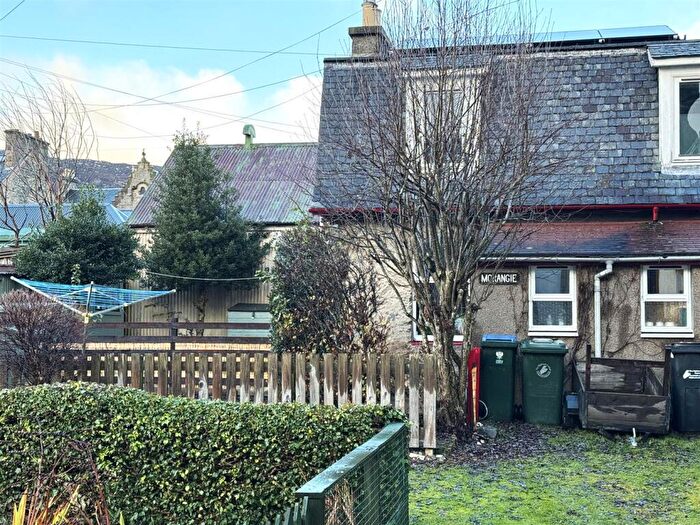
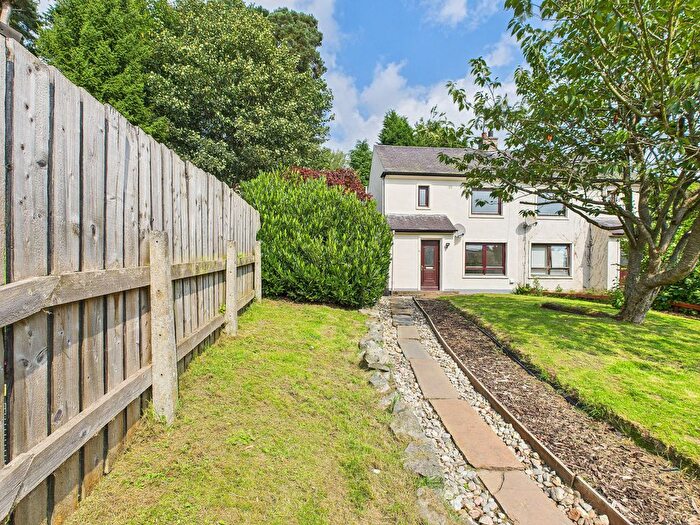
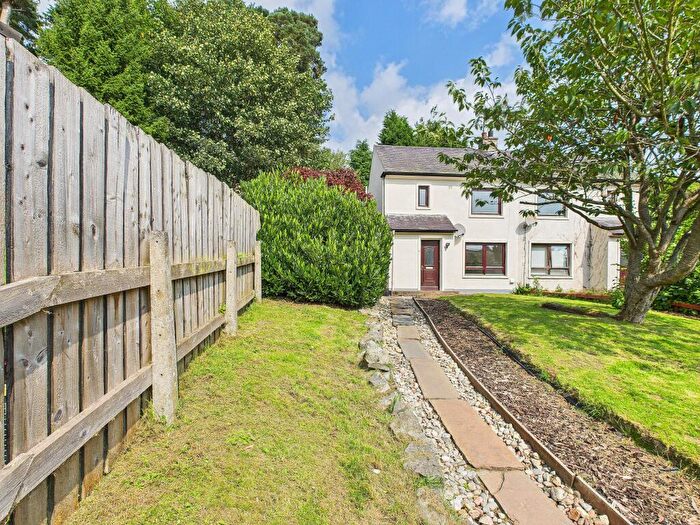
Houses for sale & to rent in Badenoch and Strathspey, Kingussie
House Prices in Badenoch and Strathspey
Properties in Badenoch and Strathspey have an average house price of £288,751.00 and had 37 Property Transactions within the last 3 years¹.
Badenoch and Strathspey is an area in Kingussie, Highland with 958 households², where the most expensive property was sold for £625,000.00.
Properties for sale in Badenoch and Strathspey
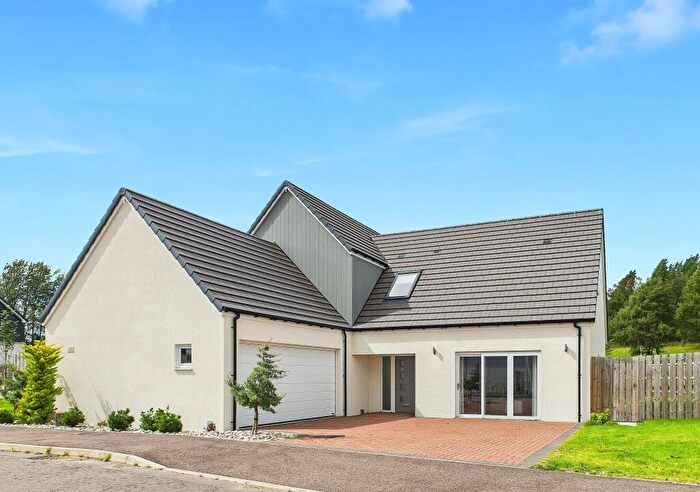
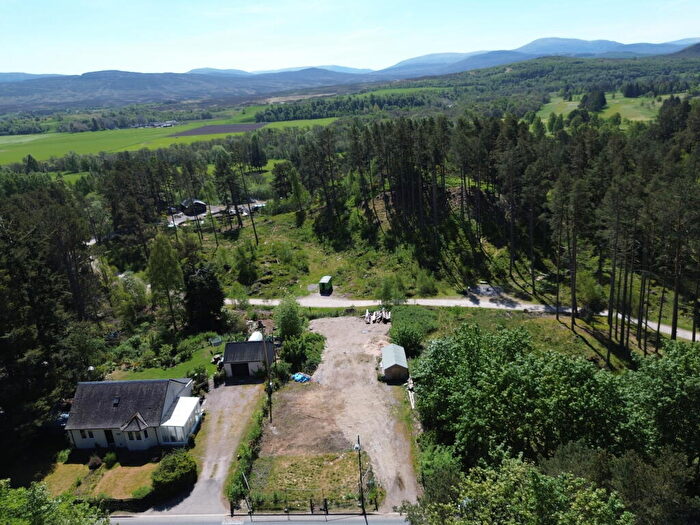
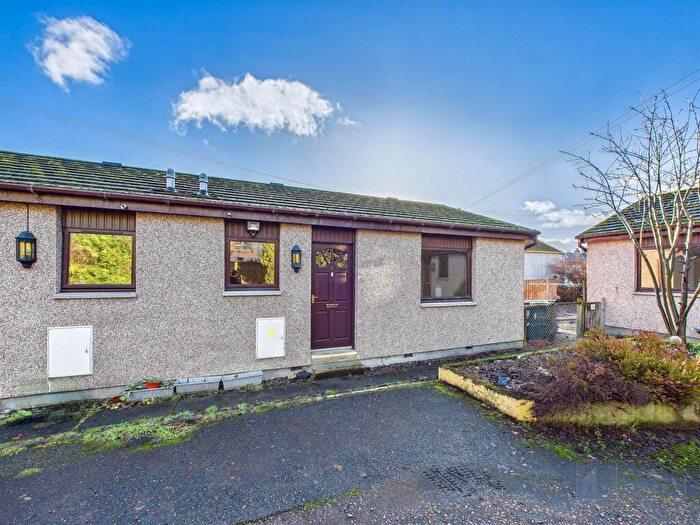
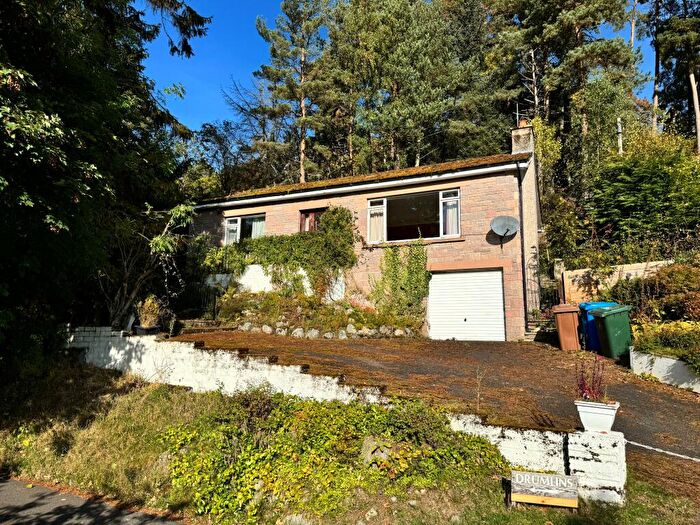
Previously listed properties in Badenoch and Strathspey
Roads and Postcodes in Badenoch and Strathspey
Navigate through our locations to find the location of your next house in Badenoch and Strathspey, Kingussie for sale or to rent.
| Streets | Postcodes |
|---|---|
| Acres Road | PH21 1LA |
| Alvie Court | PH21 1AH |
| Alvie Estate | PH21 1ND PH21 1NE |
| Anderson Grove | PH21 1AG |
| Ardbroilach Road | PH21 1JX PH21 1JY PH21 1LB PH21 1LD PH21 1LG PH21 1LQ |
| Boa Vista Road | PH21 1LE |
| Braeriach Road | PH21 1QA |
| Campbell Crescent | PH21 1JP PH21 1JR |
| Cluny Terrace | PH21 1JW |
| Columba Terrace | PH21 1HH |
| Croila Road | PH21 1PB |
| Croila View | PH21 1PG |
| Dallas Terrace | PH21 1LJ |
| Dalnavert | PH21 1NQ |
| Duke Street | PH21 1JG |
| Dunachton Road | PH21 1QE |
| Dunbarry Brae | PH21 1HQ |
| Dunbarry Cottages | PH21 1JJ |
| Dunbarry Road | PH21 1JN |
| Dunbarry Terrace | PH21 1LL |
| East Terrace | PH21 1JS |
| Feshie Bridge | PH21 1NG |
| Garraline Terrace | PH21 1JL |
| Glebe Court | PH21 1HG |
| Green Lane | PH21 1JU |
| Gynack Road | PH21 1ET PH21 1EU PH21 1EX |
| Gynack Street | PH21 1EL |
| High Street | PH21 1HR PH21 1HS PH21 1HU PH21 1HX PH21 1HY PH21 1HZ PH21 1JB PH21 1JD PH21 1JE PH21 1LW |
| Hillside Avenue | PH21 1PA |
| James Court | PH21 1PD |
| Jonathan's Brae | PH21 1DX |
| Kerrow Drive | PH21 1QS |
| King Street | PH21 1HP PH21 1HW |
| Macbean Road | PH21 1AD |
| Macedwards Close | PH21 1DQ |
| Macrae Crescent | PH21 1NN |
| Manse Road | PH21 1JF |
| Market Lane | PH21 1EP |
| Middle Terrace | PH21 1EY |
| Mill Road | PH21 1LF |
| Newtonmore Road | PH21 1HD PH21 1HE PH21 1HF |
| Old Distillery Road | PH21 1EZ |
| Orchard Court | PH21 1LH |
| Ruthven Court | PH21 1HJ |
| Ruthven Road | PH21 1EN PH21 1ER PH21 1ES PH21 1EW |
| Spey Street | PH21 1EH PH21 1HL PH21 1HN PH21 1JH PH21 1JQ |
| Speybank Walk | PH21 1QB |
| St Vincents Place | PH21 1PH |
| Suidhe Brae | PH21 1NW |
| Suidhe Crescent | PH21 1NB |
| The Brae | PH21 1QD |
| The Crescent | PH21 1JZ |
| The Glebe | PH21 1PE |
| The Knoll | PH21 1AB |
| West Terrace | PH21 1HA PH21 1HB |
| Woodside | PH21 1QF |
| PH21 1LR PH21 1LS PH21 1LT PH21 1LU PH21 1LX PH21 1LY PH21 1LZ PH21 1NA PH21 1NF PH21 1NH PH21 1NL PH21 1NP PH21 1NR PH21 1NS PH21 1NT PH21 1NU PH21 1NX PH21 1NY PH21 1NZ PH21 1AP |
Transport near Badenoch and Strathspey
- FAQ
- Price Paid By Year
Frequently asked questions about Badenoch and Strathspey
What is the average price for a property for sale in Badenoch and Strathspey?
The average price for a property for sale in Badenoch and Strathspey is £288,751. There are 346 property listings for sale in Badenoch and Strathspey.
What streets have the most expensive properties for sale in Badenoch and Strathspey?
The streets with the most expensive properties for sale in Badenoch and Strathspey are Middle Terrace at an average of £564,000, Spey Street at an average of £560,000 and Ardbroilach Road at an average of £537,500.
What streets have the most affordable properties for sale in Badenoch and Strathspey?
The streets with the most affordable properties for sale in Badenoch and Strathspey are Ruthven Court at an average of £132,333, James Court at an average of £155,000 and Orchard Court at an average of £160,000.
Which train stations are available in or near Badenoch and Strathspey?
Some of the train stations available in or near Badenoch and Strathspey are Kingussie, Newtonmore and Aviemore.
Property Price Paid in Badenoch and Strathspey by Year
The average sold property price by year was:
| Year | Average Sold Price | Price Change |
Sold Properties
|
|---|---|---|---|
| 2025 | £248,675 | -43% |
10 Properties |
| 2024 | £355,186 | 25% |
11 Properties |
| 2023 | £268,125 | -12% |
16 Properties |
| 2022 | £300,642 | 21% |
61 Properties |
| 2021 | £238,064 | 17% |
40 Properties |
| 2020 | £197,885 | -38% |
32 Properties |
| 2019 | £273,128 | 29% |
29 Properties |
| 2018 | £195,070 | -3% |
37 Properties |
| 2017 | £200,666 | -2% |
43 Properties |
| 2016 | £203,727 | 17% |
32 Properties |
| 2015 | £169,539 | -7% |
40 Properties |
| 2014 | £182,216 | 7% |
34 Properties |
| 2013 | £168,576 | -6% |
42 Properties |
| 2012 | £178,874 | -2% |
34 Properties |
| 2011 | £182,466 | -34% |
27 Properties |
| 2010 | £243,620 | 25% |
30 Properties |
| 2009 | £182,958 | -2% |
32 Properties |
| 2008 | £185,956 | -16% |
47 Properties |
| 2007 | £215,175 | 20% |
49 Properties |
| 2006 | £172,931 | 9% |
68 Properties |
| 2005 | £158,088 | 36% |
50 Properties |
| 2004 | £100,964 | -7% |
41 Properties |
| 2003 | £107,592 | 17% |
63 Properties |
| 2002 | £88,957 | - |
31 Properties |

