
Houses for sale & to rent in Eilean á Chèo, Kyle
House Prices in Eilean á Chèo
Properties in Eilean á Chèo have an average house price of £138k and had 12 Property Transactions within the last 3 years¹.
Eilean á Chèo is an area in Kyle, Highland with 77 households², where the most expensive property was sold for £318k.
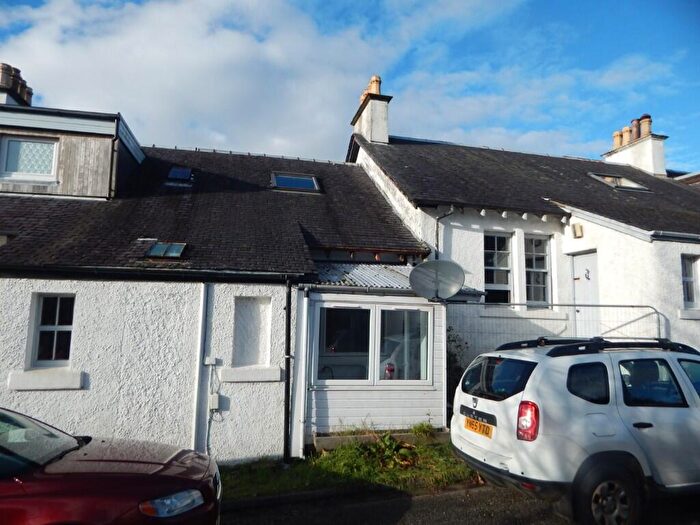
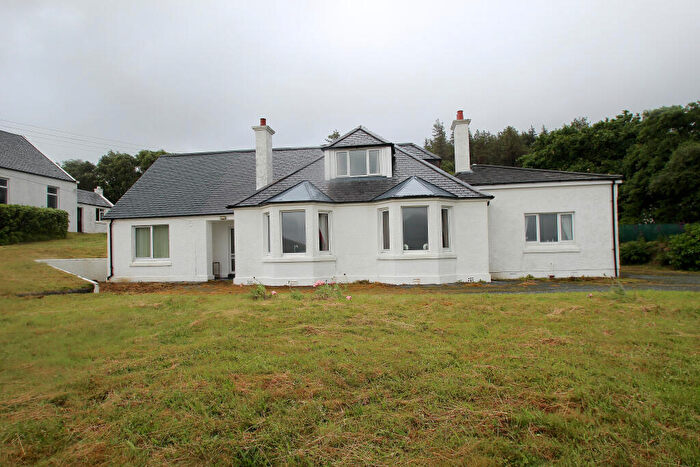
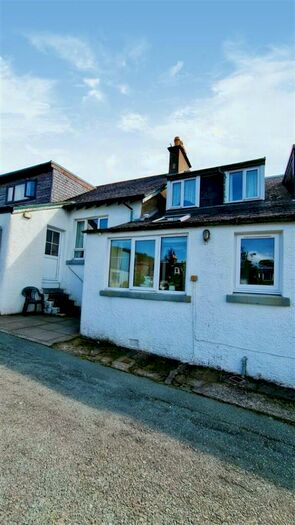
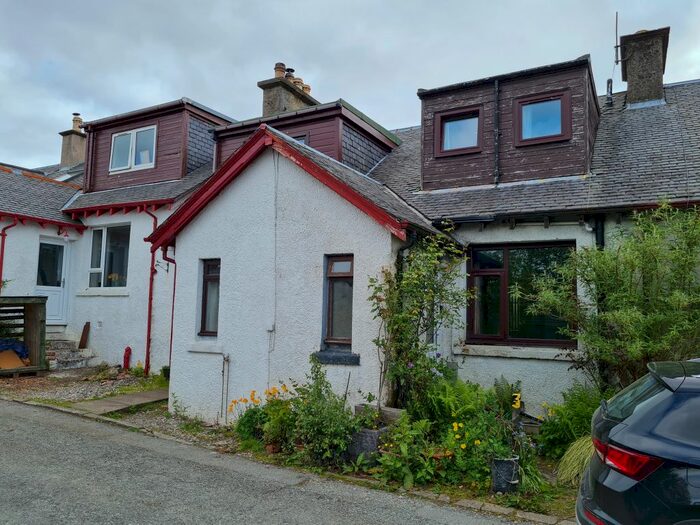
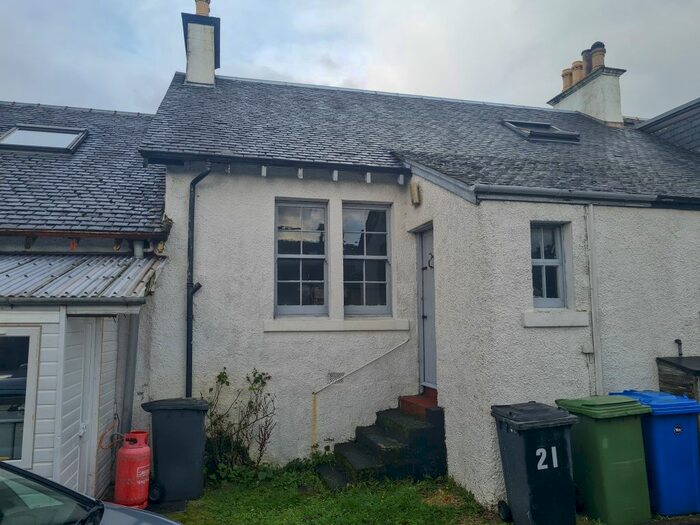
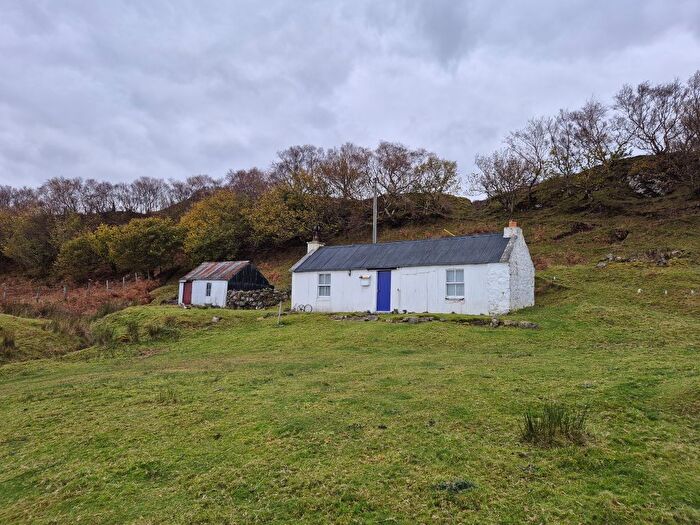
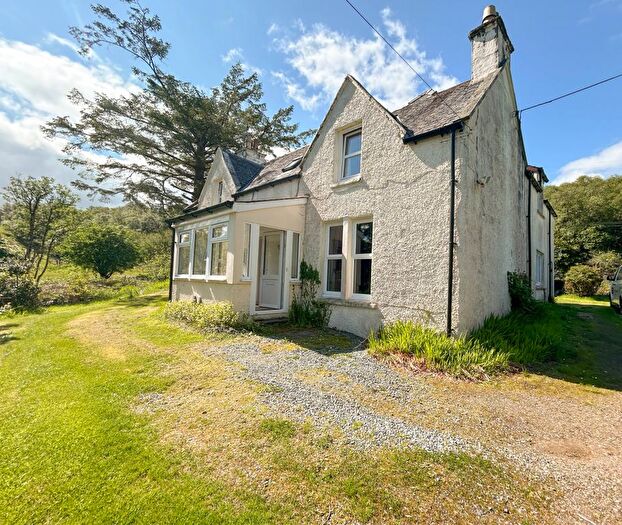
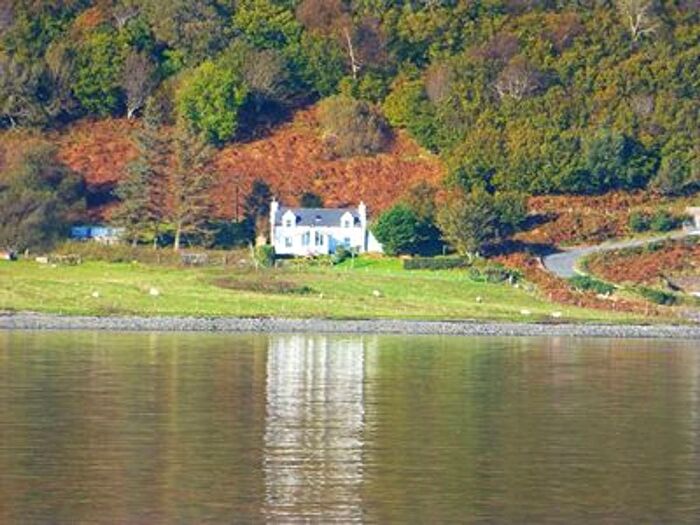
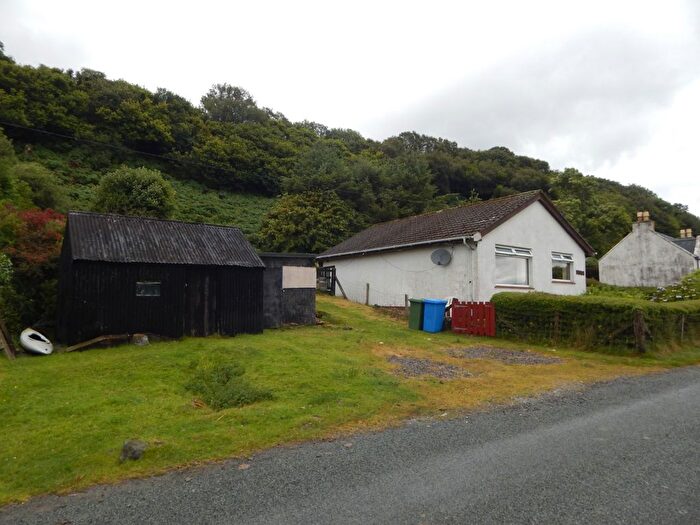
Properties for sale in Eilean á Chèo
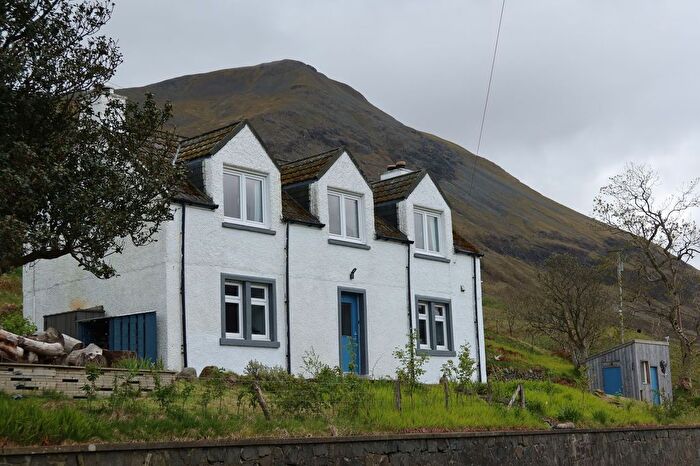
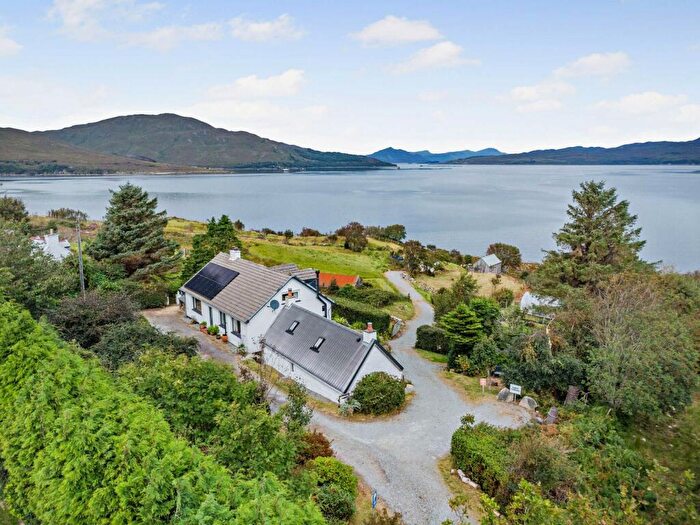
Previously listed properties in Eilean á Chèo


![]()
If you are looking to sell your house, let it out, or receive a property valuation, an expert can help you.
Click the button below to get started.


Roads and Postcodes in Eilean á Chèo
Navigate through our locations to find the location of your next house in Eilean á Chèo, Kyle for sale or to rent.
| Streets | Postcodes |
|---|---|
| Arnish | IV40 8PF |
| East Suisinish | IV40 8NY |
| Eyre | IV40 8NZ |
| Fearns | IV40 8PG |
| Inverarish Terrace | IV40 8NS |
| Mill Place | IV40 8NU |
| School Park | IV40 8NG |
| South Oscaig | IV40 8PD |
| IV40 8NT IV40 8NX IV40 8PA IV40 8PB IV40 8PE |
Transport near Eilean á Chèo

- FAQ
- Price Paid By Year
Frequently asked questions about Eilean á Chèo
What is the average price for a property for sale in Eilean á Chèo?
The average price for a property for sale in Eilean á Chèo is £138,141. This amount is 28% lower than the average price in Kyle. There are 37 property listings for sale in Eilean á Chèo.
What streets have the most expensive properties for sale in Eilean á Chèo?
The streets with the most expensive properties for sale in Eilean á Chèo are South Oscaig at an average of £300,000 and Mill Place at an average of £146,000.
What streets have the most affordable properties for sale in Eilean á Chèo?
The street with the most affordable properties for sale in Eilean á Chèo is Inverarish Terrace at an average of £103,962.
Which train stations are available in or near Eilean á Chèo?
Some of the train stations available in or near Eilean á Chèo are Duirinish, Kyle Of Lochalsh and Plockton.
Property Price Paid in Eilean á Chèo by Year
The average sold property price by year was:
| Year | Average Sold Price | Price Change |
Sold Properties
|
|---|---|---|---|
| 2025 | £146,666 | 20% |
6 Properties |
| 2024 | £118,000 | -15% |
2 Properties |
| 2023 | £135,425 | 18% |
4 Properties |
| 2022 | £111,000 | -72% |
2 Properties |
| 2021 | £191,425 | 28% |
6 Properties |
| 2020 | £138,750 | 15% |
2 Properties |
| 2019 | £118,055 | -57% |
10 Properties |
| 2018 | £185,000 | 51% |
6 Properties |
| 2017 | £90,166 | -27% |
6 Properties |
| 2016 | £114,857 | 2% |
7 Properties |
| 2015 | £112,200 | 24% |
5 Properties |
| 2014 | £85,000 | 18% |
1 Property |
| 2013 | £70,000 | -148% |
1 Property |
| 2012 | £173,750 | 31% |
2 Properties |
| 2011 | £119,900 | 6% |
5 Properties |
| 2010 | £112,200 | -20% |
5 Properties |
| 2009 | £134,666 | 39% |
3 Properties |
| 2008 | £81,666 | 10% |
3 Properties |
| 2007 | £73,519 | -2% |
8 Properties |
| 2006 | £74,835 | -8% |
5 Properties |
| 2005 | £81,062 | 89% |
4 Properties |
| 2004 | £8,624 | -610% |
5 Properties |
| 2003 | £61,250 | 47% |
2 Properties |
| 2002 | £32,500 | - |
2 Properties |