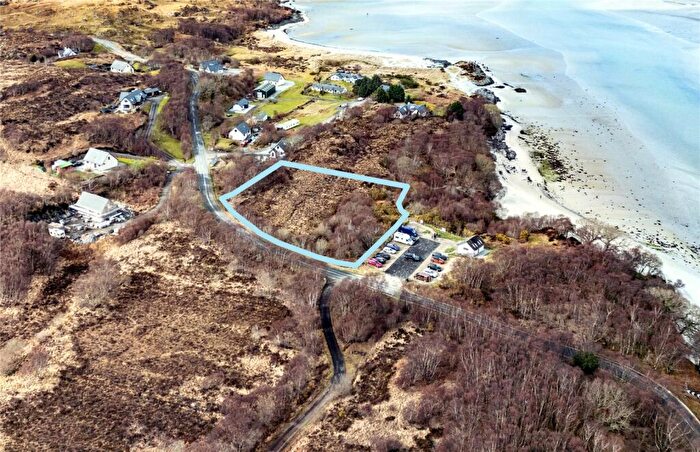
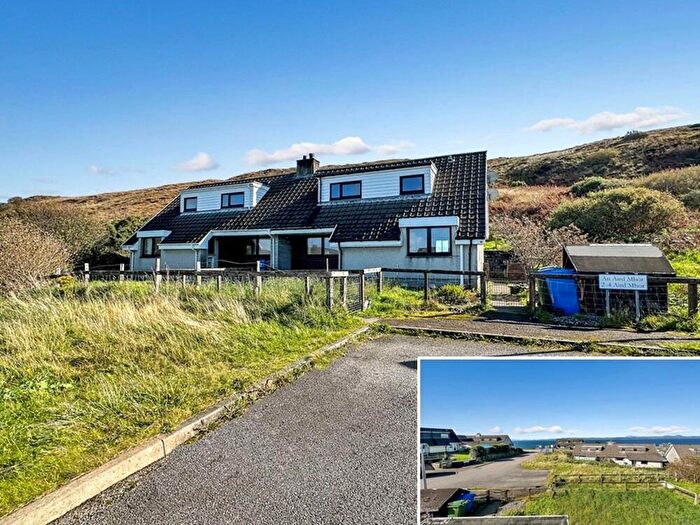
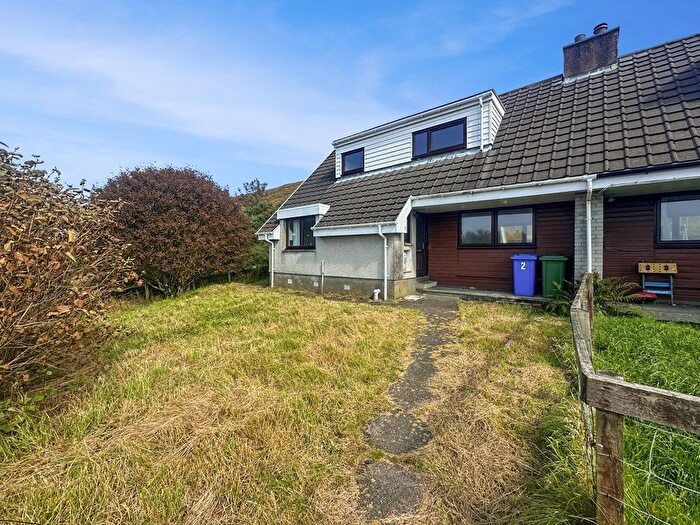
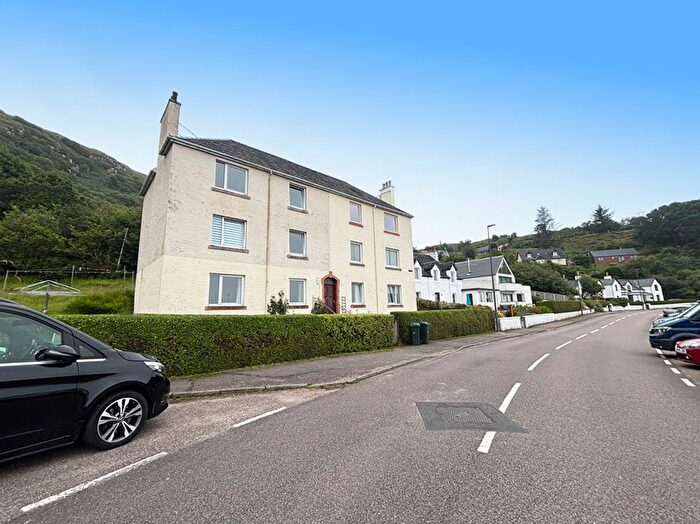
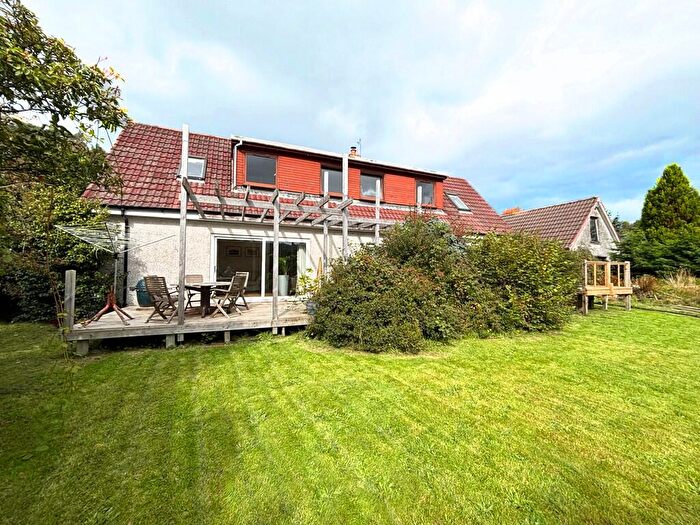
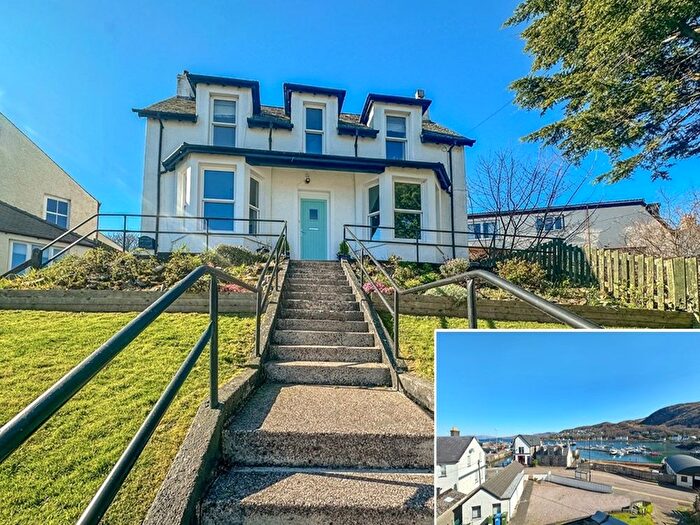
Houses for sale & to rent in Caol and Mallaig, Mallaig
House Prices in Caol and Mallaig
Properties in Caol and Mallaig have an average house price of £159,722.00 and had 9 Property Transactions within the last 3 years¹.
Caol and Mallaig is an area in Mallaig, Highland with 556 households², where the most expensive property was sold for £420,000.00.
Properties for sale in Caol and Mallaig
Previously listed properties in Caol and Mallaig
Roads and Postcodes in Caol and Mallaig
Navigate through our locations to find the location of your next house in Caol and Mallaig, Mallaig for sale or to rent.
| Streets | Postcodes |
|---|---|
| Blaven View | PH41 4QR |
| Cameron Avenue | PH41 4QQ |
| Camus Crescent | PH40 4PJ |
| Clanranald Terrace | PH41 4RE |
| Columba Road | PH40 4PH |
| Coteachan Hill | PH41 4QP |
| East Bay | PH41 4QF PH41 4QG |
| Fank Brae | PH41 4RQ |
| Gillies Park | PH41 4QU |
| Glenancross Road | PH40 4PL |
| Gordon Brown Place | PH41 4RL |
| Harbour Road | PH41 4QB |
| James Jarvie Row | PH41 4QW |
| King's Way | PH41 4RP |
| Loch Nevis Crescent | PH41 4QJ |
| Loch Nevis Terrace | PH41 4QH |
| Lovat Terrace | PH41 4RF |
| Mallaigvaig Road | PH41 4QL |
| Marine Place | PH41 4RD |
| Rhubana View | PH40 4PF |
| Station Road | PH41 4PY PH41 4PZ |
| The Pier | PH41 4PX PH41 4QD |
| Victoria Place | PH41 4RA |
| Victoria Road | PH41 4RN |
| PH40 4PA PH40 4PB PH40 4PD PH40 4PE PH40 4PG PH40 4PN PH41 2RP PH41 4PH PH41 4PL PH41 4PP PH41 4PU PH41 4QA PH41 4QN PH41 4QS PH41 4QT PH41 4QX PH41 4QY PH41 4QZ PH41 4RB PH41 4RG PH41 4RH PH41 4RJ PH41 4AB |
Transport near Caol and Mallaig
- FAQ
- Price Paid By Year
Frequently asked questions about Caol and Mallaig
What is the average price for a property for sale in Caol and Mallaig?
The average price for a property for sale in Caol and Mallaig is £159,722. There are 324 property listings for sale in Caol and Mallaig.
What streets have the most expensive properties for sale in Caol and Mallaig?
The streets with the most expensive properties for sale in Caol and Mallaig are East Bay at an average of £130,000 and Victoria Place at an average of £120,000.
What streets have the most affordable properties for sale in Caol and Mallaig?
The street with the most affordable properties for sale in Caol and Mallaig is Gillies Park at an average of £80,000.
Which train stations are available in or near Caol and Mallaig?
Some of the train stations available in or near Caol and Mallaig are Mallaig, Morar and Arisaig.
Property Price Paid in Caol and Mallaig by Year
The average sold property price by year was:
| Year | Average Sold Price | Price Change |
Sold Properties
|
|---|---|---|---|
| 2025 | £80,000 | -58% |
1 Property |
| 2024 | £126,666 | -54% |
3 Properties |
| 2023 | £195,500 | -8% |
5 Properties |
| 2022 | £211,545 | -18% |
20 Properties |
| 2021 | £249,267 | 4% |
20 Properties |
| 2020 | £239,578 | -13% |
19 Properties |
| 2019 | £270,566 | 18% |
23 Properties |
| 2018 | £222,815 | 24% |
16 Properties |
| 2017 | £169,839 | -9% |
16 Properties |
| 2016 | £184,433 | 12% |
27 Properties |
| 2015 | £161,498 | 2% |
9 Properties |
| 2014 | £158,223 | 15% |
19 Properties |
| 2013 | £135,194 | -42% |
12 Properties |
| 2012 | £191,400 | 51% |
5 Properties |
| 2011 | £93,293 | -52% |
6 Properties |
| 2010 | £141,629 | 13% |
11 Properties |
| 2009 | £123,283 | -41% |
20 Properties |
| 2008 | £173,405 | 49% |
20 Properties |
| 2007 | £88,587 | -56% |
24 Properties |
| 2006 | £138,190 | 32% |
32 Properties |
| 2005 | £94,511 | -0,4% |
19 Properties |
| 2004 | £94,866 | 12% |
32 Properties |
| 2003 | £83,545 | 6% |
24 Properties |
| 2002 | £78,525 | - |
17 Properties |

