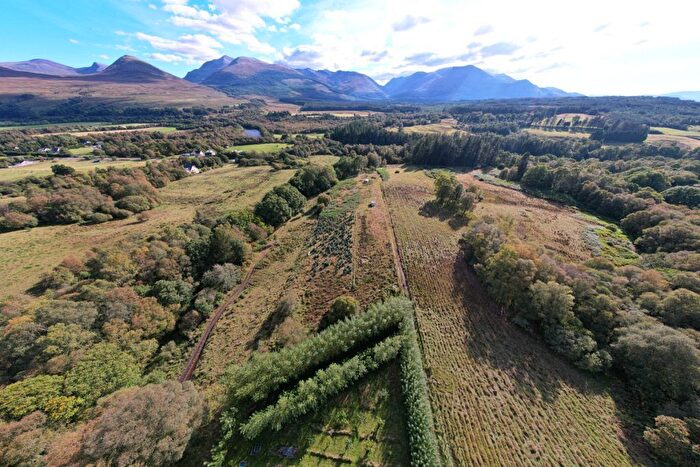
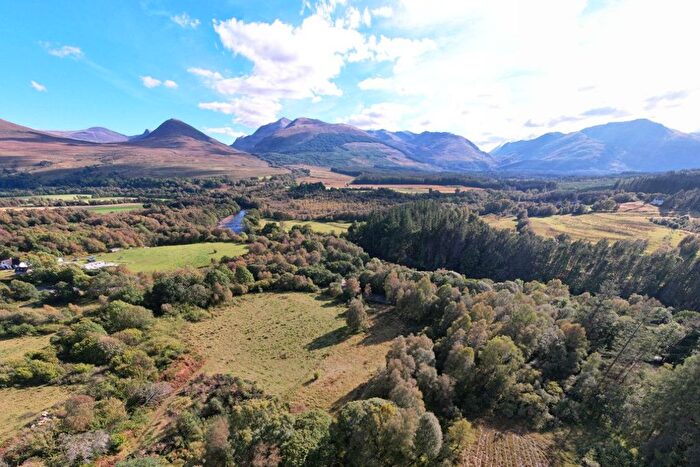
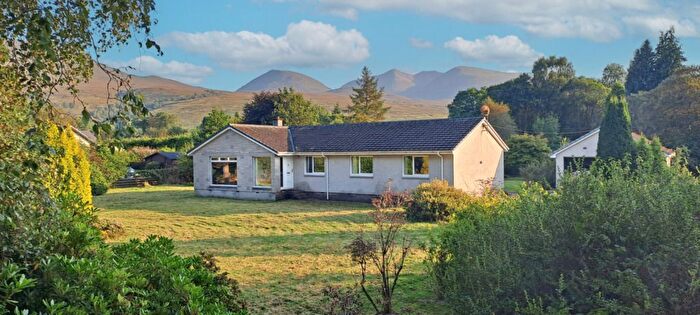
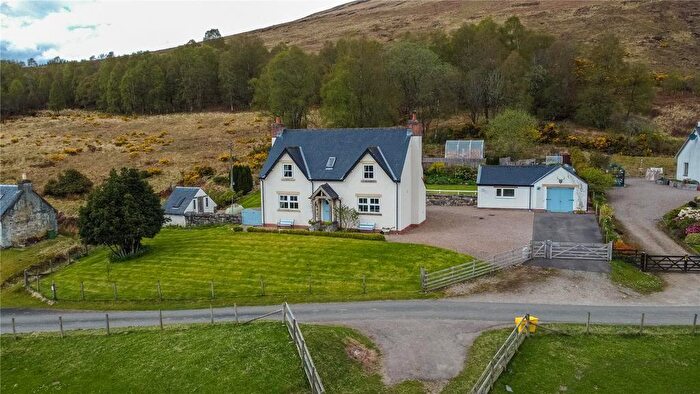
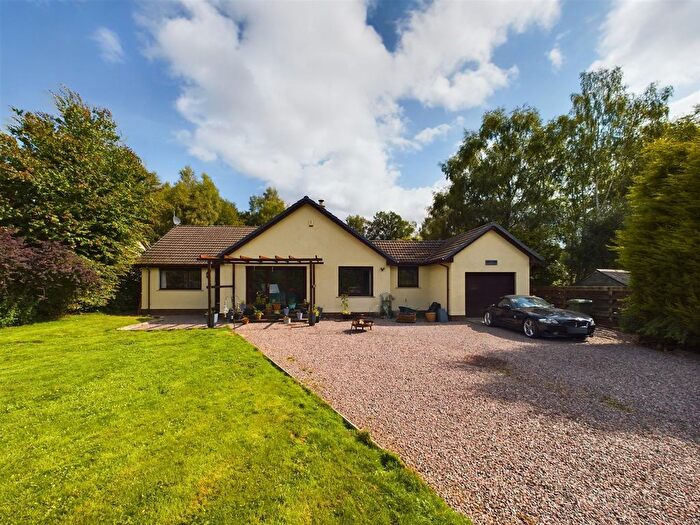
Houses for sale & to rent in Caol and Mallaig, Roy Bridge
House Prices in Caol and Mallaig
Properties in Caol and Mallaig have an average house price of £244,000.00 and had 5 Property Transactions within the last 3 years¹.
Caol and Mallaig is an area in Roy Bridge, Highland with 232 households², where the most expensive property was sold for £363,000.00.
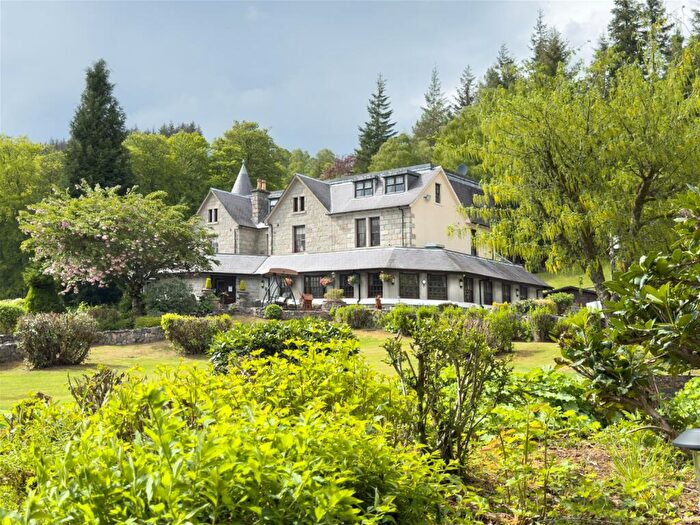
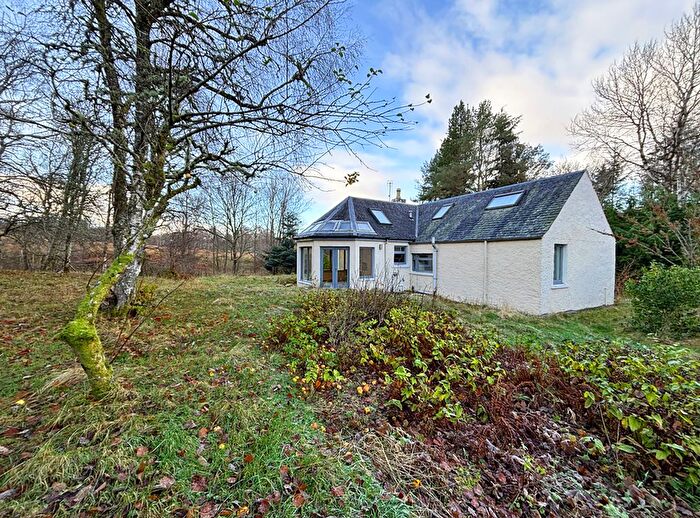
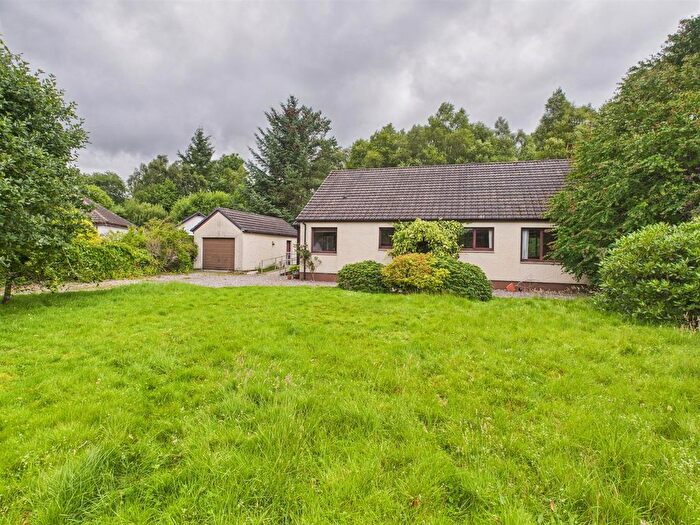
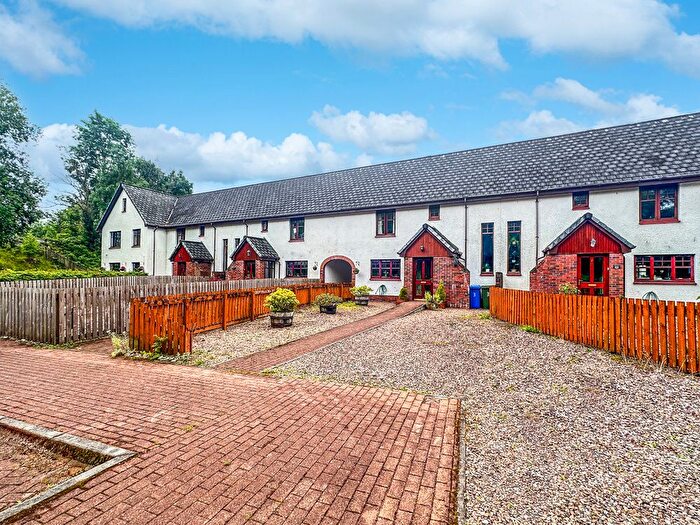
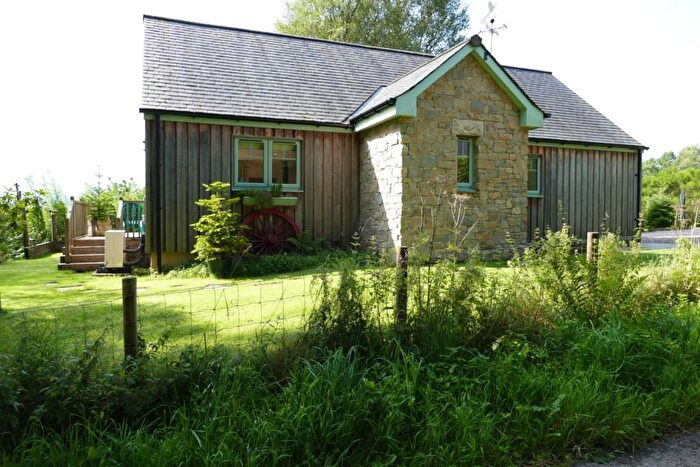
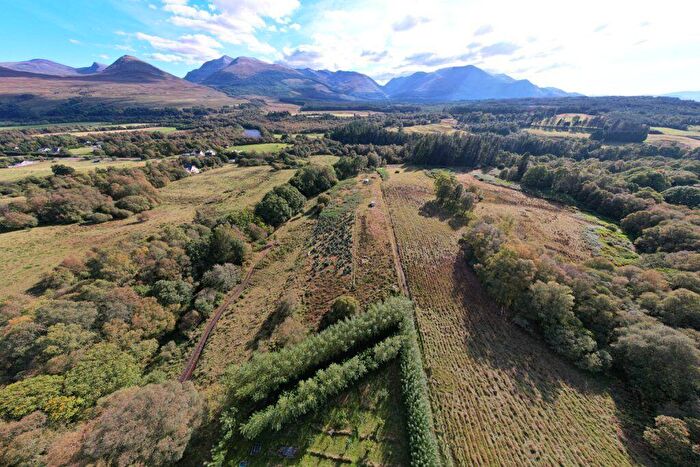
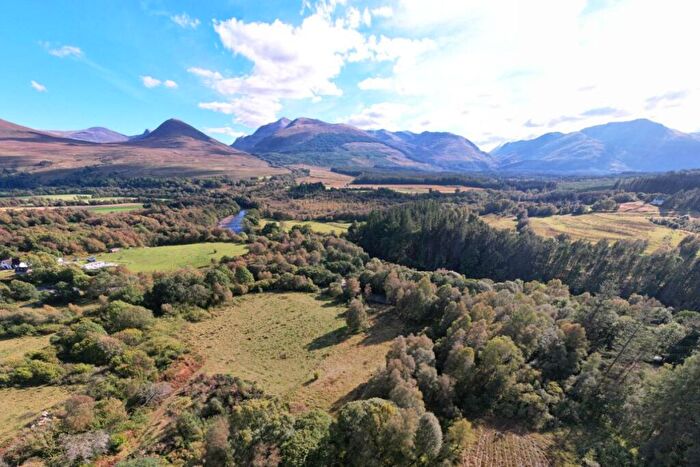
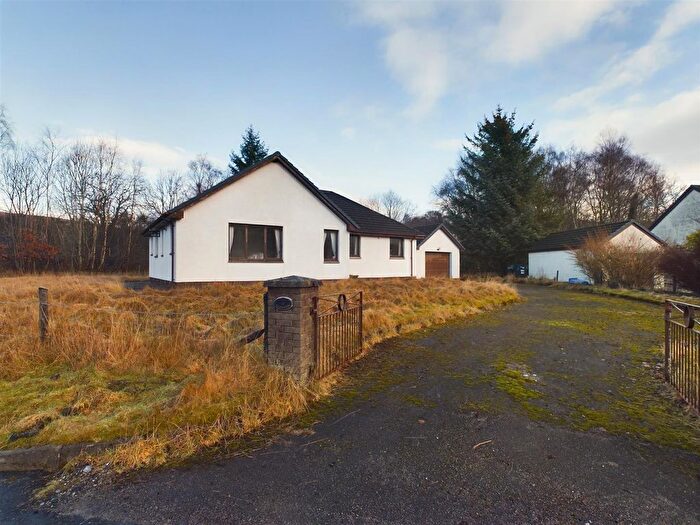
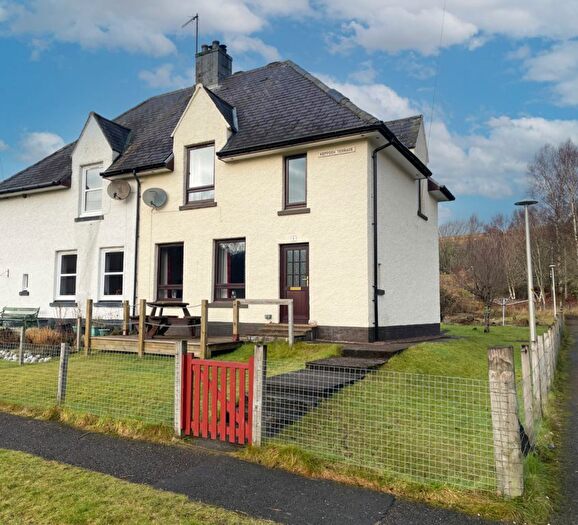
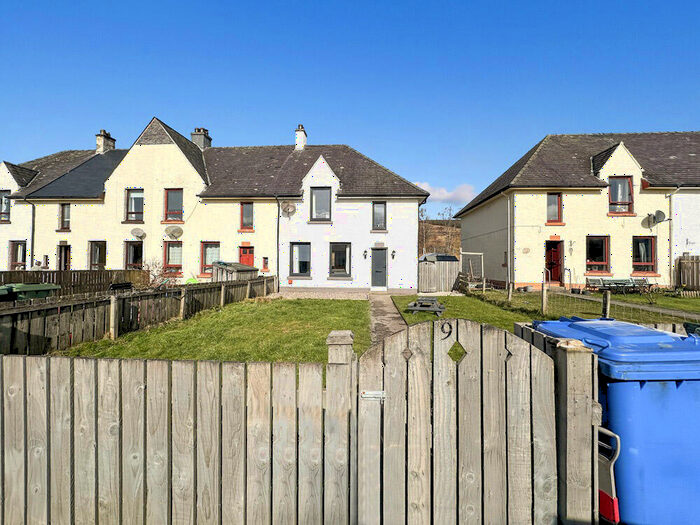
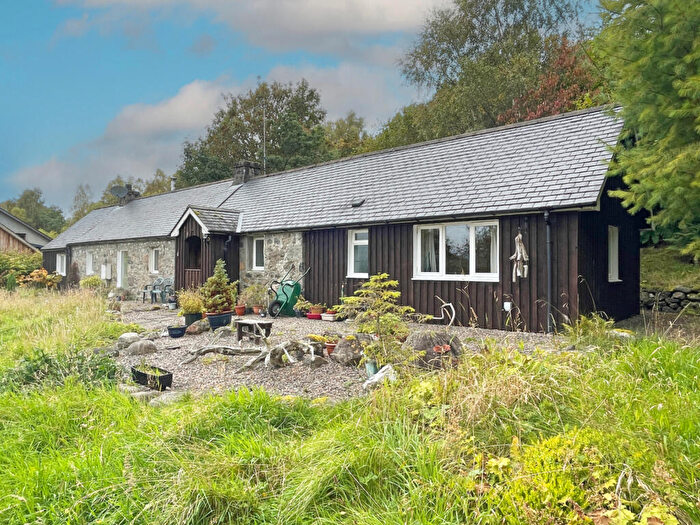
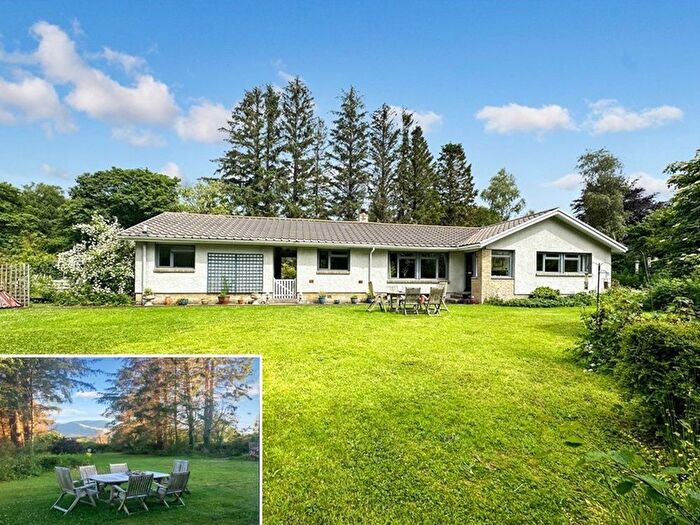
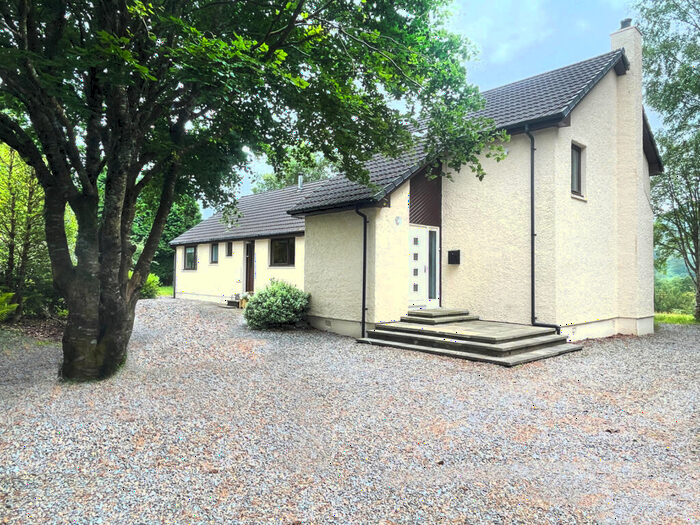
Properties for sale in Caol and Mallaig
Previously listed properties in Caol and Mallaig
Roads and Postcodes in Caol and Mallaig
Navigate through our locations to find the location of your next house in Caol and Mallaig, Roy Bridge for sale or to rent.
| Streets | Postcodes |
|---|---|
| Braeroy Road | PH31 4AJ |
| Glenspean Park | PH31 4AS |
| Keppoch Terrace | PH31 4AD |
| Mulroy Terrace | PH31 4AF |
| PH31 4AE PH31 4AG PH31 4AH PH31 4AN PH31 4AP PH31 4AQ PH31 4AR PH31 4AW |
Transport near Caol and Mallaig
- FAQ
- Price Paid By Year
Frequently asked questions about Caol and Mallaig
What is the average price for a property for sale in Caol and Mallaig?
The average price for a property for sale in Caol and Mallaig is £244,000. There are 46 property listings for sale in Caol and Mallaig.
What streets have the most expensive properties for sale in Caol and Mallaig?
The street with the most expensive properties for sale in Caol and Mallaig is Mulroy Terrace at an average of £210,000.
What streets have the most affordable properties for sale in Caol and Mallaig?
The street with the most affordable properties for sale in Caol and Mallaig is Keppoch Terrace at an average of £197,000.
Which train stations are available in or near Caol and Mallaig?
Some of the train stations available in or near Caol and Mallaig are Roy Bridge, Spean Bridge and Tulloch.
Property Price Paid in Caol and Mallaig by Year
The average sold property price by year was:
| Year | Average Sold Price | Price Change |
Sold Properties
|
|---|---|---|---|
| 2025 | £198,500 | -16% |
2 Properties |
| 2024 | £230,000 | -58% |
2 Properties |
| 2023 | £363,000 | 3% |
1 Property |
| 2022 | £353,218 | 28% |
8 Properties |
| 2021 | £253,363 | -5% |
11 Properties |
| 2020 | £265,333 | 19% |
9 Properties |
| 2019 | £213,750 | -20% |
12 Properties |
| 2018 | £255,700 | 24% |
10 Properties |
| 2017 | £195,100 | -10% |
5 Properties |
| 2016 | £215,055 | -2% |
9 Properties |
| 2015 | £219,576 | 13% |
13 Properties |
| 2014 | £191,000 | -7% |
11 Properties |
| 2013 | £203,925 | -37% |
8 Properties |
| 2012 | £278,666 | 18% |
3 Properties |
| 2011 | £228,487 | 4% |
4 Properties |
| 2010 | £219,000 | 30% |
5 Properties |
| 2009 | £152,500 | -65% |
3 Properties |
| 2008 | £251,833 | 50% |
3 Properties |
| 2007 | £125,554 | -2% |
11 Properties |
| 2006 | £128,141 | 2% |
9 Properties |
| 2005 | £125,328 | 2% |
7 Properties |
| 2004 | £122,255 | 3% |
10 Properties |
| 2003 | £119,137 | 42% |
11 Properties |
| 2002 | £69,172 | - |
9 Properties |

