
Houses for sale & to rent in East Sutherland and Edderton, Tain
House Prices in East Sutherland and Edderton
Properties in East Sutherland and Edderton have an average house price of £125k and had 1 Property Transaction within the last 3 years¹.
East Sutherland and Edderton is an area in Tain, Highland with 146 households², where the most expensive property was sold for £125k.
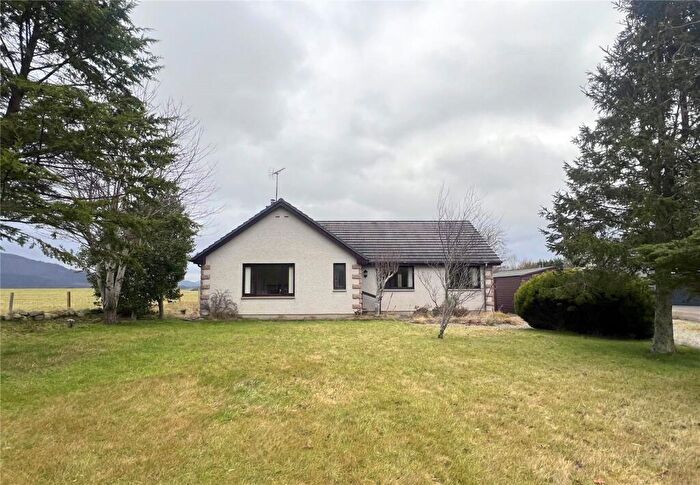
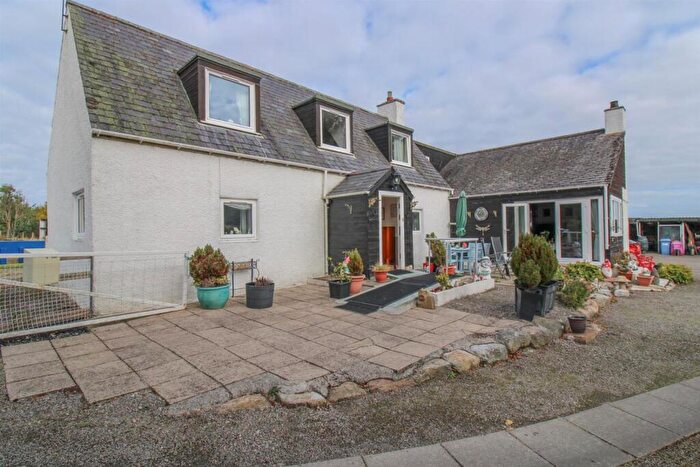
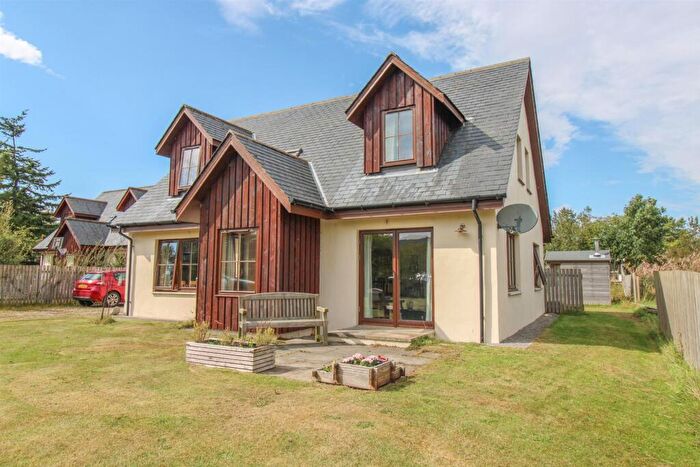
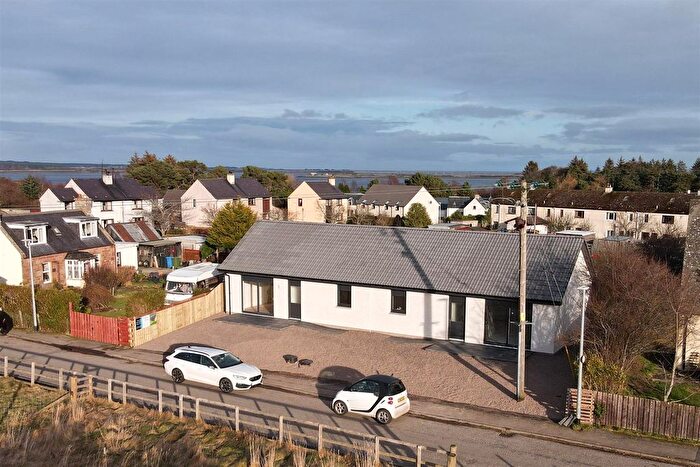
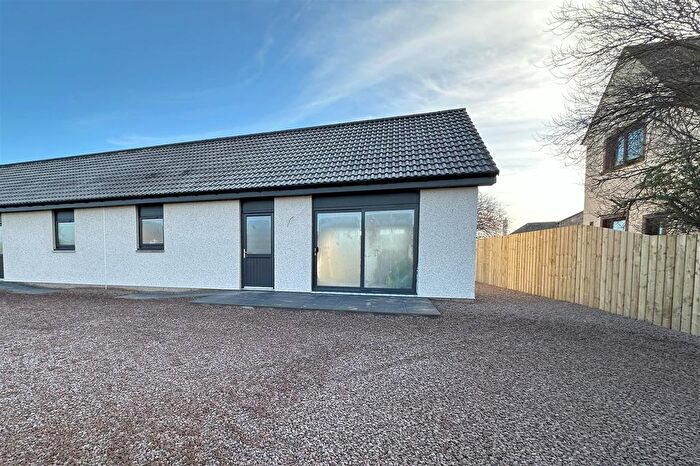
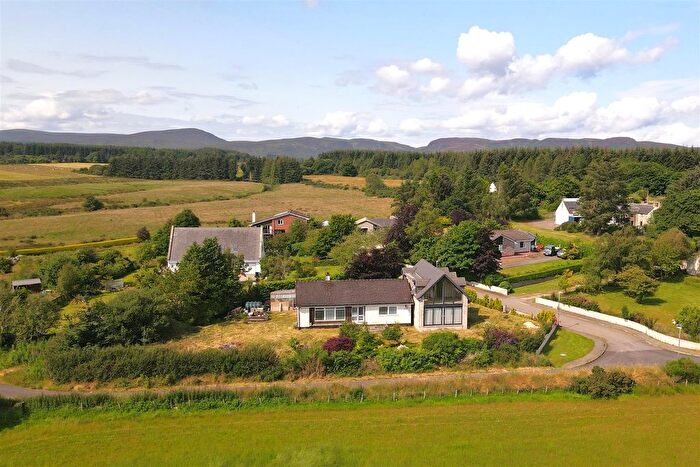
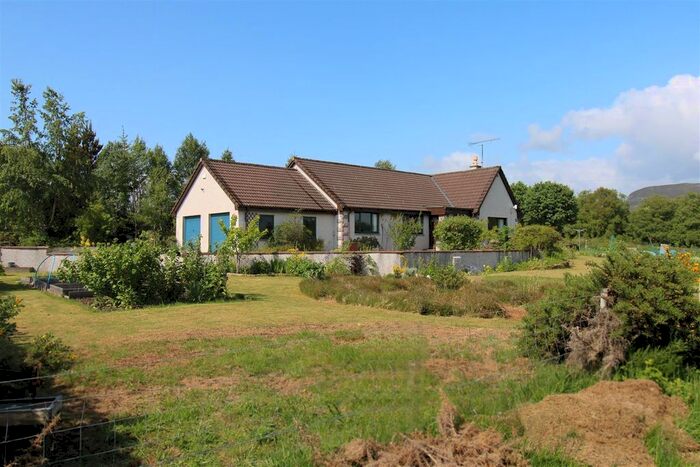
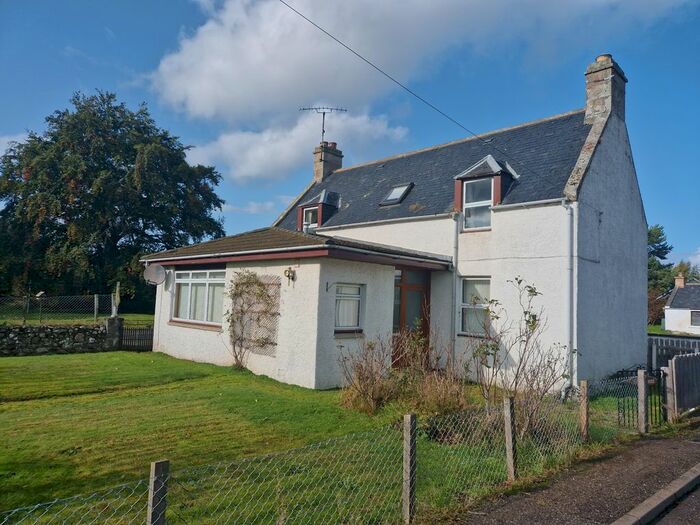
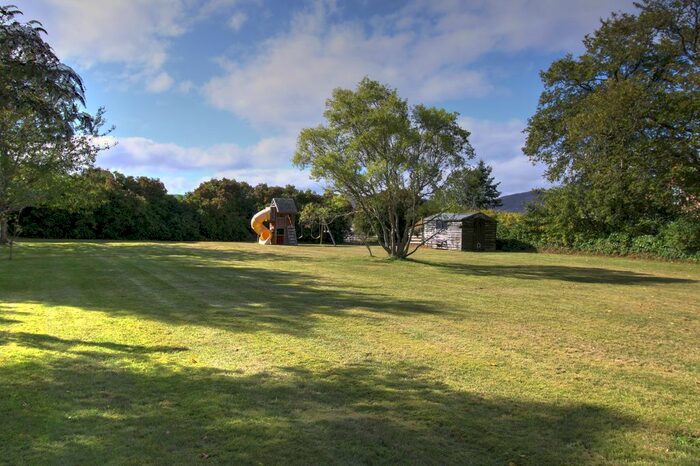
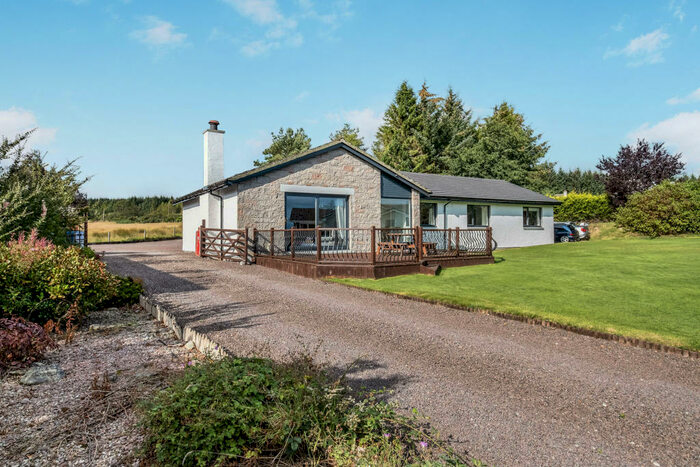
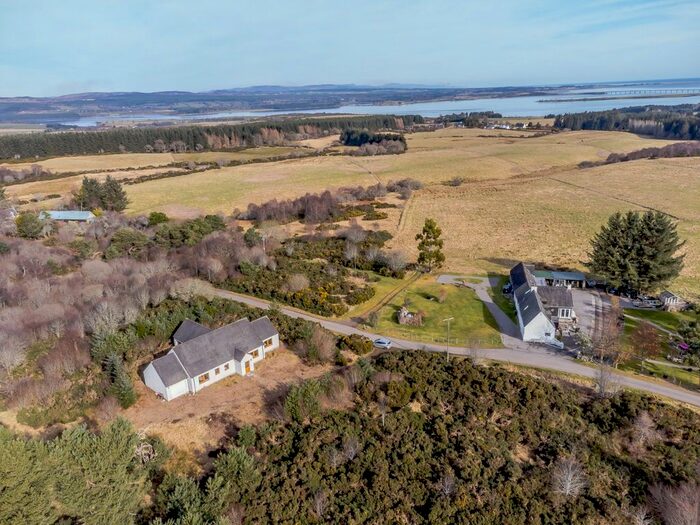
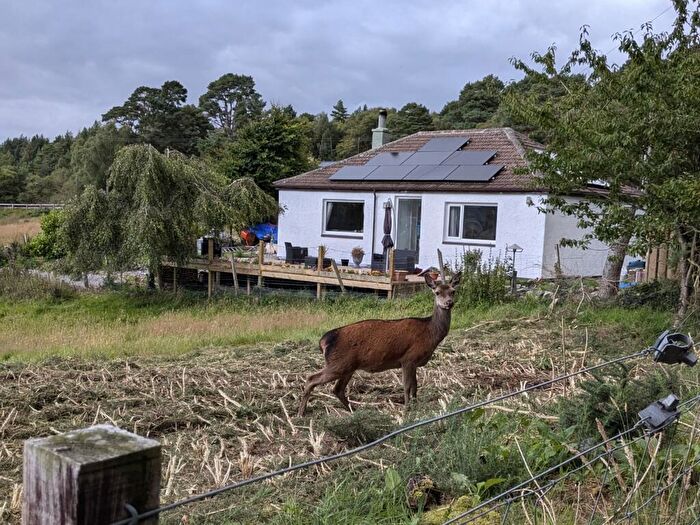
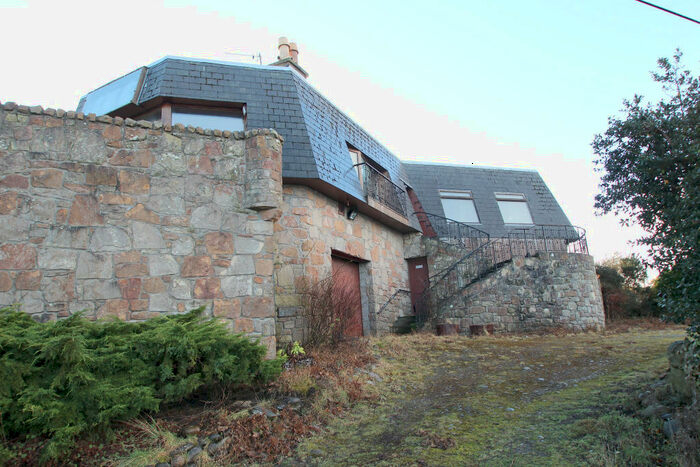
Properties for sale in East Sutherland and Edderton
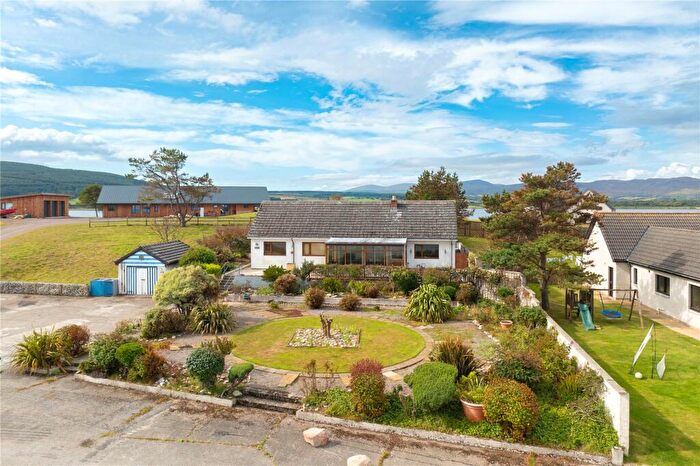
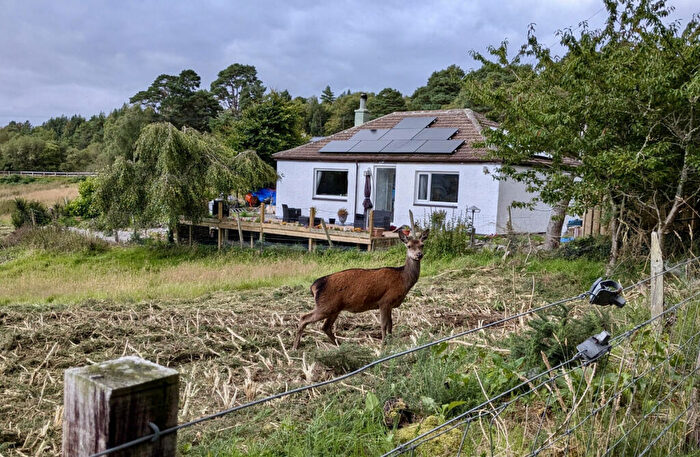
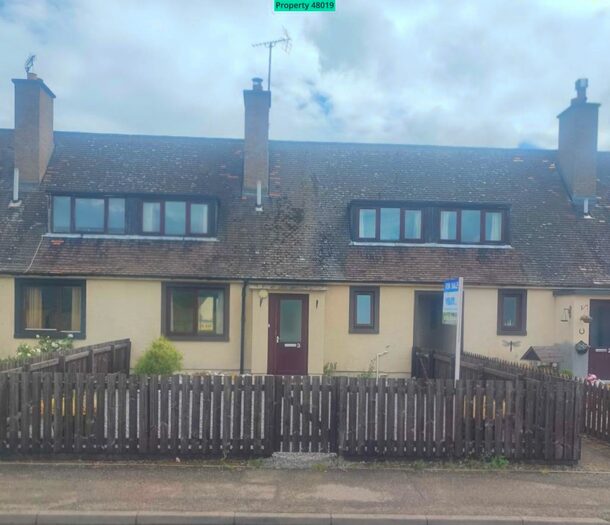
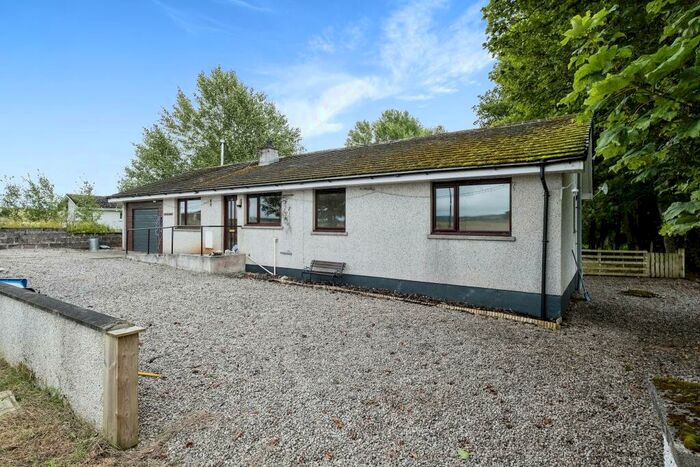
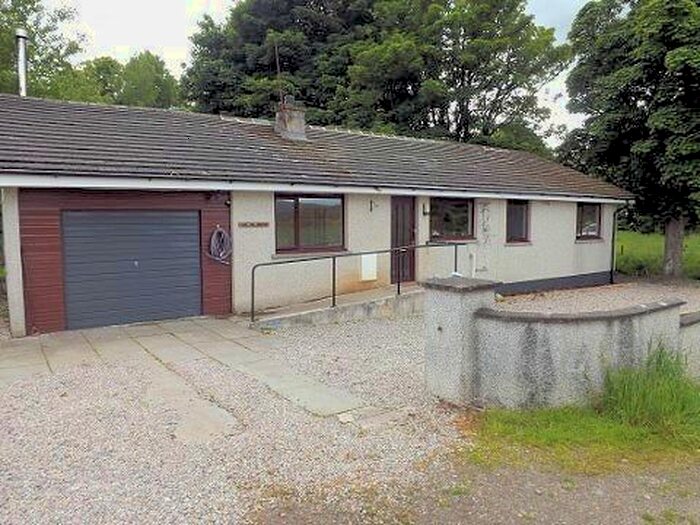
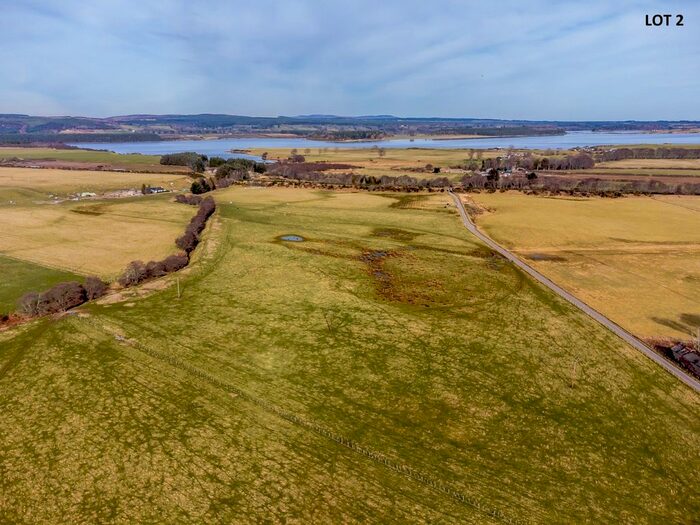
Previously listed properties in East Sutherland and Edderton
![]()
If you are looking to sell your house, let it out, or receive a property valuation, an expert can help you.
Click the button below to get started.


Roads and Postcodes in East Sutherland and Edderton
Navigate through our locations to find the location of your next house in East Sutherland and Edderton, Tain for sale or to rent.
| Streets | Postcodes |
|---|---|
| Carrieblair Crescent | IV19 1JZ |
| Dounie | IV19 1LN |
| Station Road | IV19 1LA |
| IV19 1JU IV19 1JX IV19 1JY IV19 1LB IV19 1LD IV19 1LE IV19 1LF IV19 1LG IV19 1LH IV19 1LJ IV19 1LQ IV19 1NL |
Transport near East Sutherland and Edderton

- FAQ
- Price Paid By Year
Frequently asked questions about East Sutherland and Edderton
What is the average price for a property for sale in East Sutherland and Edderton?
The average price for a property for sale in East Sutherland and Edderton is £125,000. This amount is 27% lower than the average price in Tain. There are 22 property listings for sale in East Sutherland and Edderton.
Which train stations are available in or near East Sutherland and Edderton?
Some of the train stations available in or near East Sutherland and Edderton are Tain, Ardgay and Fearn.
Property Price Paid in East Sutherland and Edderton by Year
The average sold property price by year was:
| Year | Average Sold Price | Price Change |
Sold Properties
|
|---|---|---|---|
| 2023 | £125,000 | -113% |
1 Property |
| 2022 | £266,364 | -1% |
9 Properties |
| 2021 | £267,800 | 33% |
5 Properties |
| 2020 | £179,600 | 12% |
5 Properties |
| 2019 | £158,666 | -85% |
6 Properties |
| 2018 | £294,000 | 36% |
2 Properties |
| 2017 | £187,888 | 14% |
9 Properties |
| 2016 | £161,944 | 29% |
9 Properties |
| 2015 | £114,958 | -122% |
6 Properties |
| 2014 | £255,333 | 52% |
3 Properties |
| 2013 | £122,786 | -31% |
4 Properties |
| 2012 | £160,780 | 7% |
9 Properties |
| 2010 | £150,000 | -14% |
3 Properties |
| 2009 | £170,285 | 30% |
7 Properties |
| 2008 | £119,857 | -21% |
7 Properties |
| 2007 | £144,562 | 4% |
8 Properties |
| 2006 | £138,500 | 34% |
12 Properties |
| 2005 | £91,777 | 1% |
9 Properties |
| 2004 | £90,528 | -43% |
10 Properties |
| 2003 | £129,333 | 40% |
6 Properties |
| 2000 | £78,000 | - |
1 Property |