
Houses for sale & to rent in ML6 7JP, Northburn Street, Airdrie North, Airdrie
House Prices in ML6 7JP, Northburn Street, Airdrie North
Properties in ML6 7JP have no sales history available within the last 3 years. ML6 7JP is a postcode in Northburn Street located in Airdrie North, an area in Airdrie, North Lanarkshire, with 10 households².
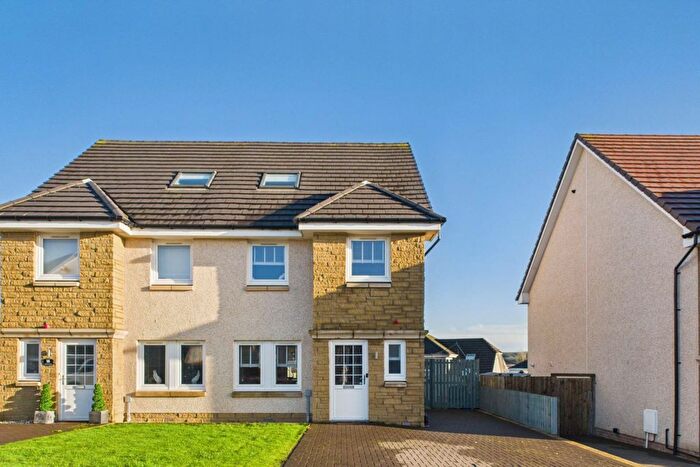
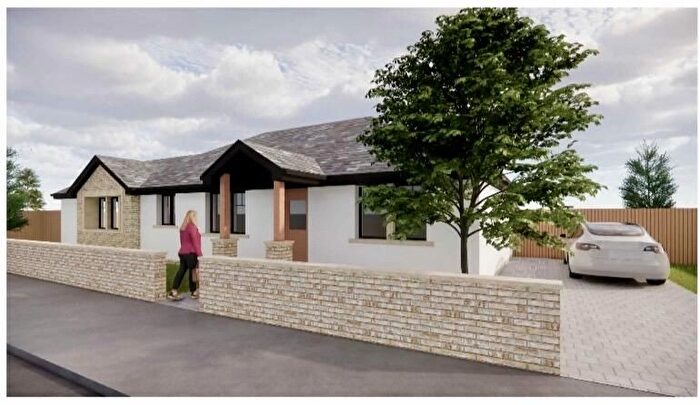
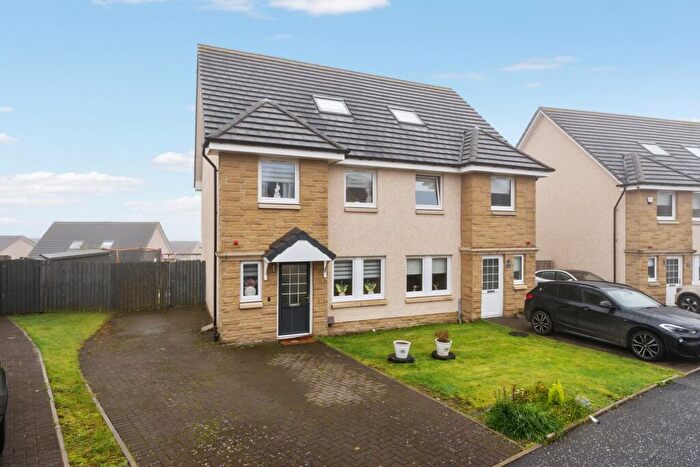
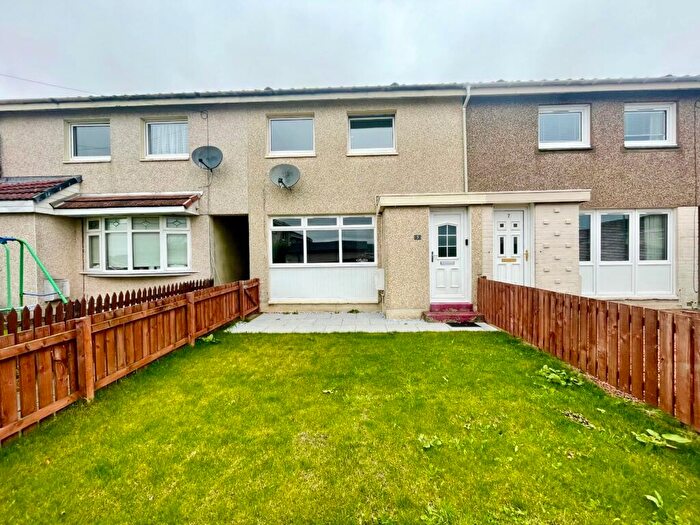
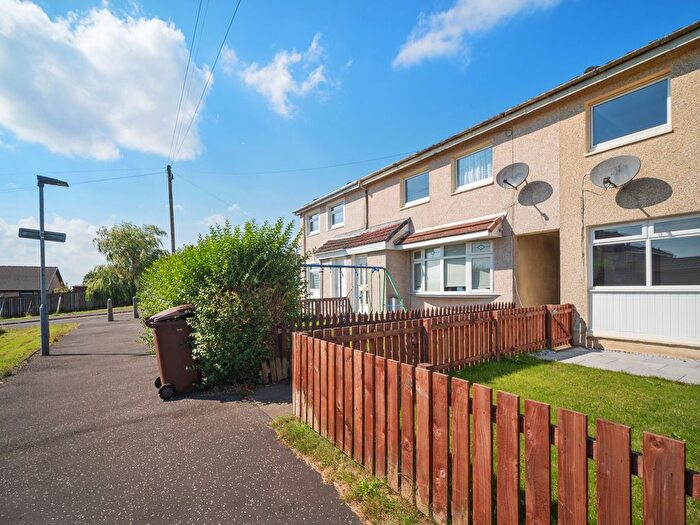
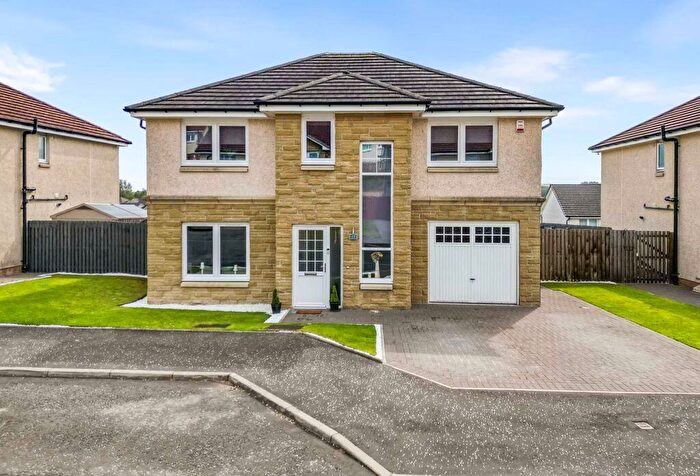
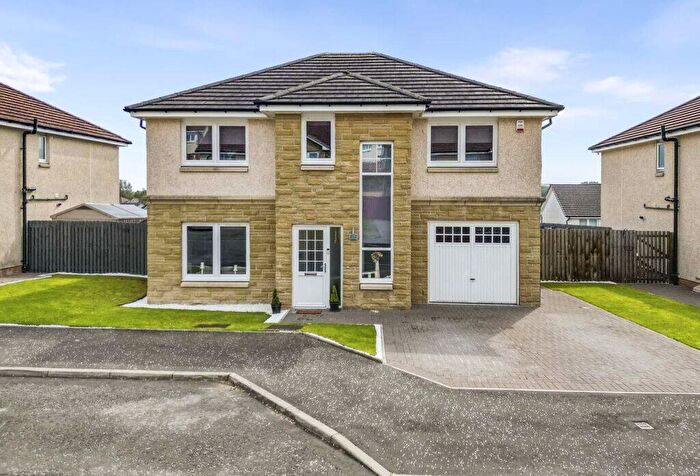
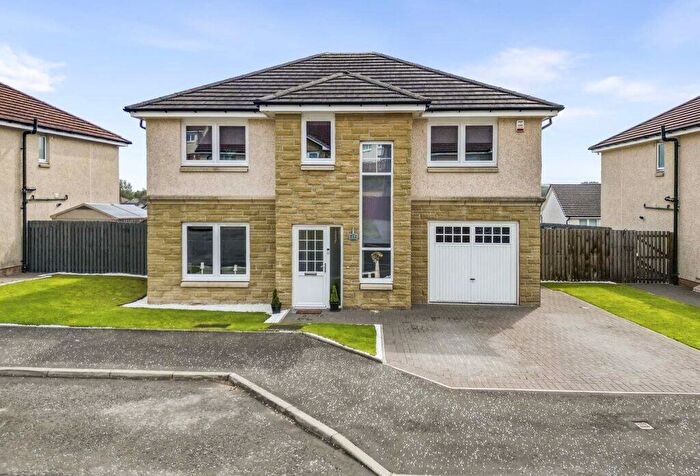
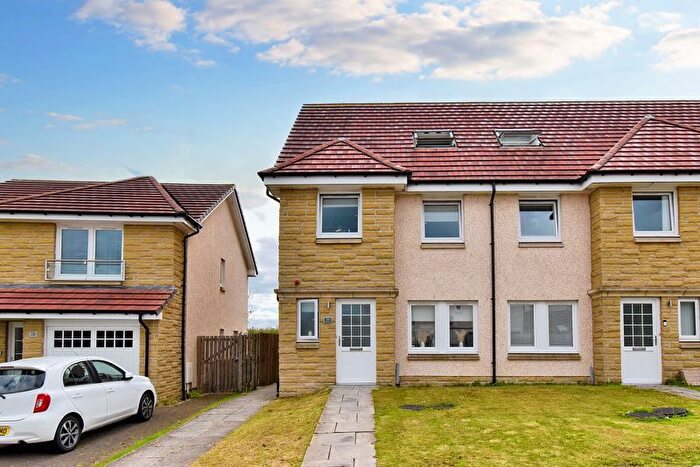
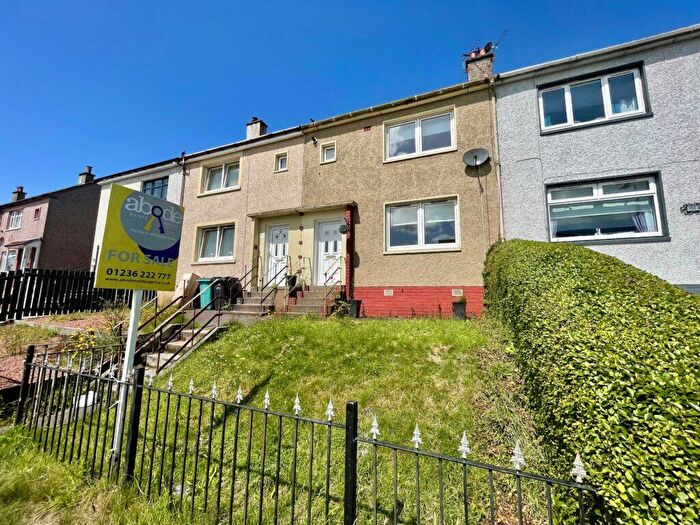
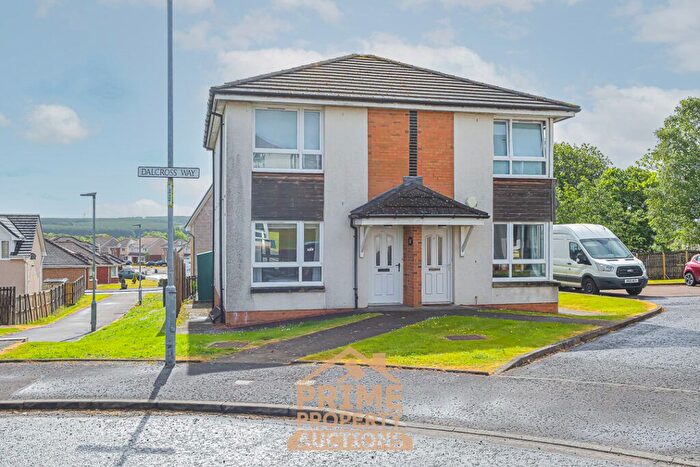
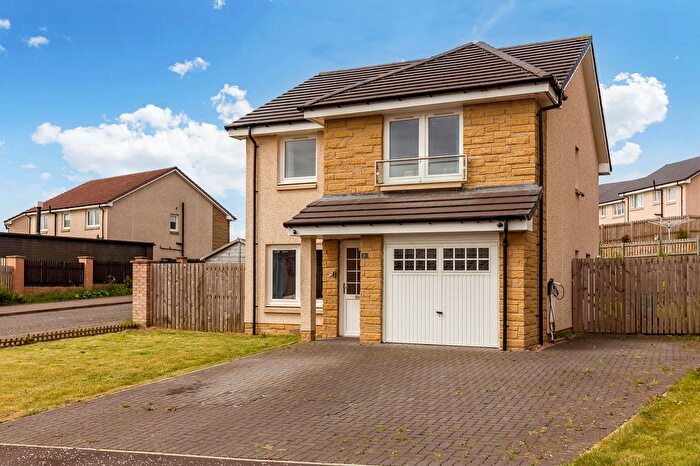
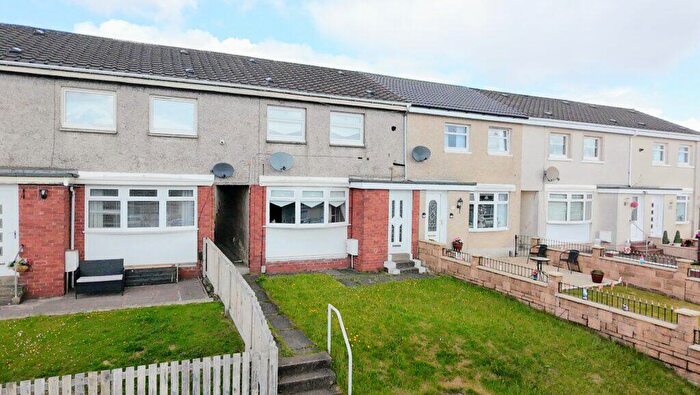
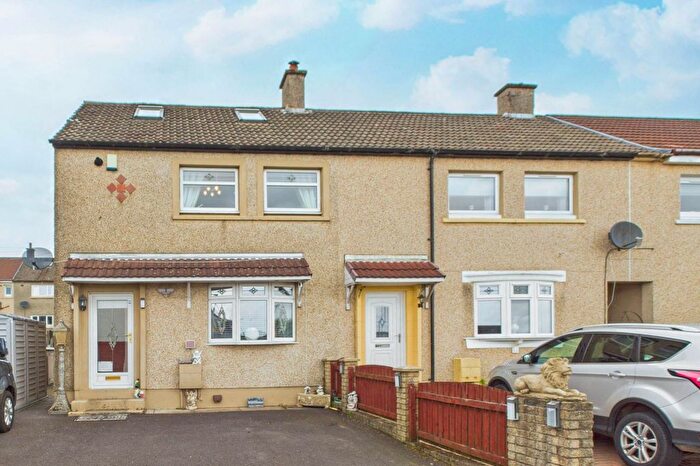
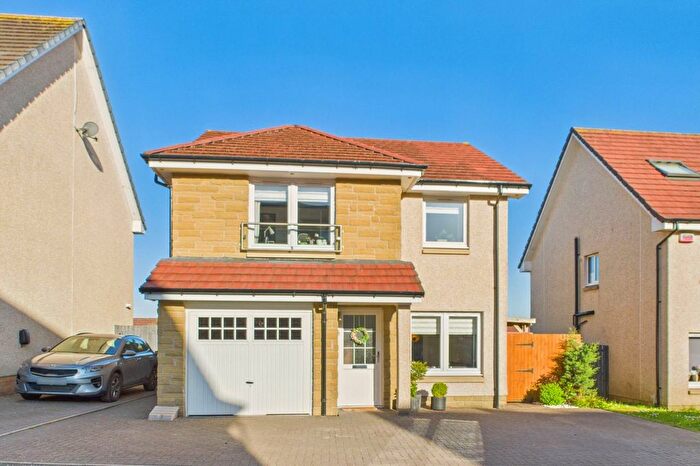
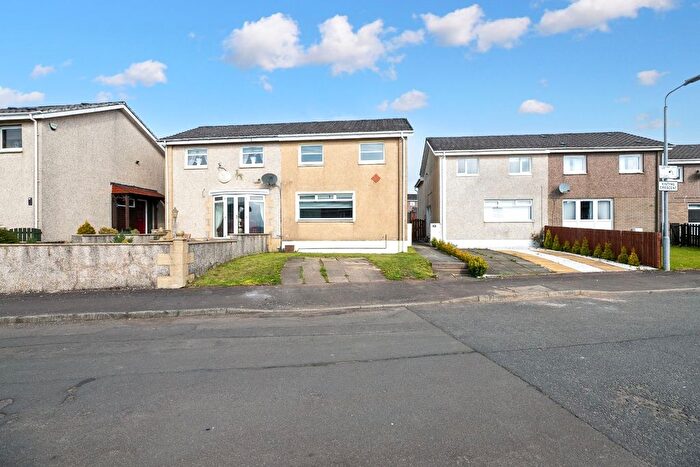
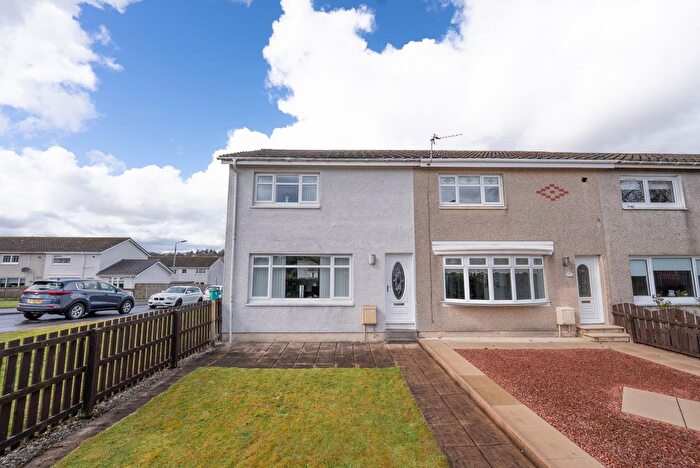
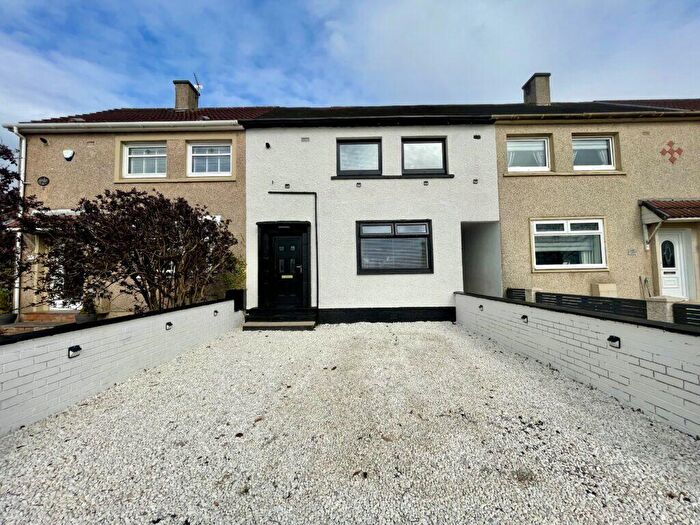
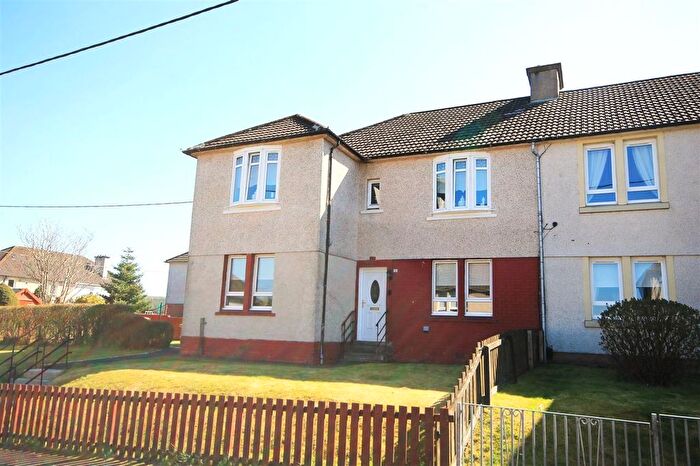
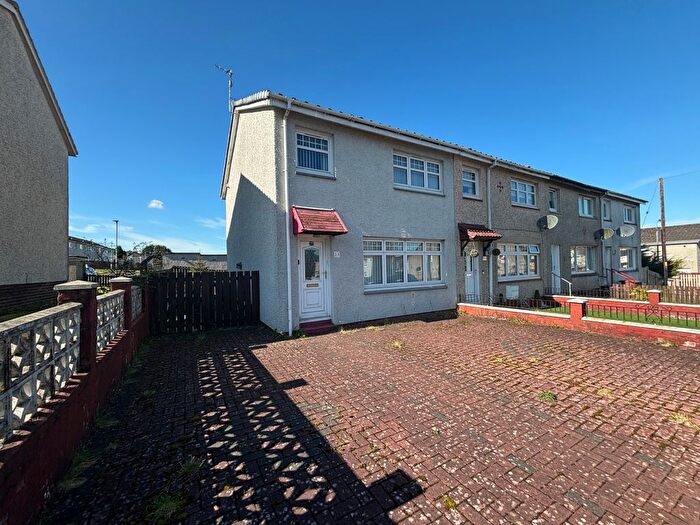
Properties for sale near ML6 7JP, Northburn Street
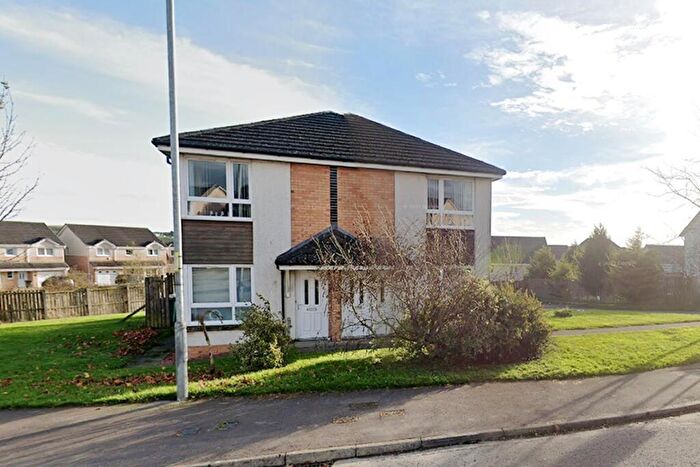
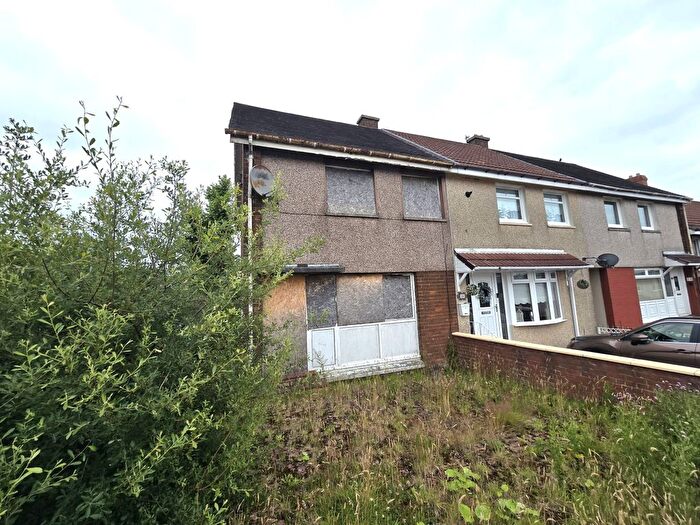
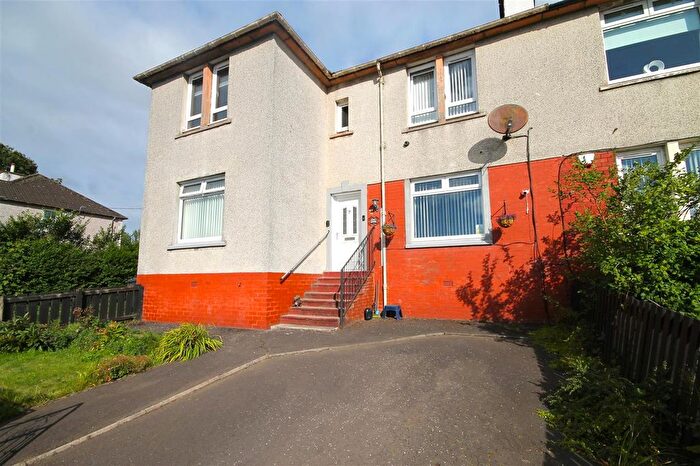
Previously listed properties near ML6 7JP, Northburn Street
![]()
If you are looking to sell your house, let it out, or receive a property valuation, an expert can help you.
Click the button below to get started.

Price Paid in Northburn Street, ML6 7JP, Airdrie North
4 Northburn Street, ML6 7JP, Airdrie North Airdrie
Property 4 has been sold 4 times. The last time it was sold was in 23/04/2021 and the sold price was £65,000.00.
This is a Property which was sold as an Established Building in 23/04/2021
| Date | Price | Classification |
|---|---|---|
| 23/04/2021 | £65,000.00 | Established Building |
| 04/11/2008 | £45,000.00 | Established Building |
| 01/10/2004 | £35,000.00 | Established Building |
| 19/08/2002 | £26,995.00 | Established Building |
6 Northburn Street, ML6 7JP, Airdrie North Airdrie
Property 6 has been sold 3 times. The last time it was sold was in 22/08/2016 and the sold price was £40,000.00.
This is a Property which was sold as an Established Building in 22/08/2016
| Date | Price | Classification |
|---|---|---|
| 22/08/2016 | £40,000.00 | Established Building |
| 18/05/2011 | £50,100.00 | Established Building |
| 20/03/2003 | £29,950.00 | Established Building |
2 Northburn Street, ML6 7JP, Airdrie North Airdrie
Property 2 has been sold 1 time. The last time it was sold was in 15/04/2004 and the sold price was £22,995.00.
This is a Property which was sold as an Established Building in 15/04/2004
| Date | Price | Classification |
|---|---|---|
| 15/04/2004 | £22,995.00 | Established Building |
Transport near ML6 7JP, Northburn Street

House price paid reports for ML6 7JP, Northburn Street
Click on the buttons below to see price paid reports by year or property price:
- Price Paid By Year
Property Price Paid in ML6 7JP, Northburn Street by Year
The average sold property price by year was:
| Year | Average Sold Price | Price Change |
Sold Properties
|
|---|---|---|---|
| 2021 | £65,000 | 38% |
1 Property |
| 2016 | £40,000 | -25% |
1 Property |
| 2011 | £50,100 | 10% |
1 Property |
| 2008 | £45,000 | 36% |
1 Property |
| 2004 | £28,997 | -3% |
2 Properties |
| 2003 | £29,950 | 10% |
1 Property |
| 2002 | £26,995 | - |
1 Property |