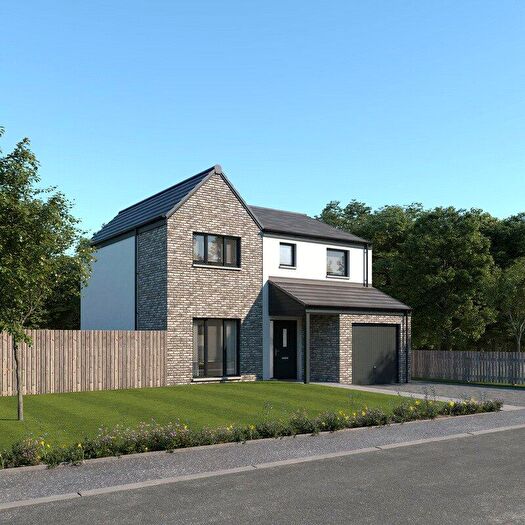
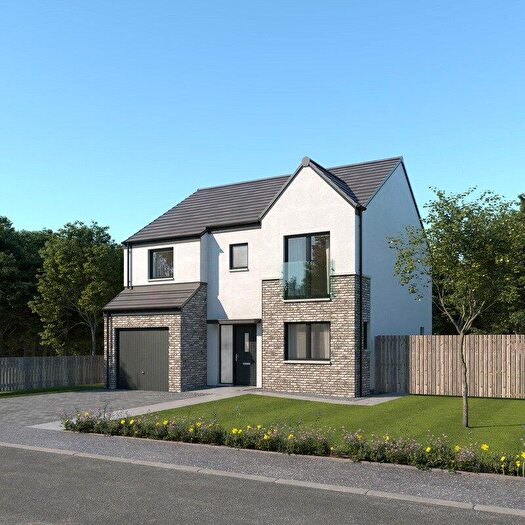
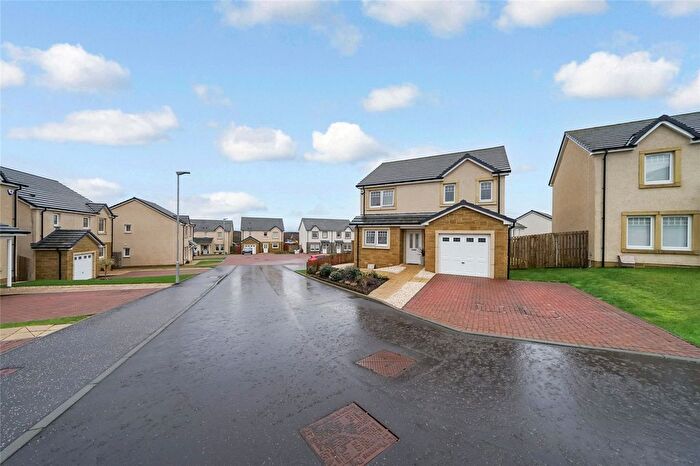
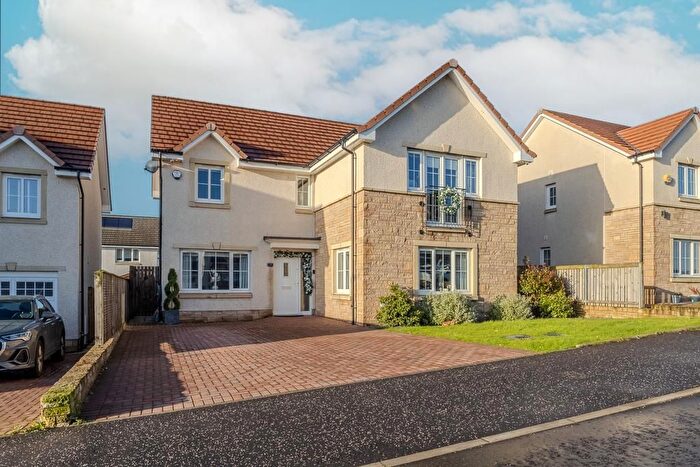
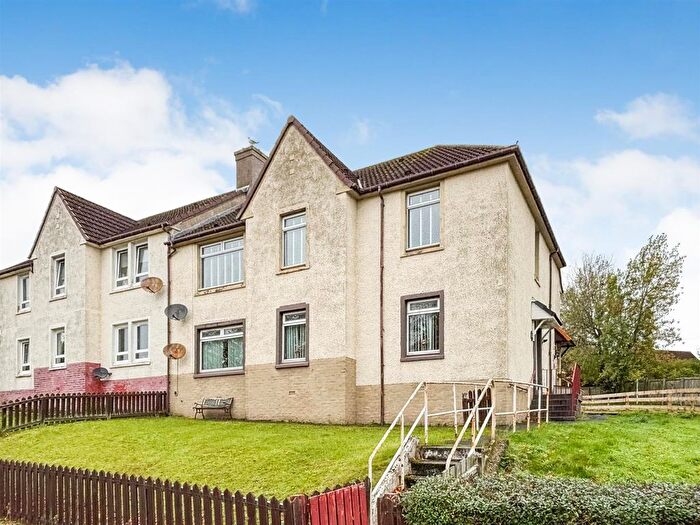
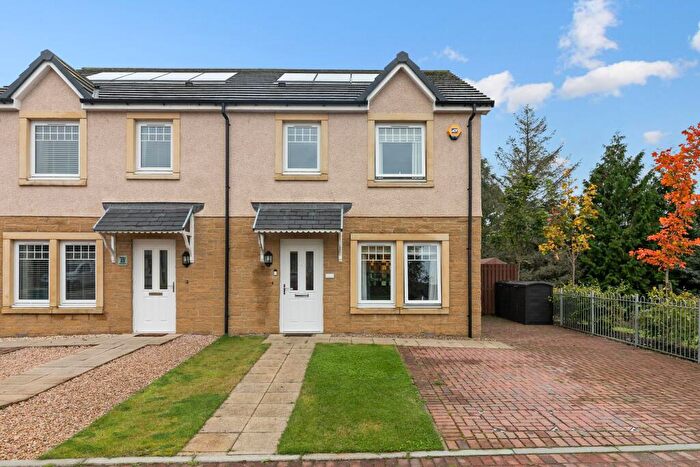
Houses for sale & to rent in Gartcosh, Glenboig and Moodiesburn, Coatbridge
House Prices in Gartcosh, Glenboig and Moodiesburn
Properties in Gartcosh, Glenboig and Moodiesburn have an average house price of £200,533.00 and had 49 Property Transactions within the last 3 years¹.
Gartcosh, Glenboig and Moodiesburn is an area in Coatbridge, North Lanarkshire with 1,176 households², where the most expensive property was sold for £409,500.00.
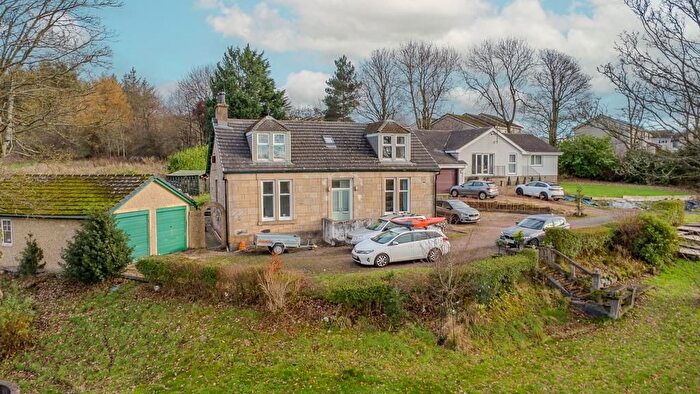
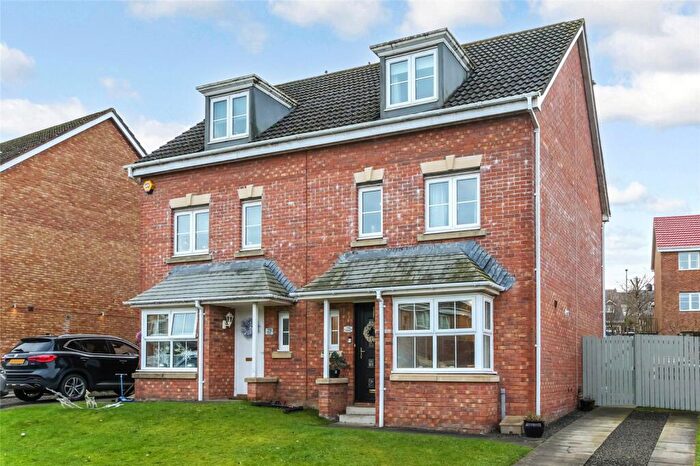
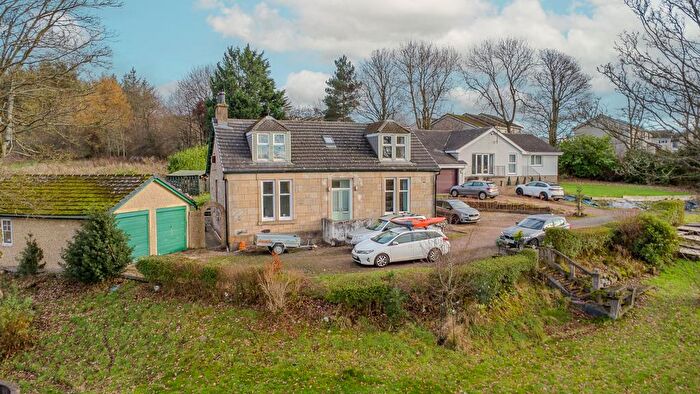
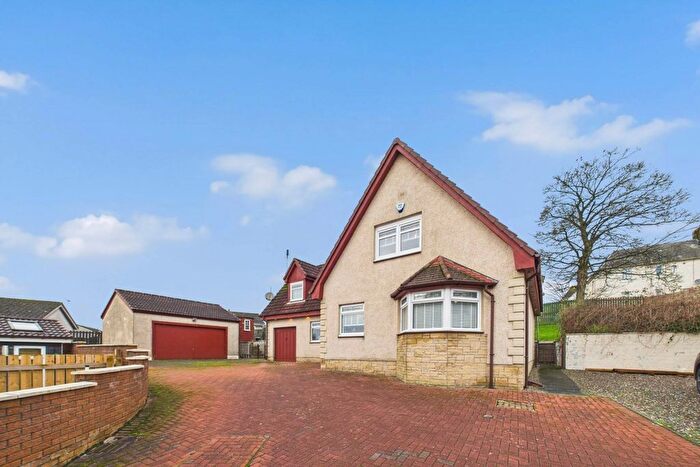
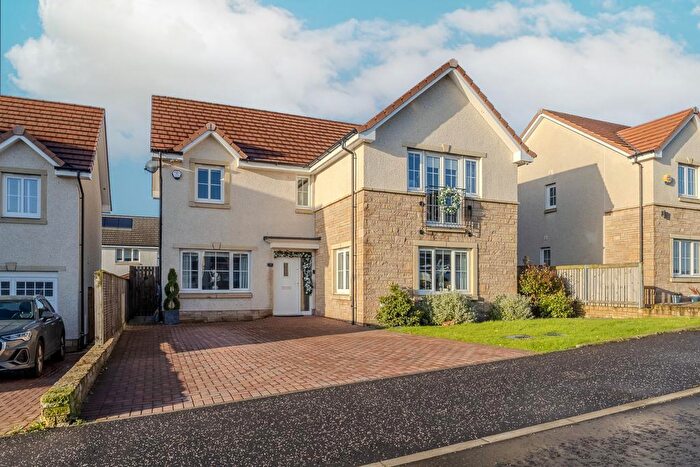
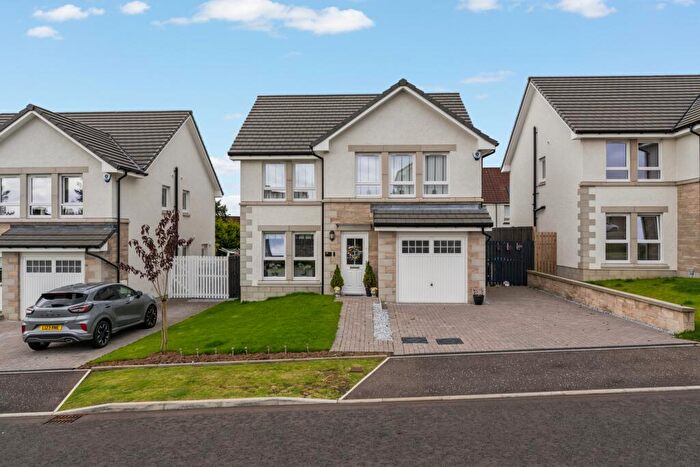
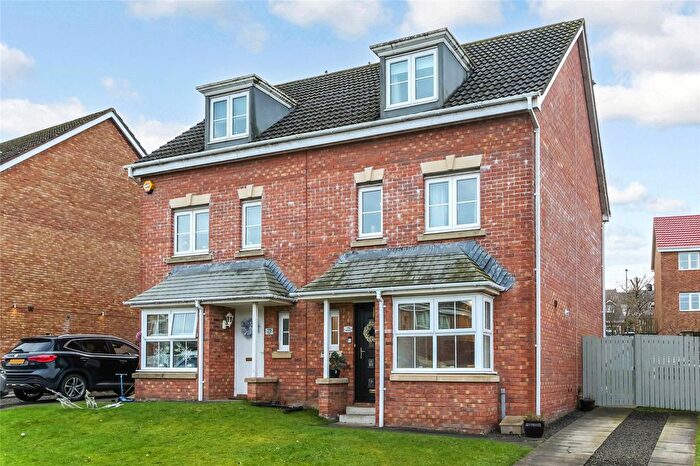
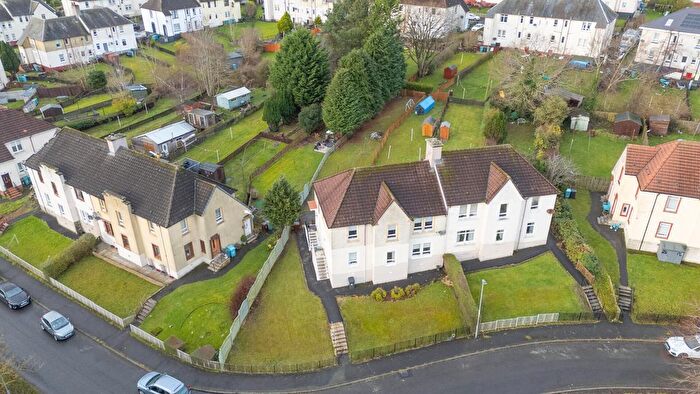
Properties for sale in Gartcosh, Glenboig and Moodiesburn
Previously listed properties in Gartcosh, Glenboig and Moodiesburn
Roads and Postcodes in Gartcosh, Glenboig and Moodiesburn
Navigate through our locations to find the location of your next house in Gartcosh, Glenboig and Moodiesburn, Coatbridge for sale or to rent.
| Streets | Postcodes |
|---|---|
| Annathill | ML5 2QQ |
| Annathill Gardens | ML5 2QP |
| Ballater Way | ML5 2RP |
| Baron Place | ML5 2TU |
| Bedlay Place | ML5 2QR |
| Belhaven Place | ML5 2TE |
| Birkwood Court | ML5 2TD |
| Cannock Grove | ML5 2TL |
| Carmichael Path | ML5 2SA |
| Carrick Place | ML5 2QS |
| Carrick View | ML5 2QW |
| Carsaig Loan | ML5 2SH |
| Centre Street | ML5 2RY |
| Chapelbank Drive | ML5 2FS |
| Chapman Avenue | ML5 2RR |
| Coatbridge Road | ML5 2PU G69 8GU |
| Dalby Grove | ML5 2TN |
| David Shaw Way | ML5 2TY |
| Delamere Grove | ML5 2TG |
| Dinyra Place | ML5 2SW |
| Dumbarton Drive | ML5 2TQ |
| Eaglesham Path | ML5 2SL |
| Easdale Path | ML5 2SB |
| East Gate | ML5 2RH |
| Farm Lane | ML5 2RG |
| Gain Road | ML5 2QG |
| Gainside Road | ML5 2SD ML5 2SE |
| Garnqueen Crescent | ML5 2SX ML5 2SY |
| Gartgill Road | ML5 2EQ |
| Gartliston Road | ML5 2FG |
| Gartsherrie Avenue | ML5 2PY |
| Gayne Drive | ML5 2RJ ML5 2RN |
| Glenboig Cottages | ML5 2QZ |
| Glenboig Farm Road | ML5 2RA |
| Glenburn Gardens | ML5 2SP |
| Glenelg Path | ML5 2SG |
| Glenheath Drive | ML5 2SU |
| Haldon Grove | ML5 2TP |
| Hawthorn Way | ML5 2FT |
| Hillside Cottages | ML5 2QY |
| Inchneuk Path | ML5 2BB |
| Inchneuk Road | ML5 2QX |
| Invercree Walk | ML5 2SQ |
| Jock Shaw Drive | ML5 2TX |
| Jura Wynd | ML5 2RW |
| Kilkeel Avenue | ML5 2TT |
| Longwalk Crescent | ML5 2TS |
| Main Street | ML5 2QT ML5 2RD |
| Marnoch Drive | ML5 2RE ML5 2RF |
| Mcgregor Path | ML5 2SN |
| Mollinsburn Road | ML5 2QB ML5 2QE |
| Monkland Terrace | ML5 2RL |
| Myrtle Place | ML5 2TW |
| New Road | ML5 2QD |
| Rockbank Crescent | ML5 2TA ML5 2TB |
| Ruthven Lane | ML5 2RS |
| Sherwood Road | ML5 2TF |
| South Medrox Street | ML5 2RU |
| Strone Path | ML5 2SF |
| Sussex Grove | ML5 2TR |
| The Oval | ML5 2RT ML5 2RX ML5 2RZ |
| Thetford Grove | ML5 2TH |
| Viewbank Street | ML5 2PZ |
| Westonbirt Grove | ML5 2TJ |
| Whitelaw Avenue | ML5 2PX |
| ML5 2QF ML5 2QH ML5 2QL ML5 2QN |
Transport near Gartcosh, Glenboig and Moodiesburn
-
Gartcosh Station
-
Blairhill Station
-
Coatbridge Sunnyside Station
-
Coatbridge Central Station
-
Coatdyke Station
-
Kirkwood Station
- FAQ
- Price Paid By Year
Frequently asked questions about Gartcosh, Glenboig and Moodiesburn
What is the average price for a property for sale in Gartcosh, Glenboig and Moodiesburn?
The average price for a property for sale in Gartcosh, Glenboig and Moodiesburn is £200,533. This amount is 32% higher than the average price in Coatbridge. There are 392 property listings for sale in Gartcosh, Glenboig and Moodiesburn.
Which train stations are available in or near Gartcosh, Glenboig and Moodiesburn?
Some of the train stations available in or near Gartcosh, Glenboig and Moodiesburn are Gartcosh, Blairhill and Coatbridge Sunnyside.
Property Price Paid in Gartcosh, Glenboig and Moodiesburn by Year
The average sold property price by year was:
| Year | Average Sold Price | Price Change |
Sold Properties
|
|---|---|---|---|
| 2023 | £168,083 | -28% |
15 Properties |
| 2022 | £214,849 | 9% |
34 Properties |
| 2021 | £194,695 | 1% |
52 Properties |
| 2020 | £193,383 | 15% |
56 Properties |
| 2019 | £163,665 | 3% |
36 Properties |
| 2018 | £159,335 | 29% |
43 Properties |
| 2017 | £112,958 | -22% |
29 Properties |
| 2016 | £137,803 | 6% |
56 Properties |
| 2015 | £129,814 | 7% |
38 Properties |
| 2014 | £121,366 | 1% |
45 Properties |
| 2013 | £120,071 | 2% |
35 Properties |
| 2012 | £117,374 | -3% |
18 Properties |
| 2011 | £120,880 | -11% |
37 Properties |
| 2010 | £134,066 | 8% |
29 Properties |
| 2009 | £122,796 | -8% |
25 Properties |
| 2008 | £133,081 | 1% |
39 Properties |
| 2007 | £131,590 | 25% |
58 Properties |
| 2006 | £98,806 | -129% |
66 Properties |
| 2005 | £226,148 | 80% |
54 Properties |
| 2004 | £44,701 | -115% |
40 Properties |
| 2003 | £96,302 | 61% |
36 Properties |
| 2002 | £37,211 | 30% |
48 Properties |
| 2001 | £26,231 | - |
7 Properties |

