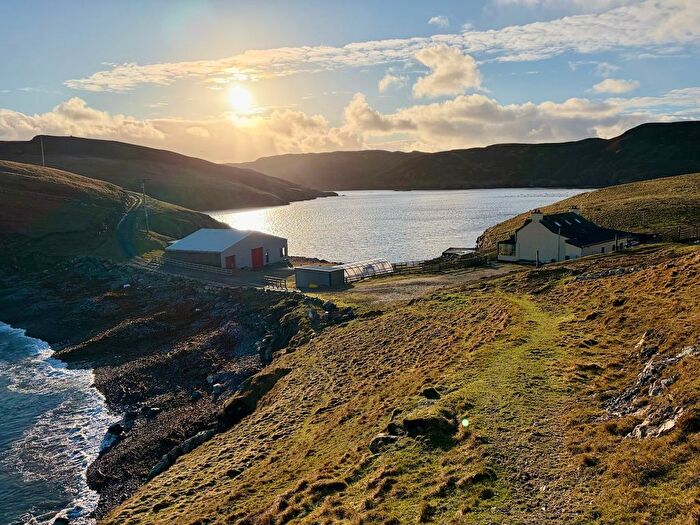
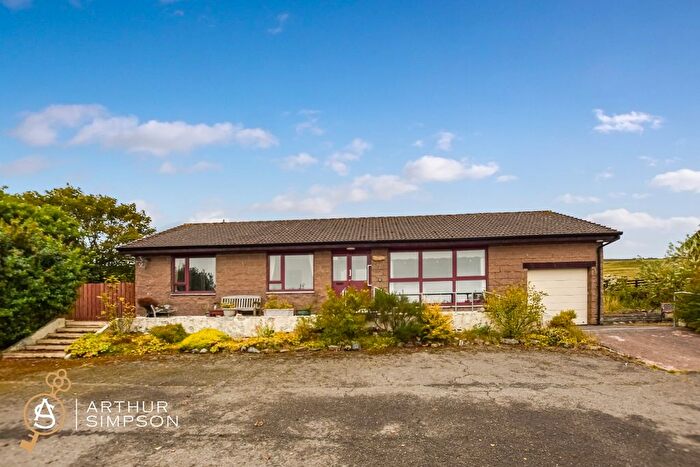
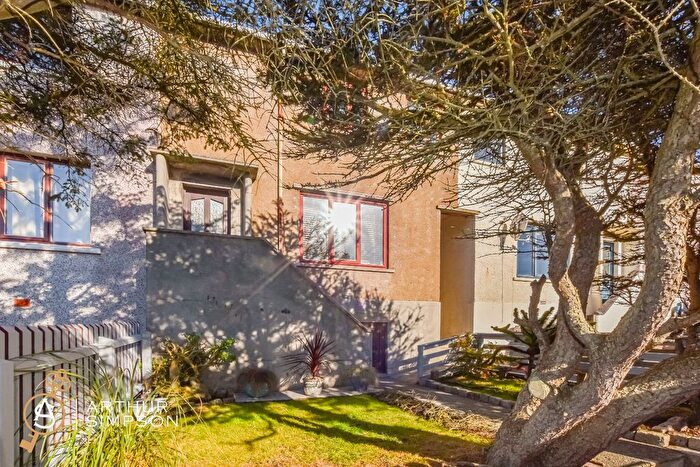
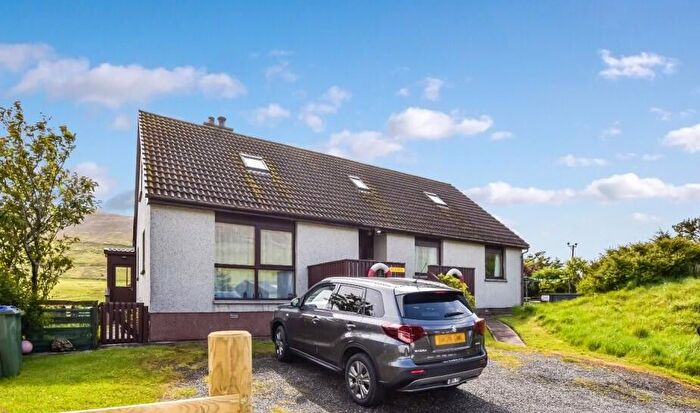
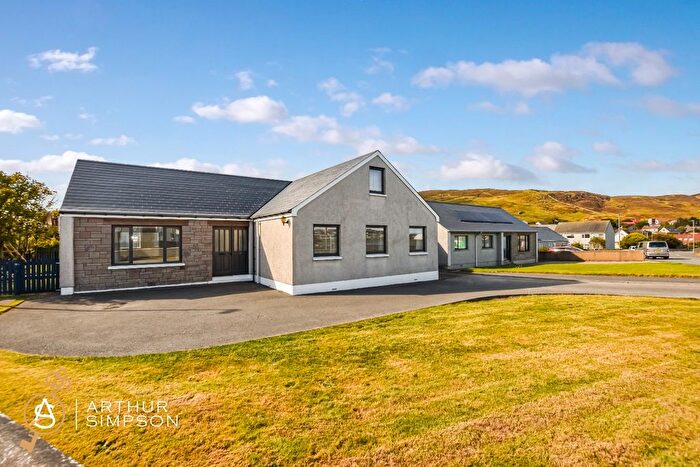
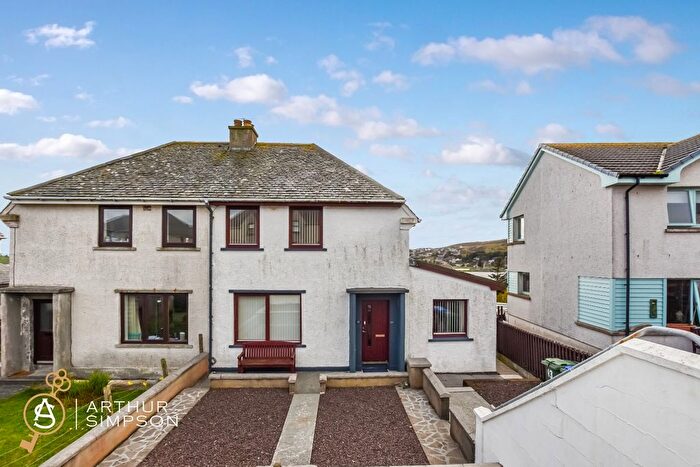
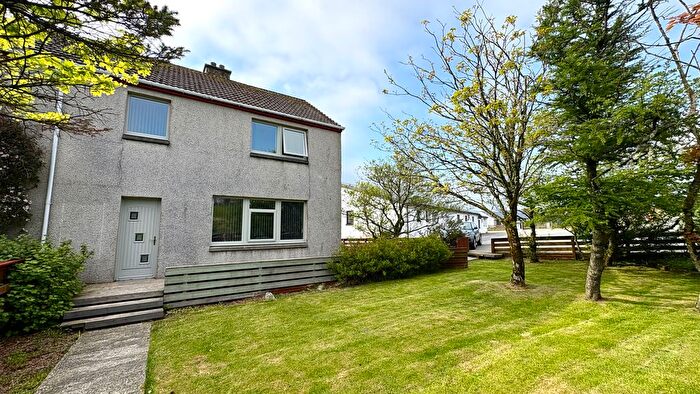
Houses for sale & to rent in Shetland West, Shetland
House Prices in Shetland West
Properties in Shetland West have an average house price of £173,675.00 and had 12 Property Transactions within the last 3 years¹.
Shetland West is an area in Shetland, Shetland Islands with 1,107 households², where the most expensive property was sold for £330,000.00.
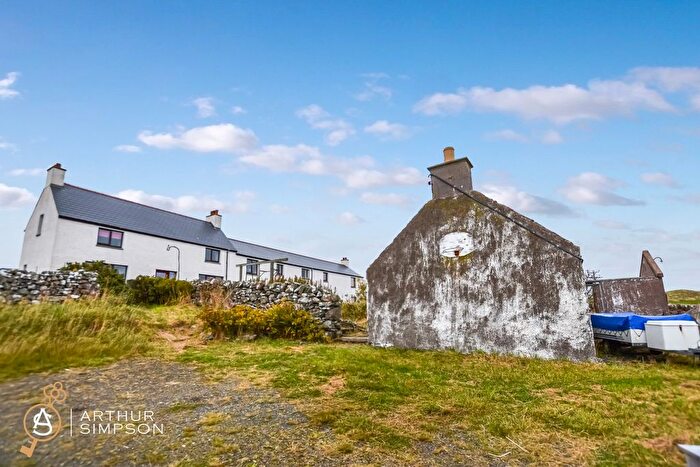
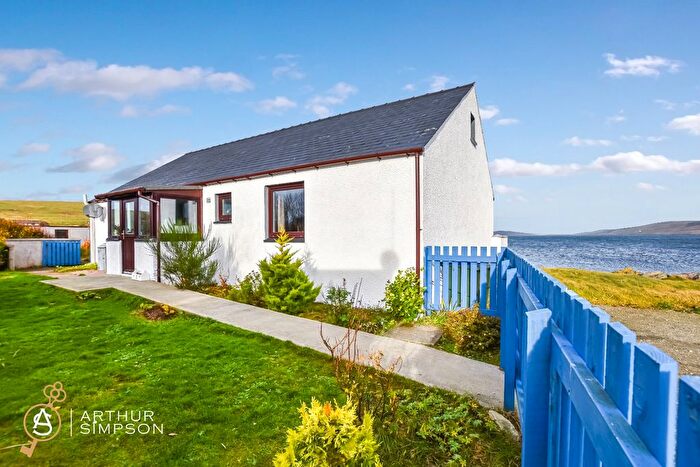
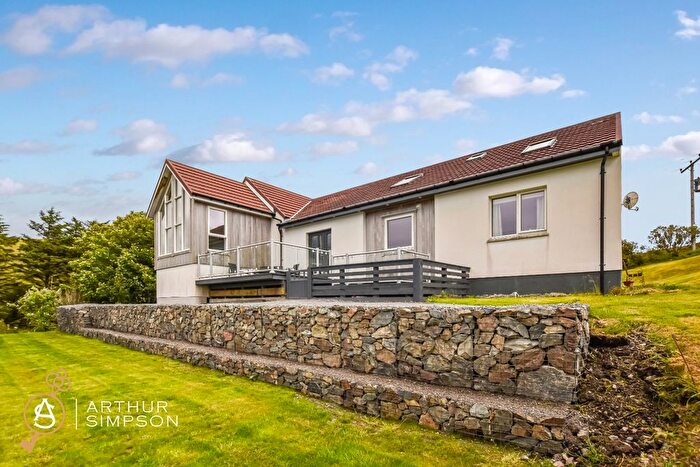
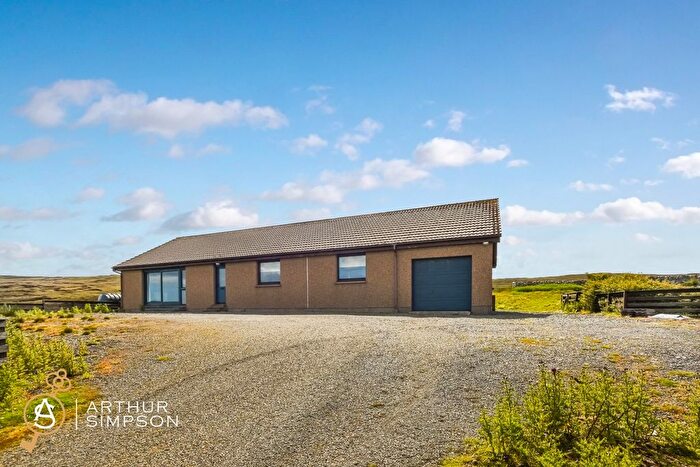
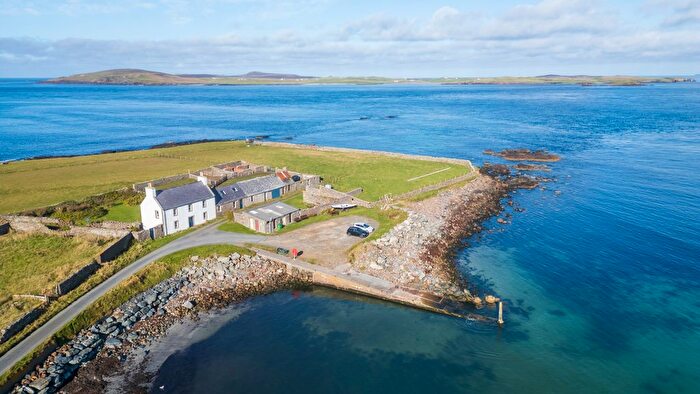
Previously listed properties in Shetland West
Roads and Postcodes in Shetland West
Navigate through our locations to find the location of your next house in Shetland West, Shetland for sale or to rent.
| Streets | Postcodes |
|---|---|
| Aith | ZE2 9NB ZE2 9ND |
| Clach Na Strom | ZE2 9LG |
| Grindibrek Skeld | ZE2 9NY |
| Kallibrig | ZE2 9NX |
| Kalliness | ZE2 9LR |
| Kirkidale | ZE2 9QX |
| Lingaro | ZE2 9NN |
| Marthastoon | ZE2 9GZ |
| New Road | ZE2 9PQ |
| Sand | ZE2 9NQ |
| Sand Sound | ZE2 9LU |
| Stove Cottages | ZE2 9XB |
| Stromfirth | ZE2 9LH |
| Whitelaw Road | ZE2 9NF |
| Wirliegert | ZE2 9NW |
| ZE2 9GJ ZE2 9GL ZE2 9LJ ZE2 9LL ZE2 9LN ZE2 9LP ZE2 9LQ ZE2 9LS ZE2 9LT ZE2 9LW ZE2 9LX ZE2 9LY ZE2 9LZ ZE2 9NA ZE2 9NE ZE2 9NG ZE2 9NH ZE2 9NJ ZE2 9NL ZE2 9NP ZE2 9NR ZE2 9NS ZE2 9NT ZE2 9PA ZE2 9PB ZE2 9PD ZE2 9PE ZE2 9PF ZE2 9PG ZE2 9PH ZE2 9PJ ZE2 9PL ZE2 9PN ZE2 9PW |
Transport near Shetland West
-
Thurso Station
-
Wick Station
-
Georgemas Junction Station
-
Scotscalder Station
-
Altnabreac Station
-
Forsinard Station
-
Kinbrace Station
-
Helmsdale Station
-
Kildonan Station
-
Brora Station
- FAQ
- Price Paid By Year
Frequently asked questions about Shetland West
What is the average price for a property for sale in Shetland West?
The average price for a property for sale in Shetland West is £173,675. This amount is 5% lower than the average price in Shetland. There are 129 property listings for sale in Shetland West.
What streets have the most expensive properties for sale in Shetland West?
The streets with the most expensive properties for sale in Shetland West are Clach Na Strom at an average of £180,000 and Whitelaw Road at an average of £138,000.
What streets have the most affordable properties for sale in Shetland West?
The street with the most affordable properties for sale in Shetland West is New Road at an average of £132,500.
Which train stations are available in or near Shetland West?
Some of the train stations available in or near Shetland West are Thurso, Wick and Georgemas Junction.
Property Price Paid in Shetland West by Year
The average sold property price by year was:
| Year | Average Sold Price | Price Change |
Sold Properties
|
|---|---|---|---|
| 2025 | £165,000 | 13% |
2 Properties |
| 2024 | £144,333 | -31% |
3 Properties |
| 2023 | £188,728 | 7% |
7 Properties |
| 2022 | £175,747 | 3% |
22 Properties |
| 2021 | £170,471 | 5% |
21 Properties |
| 2020 | £161,454 | -9% |
17 Properties |
| 2019 | £176,232 | 6% |
36 Properties |
| 2018 | £164,822 | -3% |
35 Properties |
| 2017 | £170,071 | 11% |
21 Properties |
| 2016 | £150,855 | 23% |
31 Properties |
| 2015 | £116,706 | -18% |
26 Properties |
| 2014 | £137,172 | 13% |
35 Properties |
| 2013 | £119,646 | 1% |
25 Properties |
| 2012 | £118,043 | 6% |
23 Properties |
| 2011 | £111,504 | 28% |
25 Properties |
| 2010 | £80,795 | -29% |
17 Properties |
| 2009 | £104,278 | 20% |
45 Properties |
| 2008 | £83,543 | -8% |
37 Properties |
| 2007 | £89,842 | 16% |
23 Properties |
| 2006 | £75,582 | 24% |
39 Properties |
| 2005 | £57,335 | 5% |
27 Properties |
| 2004 | £54,191 | 20% |
46 Properties |
| 2003 | £43,566 | 2% |
17 Properties |
| 2002 | £42,536 | 3% |
5 Properties |
| 2001 | £41,462 | -99% |
8 Properties |
| 2000 | £82,397 | - |
4 Properties |

