
Houses for sale & to rent in ML3 7RB, Craigburn Street, Hamilton South, Hamilton
House Prices in ML3 7RB, Craigburn Street, Hamilton South
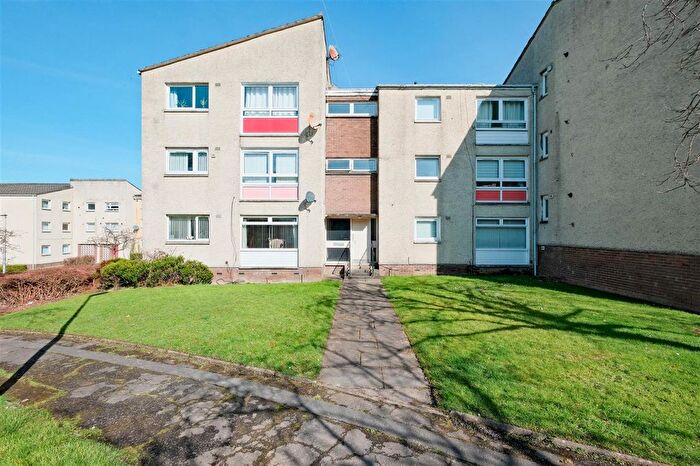
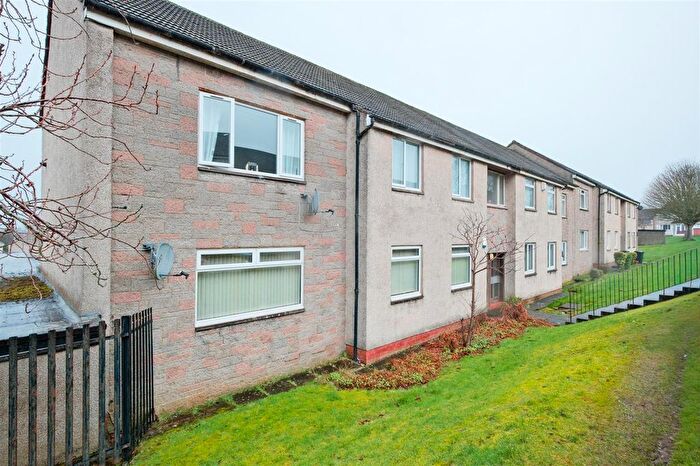
Properties in ML3 7RB have an average house price of £50k and had 2 Property Transactions within the last 3 years.¹ ML3 7RB is a postcode in Craigburn Street located in Hamilton South, an area in Hamilton, South Lanarkshire, with 18 households², where the most expensive property was sold for £60k.
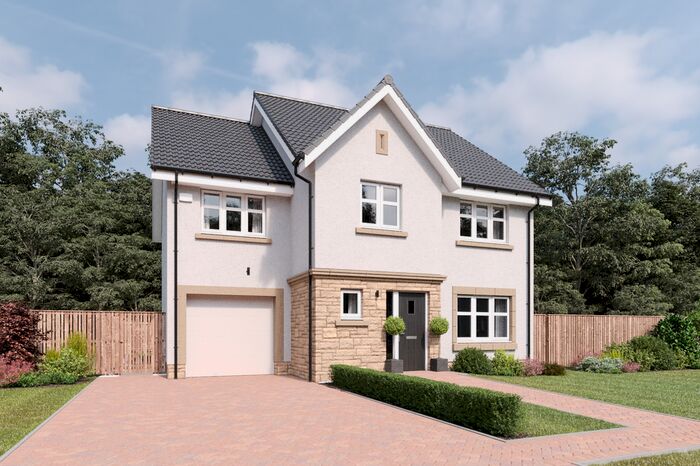
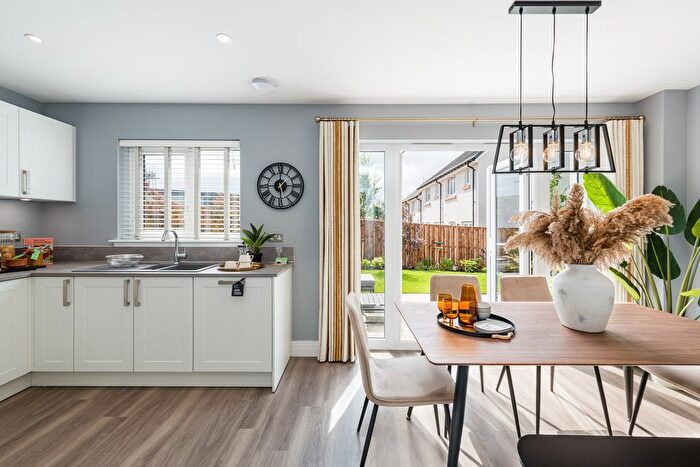
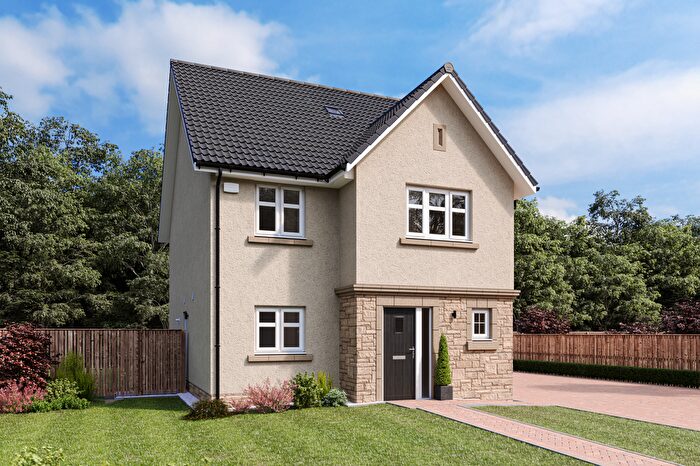
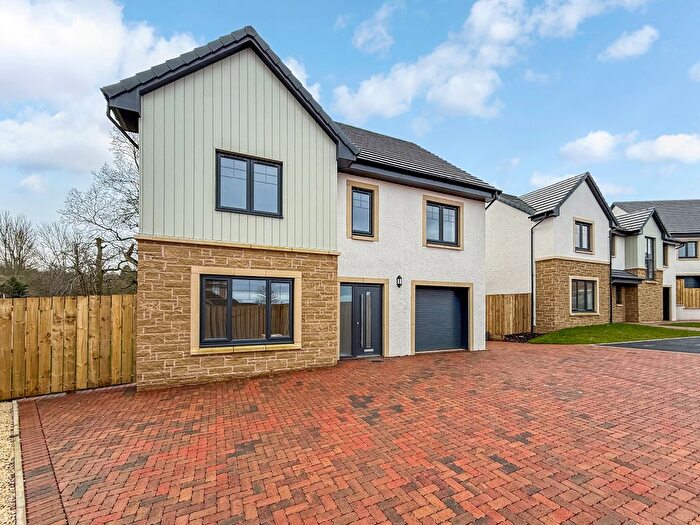
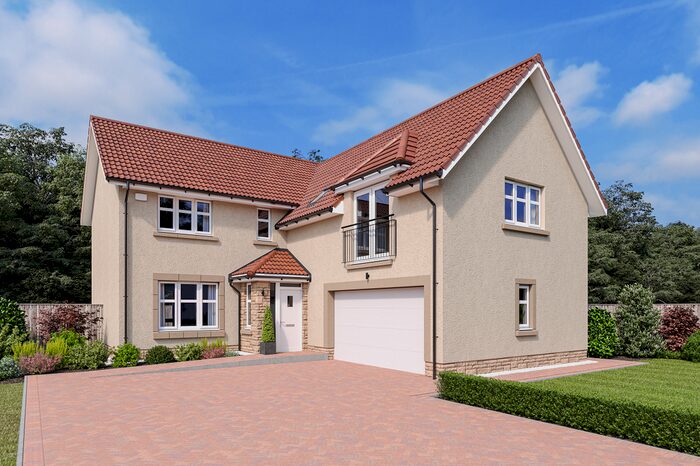
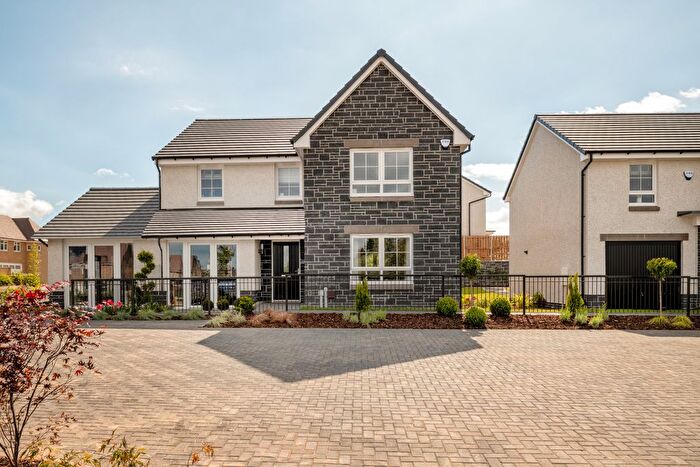
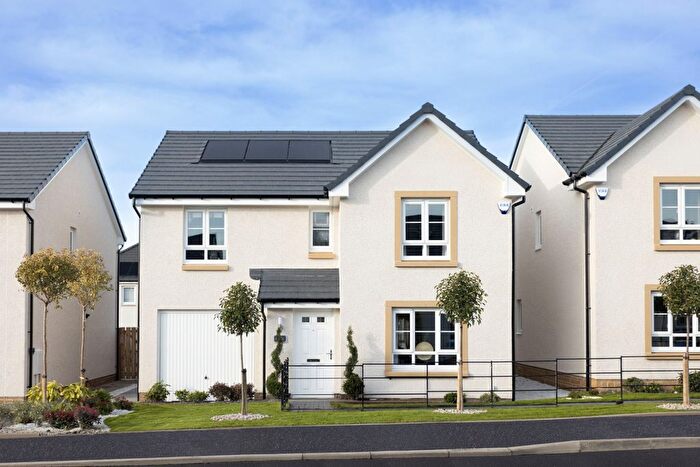
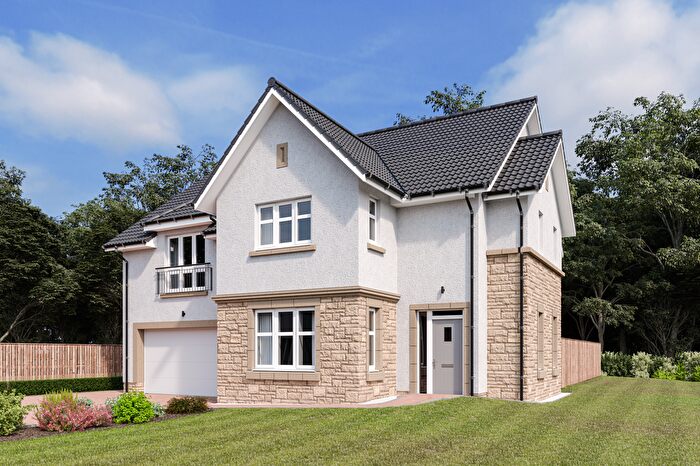
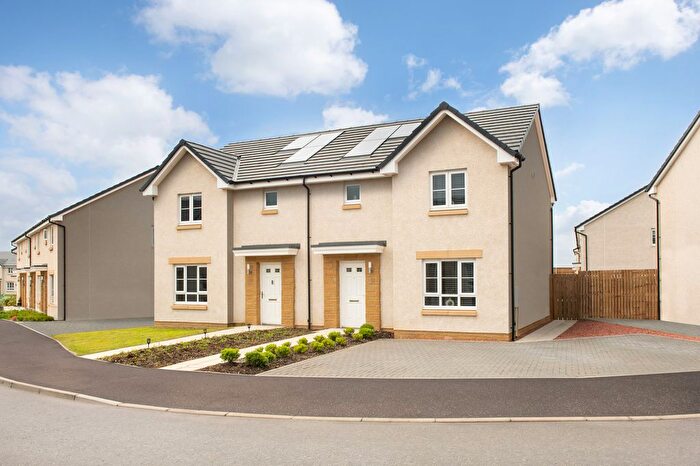
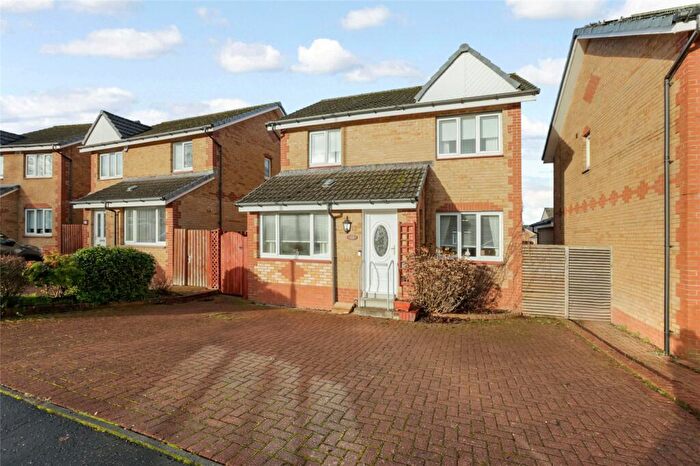
Properties for sale near ML3 7RB, Craigburn Street
![]()
If you are looking to sell your house, let it out, or receive a property valuation, an expert can help you.
Click the button below to get started.


Price Paid in Craigburn Street, ML3 7RB, Hamilton South
16a Craigburn Street, ML3 7RB, Hamilton South Hamilton
Property 16a has been sold 2 times. The last time it was sold was in 26/08/2025 and the sold price was £59,500.00.
This is a Property which was sold as a New Build in 26/08/2025
| Date | Price | Classification |
|---|---|---|
| 26/08/2025 | £59,500.00 | New Build |
| 03/10/2013 | £35,750.00 | Established Building |
14 Craigburn Street, ML3 7RB, Hamilton South Hamilton
Property 14 has been sold 3 times. The last time it was sold was in 10/03/2025 and the sold price was £39,999.00.
This is a Property which was sold as a New Build in 10/03/2025
| Date | Price | Classification |
|---|---|---|
| 10/03/2025 | £39,999.00 | New Build |
| 23/12/2005 | £20,000.00 | Established Building |
| 22/05/2002 | £6,900.00 | Established Building |
18 Craigburn Street, ML3 7RB, Hamilton South Hamilton
Property 18 has been sold 1 time. The last time it was sold was in 01/08/2019 and the sold price was £28,000.00.
This is a Property which was sold as an Established Building in 01/08/2019
| Date | Price | Classification |
|---|---|---|
| 01/08/2019 | £28,000.00 | Established Building |
Transport near ML3 7RB, Craigburn Street
-
 Hamilton Central Station
 -
Hamilton West Station
-
Chatelherault Station
-
Airbles Station
-
Merryton Station
House price paid reports for ML3 7RB, Craigburn Street
Click on the buttons below to see price paid reports by year or property price:
- Price Paid By Year
Property Price Paid in ML3 7RB, Craigburn Street by Year
The average sold property price by year was:
| Year | Average Sold Price | Price Change |
Sold Properties
|
|---|---|---|---|
| 2025 | £49,749 | 44% |
2 Properties |
| 2019 | £28,000 | -28% |
1 Property |
| 2013 | £35,750 | 44% |
1 Property |
| 2005 | £20,000 | 66% |
1 Property |
| 2002 | £6,900 | - |
1 Property |