
Houses for sale & to rent in ML3 8TX, Skylands Grove, Hamilton South, Hamilton
House Prices in ML3 8TX, Skylands Grove, Hamilton South
Properties in ML3 8TX have an average house price of £280,000.00 and had 1 Property Transaction within the last 3 years.¹ ML3 8TX is a postcode in Skylands Grove located in Hamilton South, an area in Hamilton, South Lanarkshire, with 3 households², where the most expensive property was sold for £280,000.00.
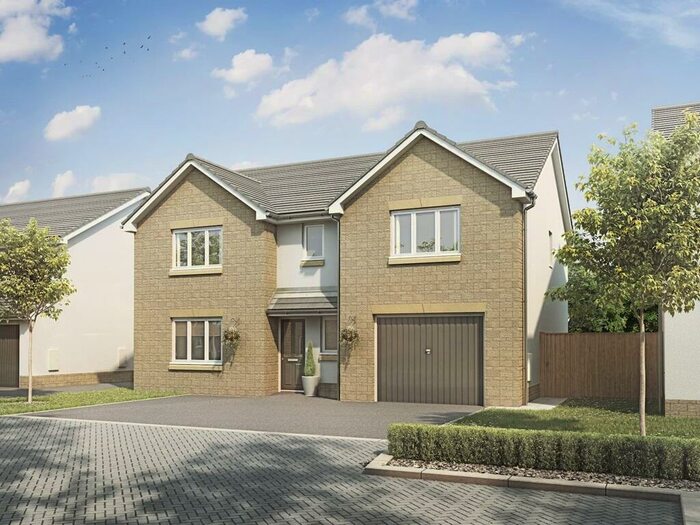
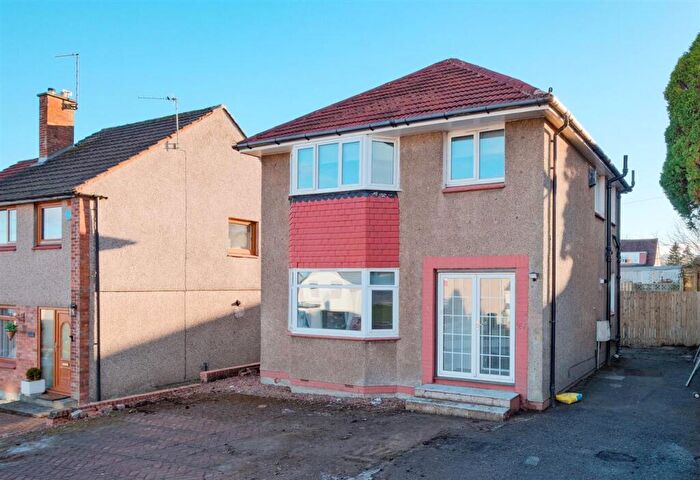
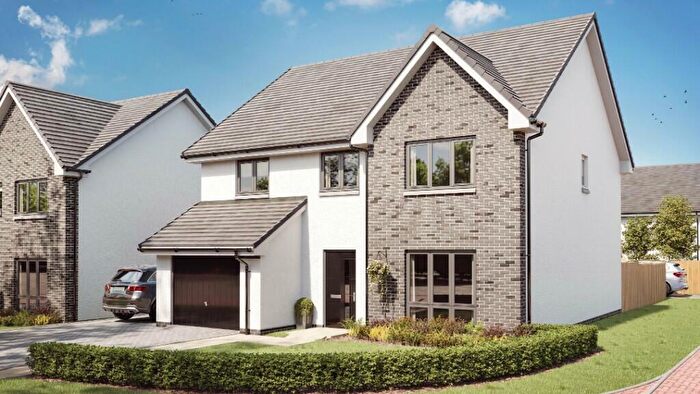
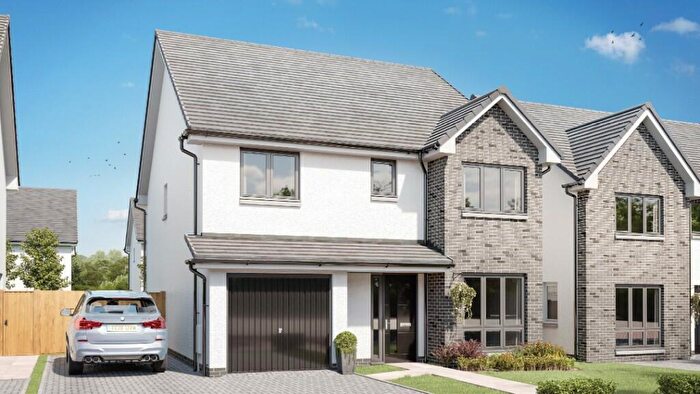
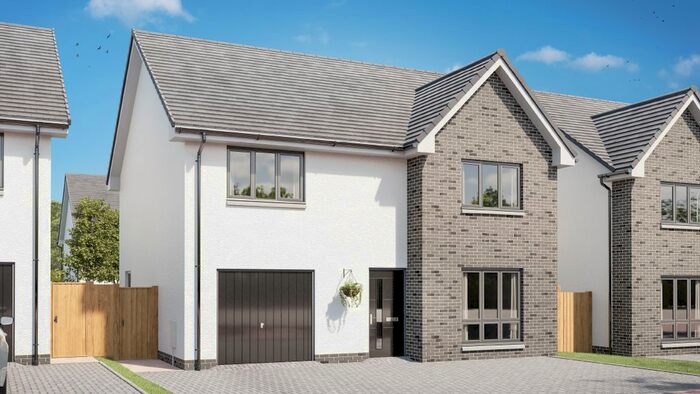
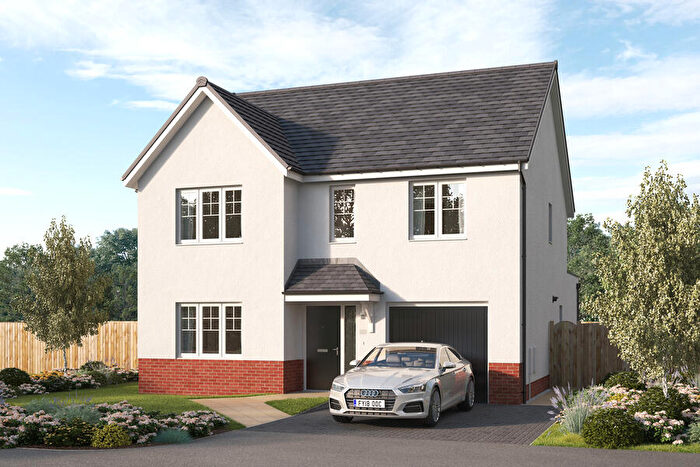
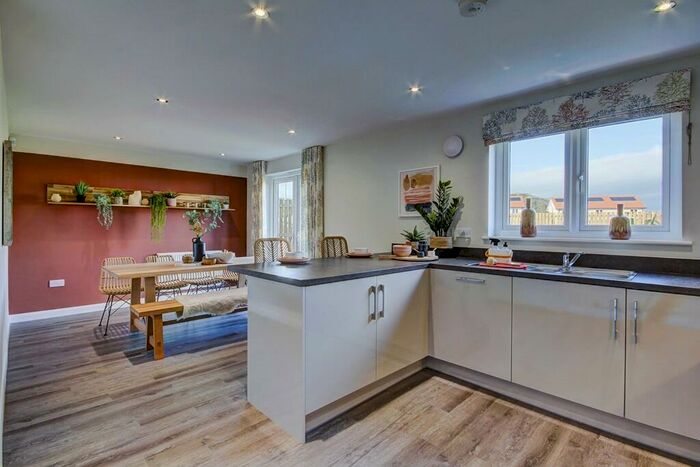
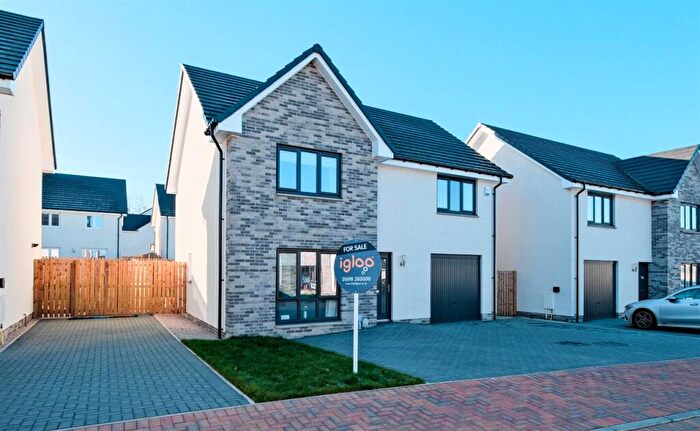
Properties for sale near ML3 8TX, Skylands Grove


![]()
If you are looking to sell your house, let it out, or receive a property valuation, an expert can help you.
Click the button below to get started.


Price Paid in Skylands Grove, ML3 8TX, Hamilton South
1 Skylands Grove, ML3 8TX, Hamilton South Hamilton
Property 1 has been sold 3 times. The last time it was sold was in 10/03/2023 and the sold price was £280,000.00.
This is a Property which was sold as an Established Building in 10/03/2023
| Date | Price | Classification |
|---|---|---|
| 10/03/2023 | £280,000.00 | Established Building |
| 02/08/2007 | £250,000.00 | Established Building |
| 16/06/2004 | £194,950.00 | Established Building |
3 Skylands Grove, ML3 8TX, Hamilton South Hamilton
Property 3 has been sold 3 times. The last time it was sold was in 11/10/2019 and the sold price was £230,000.00.
This is a Property which was sold as an Established Building in 11/10/2019
| Date | Price | Classification |
|---|---|---|
| 11/10/2019 | £230,000.00 | Established Building |
| 23/07/2013 | £174,000.00 | Established Building |
| 25/06/2004 | £186,750.00 | Established Building |
2 Skylands Grove, ML3 8TX, Hamilton South Hamilton
Property 2 has been sold 1 time. The last time it was sold was in 02/07/2004 and the sold price was £184,995.00.
This is a Property which was sold as an Established Building in 02/07/2004
| Date | Price | Classification |
|---|---|---|
| 02/07/2004 | £184,995.00 | Established Building |
Transport near ML3 8TX, Skylands Grove

House price paid reports for ML3 8TX, Skylands Grove
Click on the buttons below to see price paid reports by year or property price:
- Price Paid By Year
Property Price Paid in ML3 8TX, Skylands Grove by Year
The average sold property price by year was:
| Year | Average Sold Price | Price Change |
Sold Properties
|
|---|---|---|---|
| 2023 | £280,000 | 18% |
1 Property |
| 2019 | £230,000 | 24% |
1 Property |
| 2013 | £174,000 | -44% |
1 Property |
| 2007 | £250,000 | 24% |
1 Property |
| 2004 | £188,898 | - |
3 Properties |