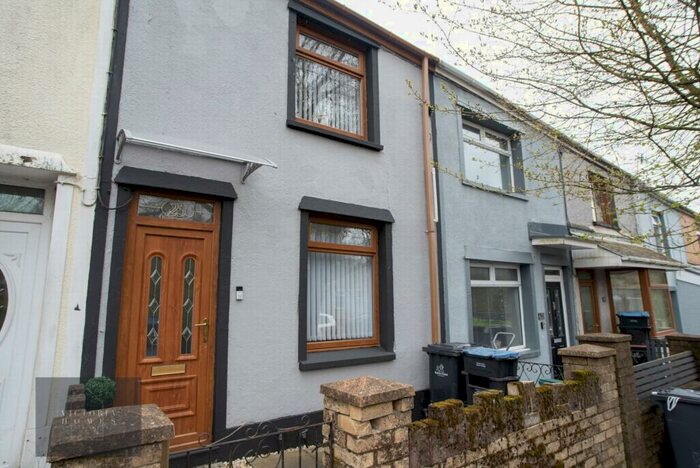
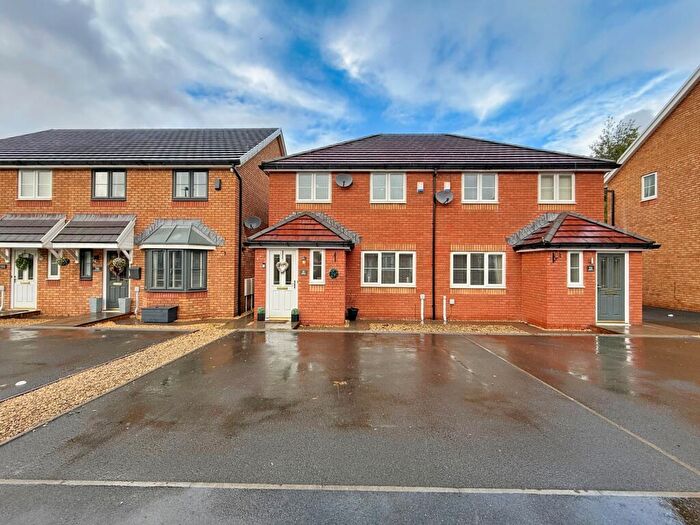
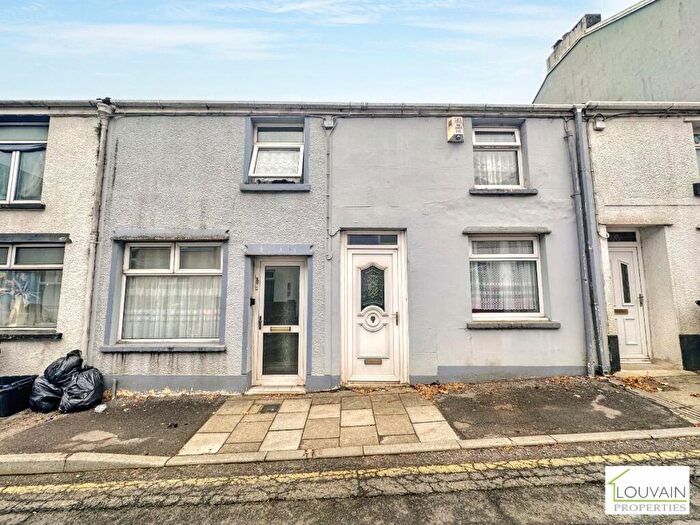
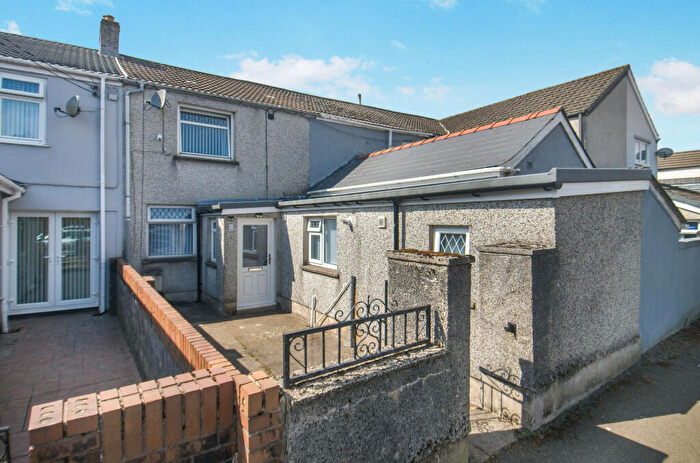
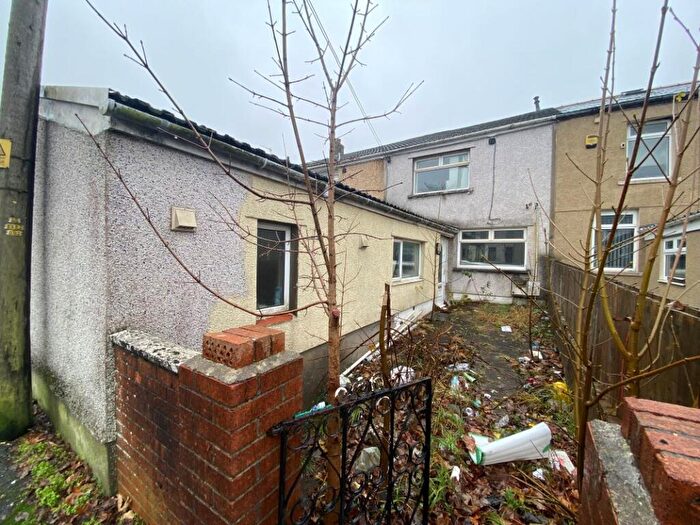
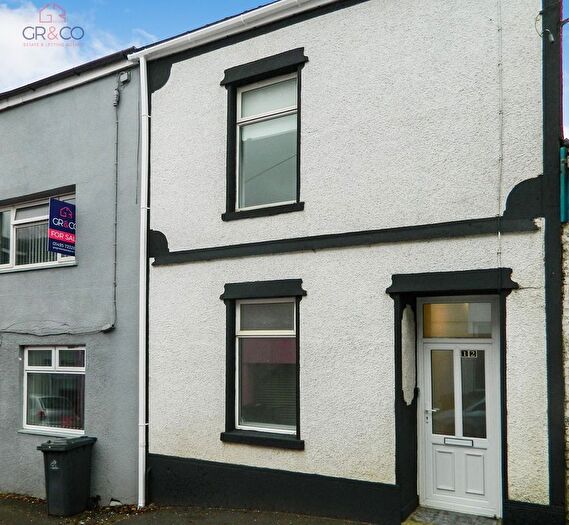
Houses for sale & to rent in Georgetown, Tredegar
House Prices in Georgetown
Properties in Georgetown have an average house price of £143,633.00 and had 208 Property Transactions within the last 3 years¹.
Georgetown is an area in Tredegar, Blaenau Gwent - Blaenau Gwent with 1,522 households², where the most expensive property was sold for £500,000.00.
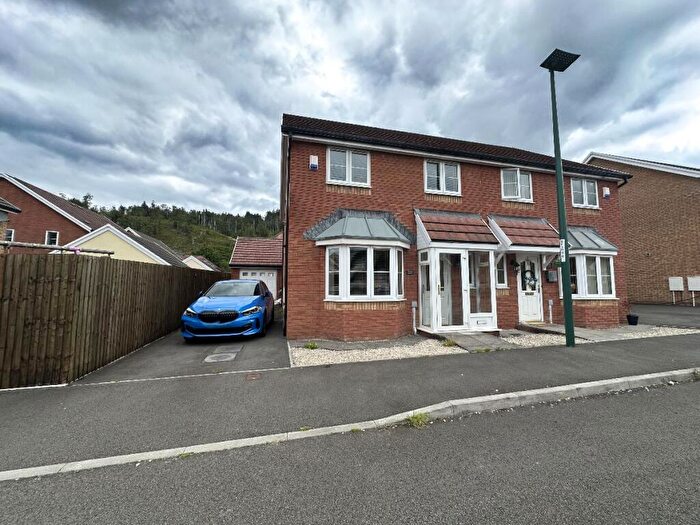
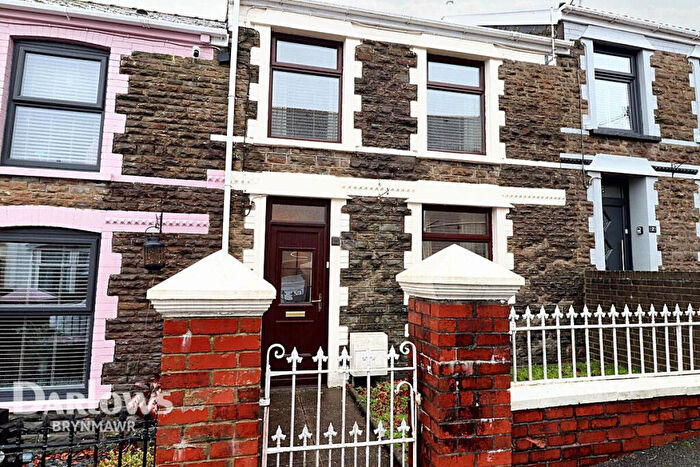
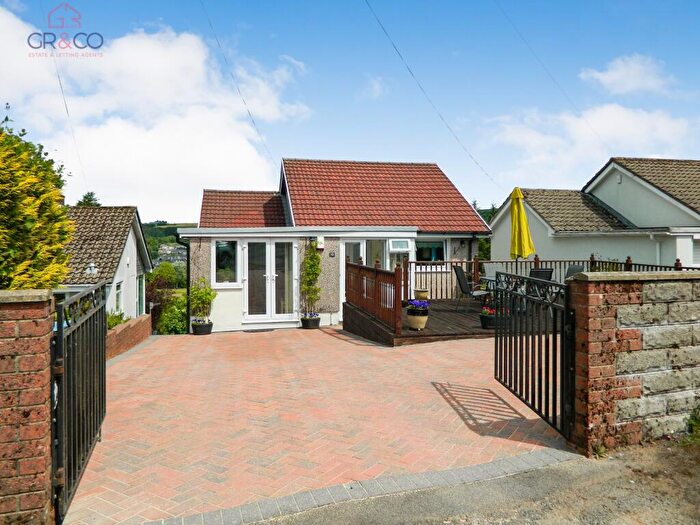
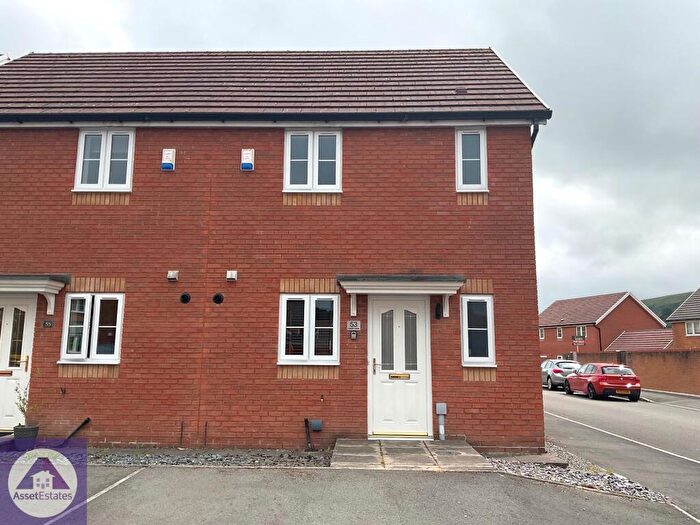
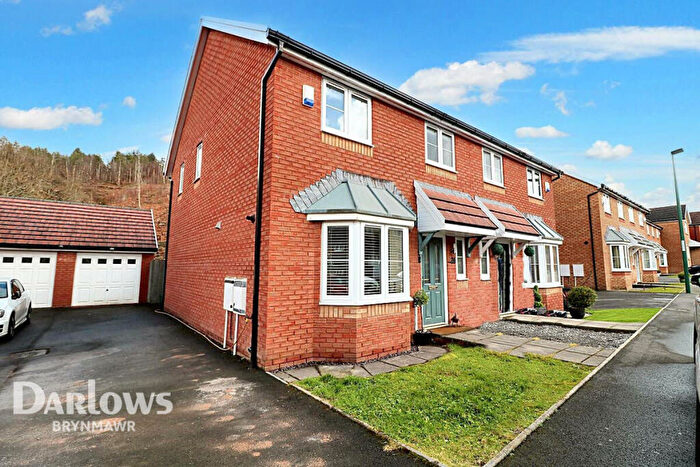
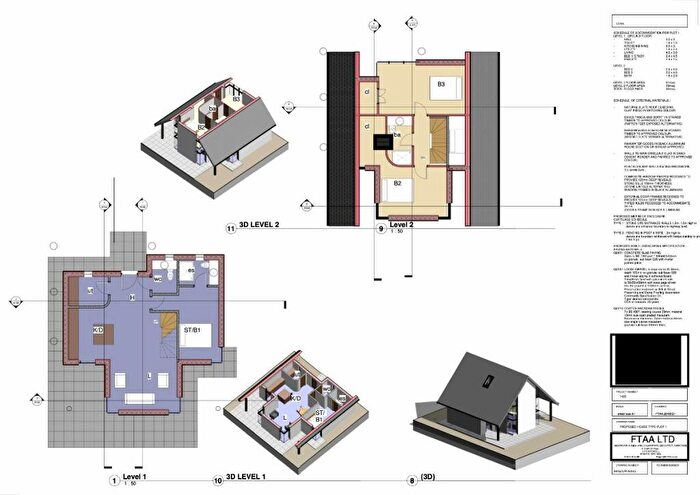
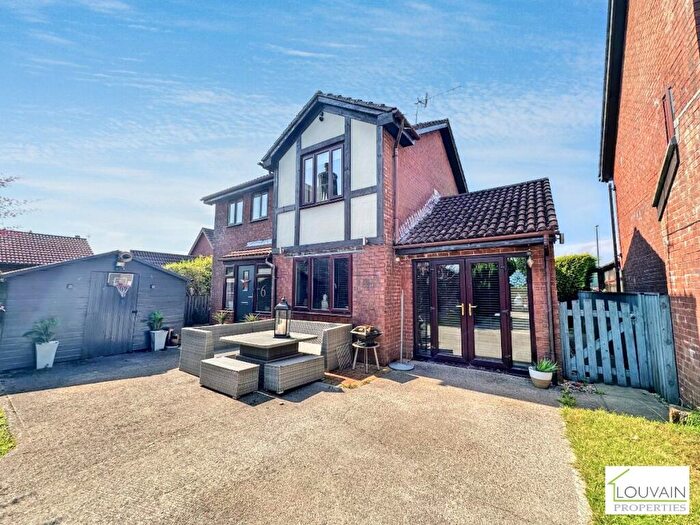
Properties for sale in Georgetown
Previously listed properties in Georgetown
Roads and Postcodes in Georgetown
Navigate through our locations to find the location of your next house in Georgetown, Tredegar for sale or to rent.
| Streets | Postcodes |
|---|---|
| Aden Villas | NP22 4JW |
| Alexandra Terrace | NP22 3JW |
| Arthur Street | NP22 4JL |
| Ashville | NP22 4LN |
| Ashville Villas | NP22 4LP |
| Bethel Avenue | NP22 3JL |
| Brompton Place | NP22 4NE NP22 4NF |
| Colenso Terrace | NP22 3LW |
| Copper Beech Drive | NP22 4FD |
| Edward Terrace | NP22 3JQ |
| Elmwood | NP22 3LA NP22 3LB |
| Elmwood Grove | NP22 3AH |
| Fields Road | NP22 4LW |
| Gladstone Place | NP22 4LG |
| Glyn Terrace | NP22 4HX NP22 4JA NP22 4JB |
| Greenfield Terrace | NP22 3JN |
| Hillview | NP22 4LL |
| James Street | NP22 4JE NP22 4JF |
| Kimberley Terrace | NP22 3LD NP22 3LE NP22 3LF |
| Ladysmith Terrace | NP22 3LJ |
| Larch Lane | NP22 4FA |
| Laurel Grove | NP22 4FE |
| Mafeking Terrace | NP22 3LG |
| Manmoel Road | NP23 6QT |
| Mount Pleasant View | NP22 3LL |
| Oakfield Road | NP22 4LJ |
| Park Place | NP22 4LD NP22 4LQ |
| Peacehaven | NP22 4BX NP22 4BY NP22 4BZ |
| Peacehaven Court | NP22 4BQ |
| Pentre Heulog | NP22 4NQ |
| Pochin Crescent | NP22 4JS |
| Poplar Road | NP22 4LH |
| Pretoria Terrace | NP22 3LH |
| Prospect Place | NP22 3JP |
| Rawlinson Terrace | NP22 4JD NP22 4LF |
| Rhyd Terrace | NP22 4LX NP22 4NA |
| Richmond Court | NP22 4NN |
| Richmond Terrace | NP22 4LE |
| Roberts Terrace | NP22 3LP |
| Sirhowy Industrial Estate | NP22 4QZ |
| Southend | NP22 4JN |
| St James Close | NP22 4NG |
| St James Park | NP22 4NH |
| St James Way | NP22 4RA NP22 4RB |
| The Rhyd | NP22 4BJ NP22 4LY NP22 4LZ NP22 4NB |
| Troedrhiwgwair | NP22 4DA NP22 4DB |
| Vale View | NP22 4ND |
| Victoria Terrace | NP22 3JT NP22 3JU |
| Walnut Close | NP22 4FF |
| Walter Street | NP22 4JH NP22 4JJ |
| Whitworth Fields | NP22 4LT |
| Whitworth Terrace | NP22 4LR NP22 4LS NP22 4LU |
| Woodfield Court | NP22 4JT |
| Woodfield Cross | NP22 4JG |
| Woodfield Road | NP22 4JQ |
| York Terrace | NP22 3JX NP22 3JY NP22 3JZ |
| NP22 3LQ NP22 4DD NP22 4NJ |
Transport near Georgetown
- FAQ
- Price Paid By Year
- Property Type Price
Frequently asked questions about Georgetown
What is the average price for a property for sale in Georgetown?
The average price for a property for sale in Georgetown is £143,633. This amount is 4% lower than the average price in Tredegar. There are 440 property listings for sale in Georgetown.
What streets have the most expensive properties for sale in Georgetown?
The streets with the most expensive properties for sale in Georgetown are Laurel Grove at an average of £343,250, St James Park at an average of £305,833 and Larch Lane at an average of £286,388.
What streets have the most affordable properties for sale in Georgetown?
The streets with the most affordable properties for sale in Georgetown are Roberts Terrace at an average of £69,000, Edward Terrace at an average of £94,300 and The Rhyd at an average of £96,500.
Which train stations are available in or near Georgetown?
Some of the train stations available in or near Georgetown are Ebbw Vale Town, Ebbw Vale Parkway and Pontlottyn.
Property Price Paid in Georgetown by Year
The average sold property price by year was:
| Year | Average Sold Price | Price Change |
Sold Properties
|
|---|---|---|---|
| 2025 | £146,738 | 1% |
40 Properties |
| 2024 | £144,823 | 9% |
51 Properties |
| 2023 | £132,117 | -12% |
46 Properties |
| 2022 | £148,489 | 13% |
71 Properties |
| 2021 | £129,764 | 16% |
80 Properties |
| 2020 | £109,623 | 2% |
56 Properties |
| 2019 | £107,110 | -1% |
67 Properties |
| 2018 | £108,257 | -23% |
93 Properties |
| 2017 | £133,600 | 10% |
74 Properties |
| 2016 | £120,261 | 11% |
63 Properties |
| 2015 | £106,517 | -9% |
73 Properties |
| 2014 | £116,172 | 14% |
67 Properties |
| 2013 | £99,620 | 11% |
52 Properties |
| 2012 | £89,026 | 2% |
51 Properties |
| 2011 | £87,086 | 9% |
45 Properties |
| 2010 | £79,316 | 9% |
30 Properties |
| 2009 | £72,350 | -31% |
21 Properties |
| 2008 | £94,650 | -7% |
22 Properties |
| 2007 | £101,546 | 25% |
69 Properties |
| 2006 | £76,042 | 3% |
85 Properties |
| 2005 | £73,552 | 6% |
49 Properties |
| 2004 | £69,318 | 36% |
69 Properties |
| 2003 | £44,297 | 18% |
83 Properties |
| 2002 | £36,352 | 13% |
70 Properties |
| 2001 | £31,542 | -4% |
57 Properties |
| 2000 | £32,934 | 2% |
48 Properties |
| 1999 | £32,405 | 15% |
66 Properties |
| 1998 | £27,494 | -18% |
46 Properties |
| 1997 | £32,397 | -5% |
41 Properties |
| 1996 | £34,129 | 3% |
70 Properties |
| 1995 | £33,216 | - |
44 Properties |
Property Price per Property Type in Georgetown
Here you can find historic sold price data in order to help with your property search.
The average Property Paid Price for specific property types in the last three years are:
| Property Type | Average Sold Price | Sold Properties |
|---|---|---|
| Semi Detached House | £190,567.00 | 29 Semi Detached Houses |
| Detached House | £339,710.00 | 14 Detached Houses |
| Terraced House | £118,747.00 | 165 Terraced Houses |


