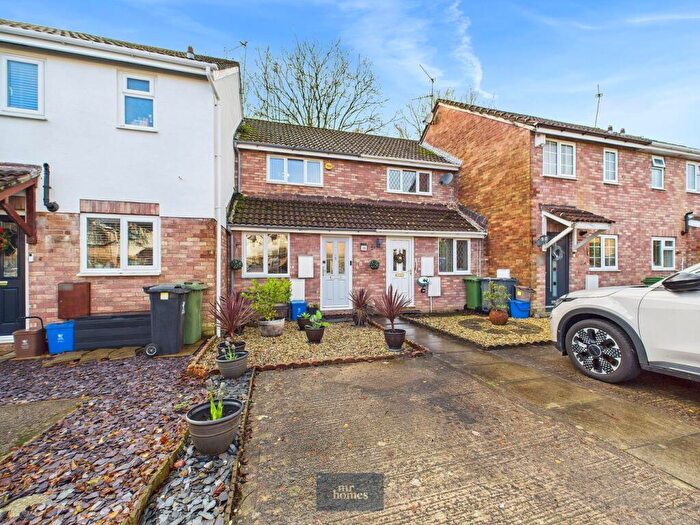
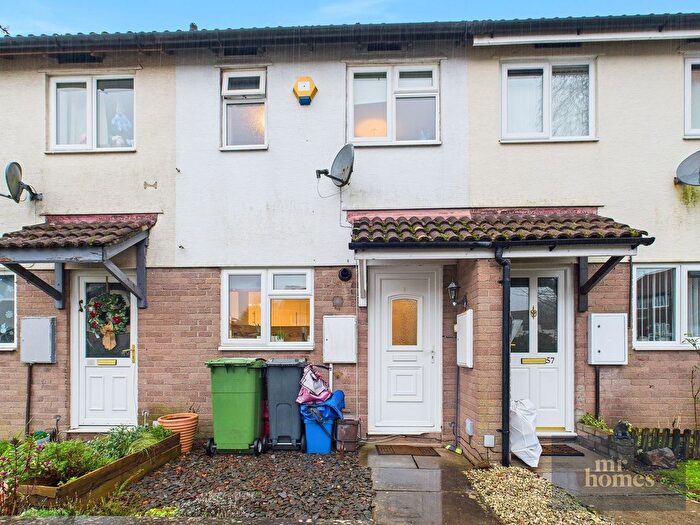
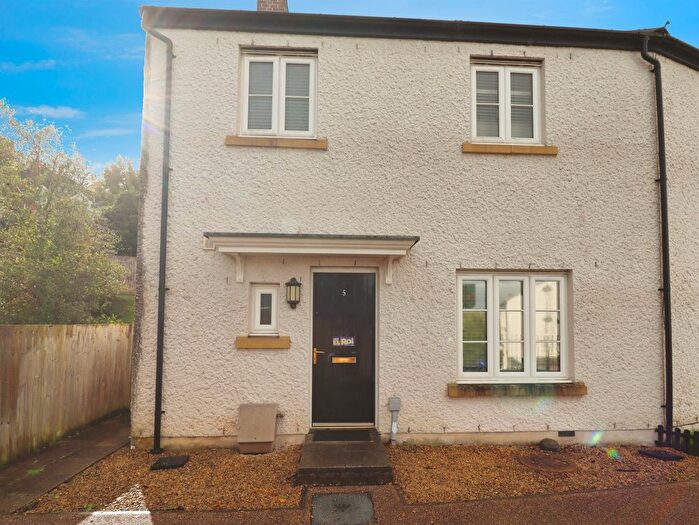
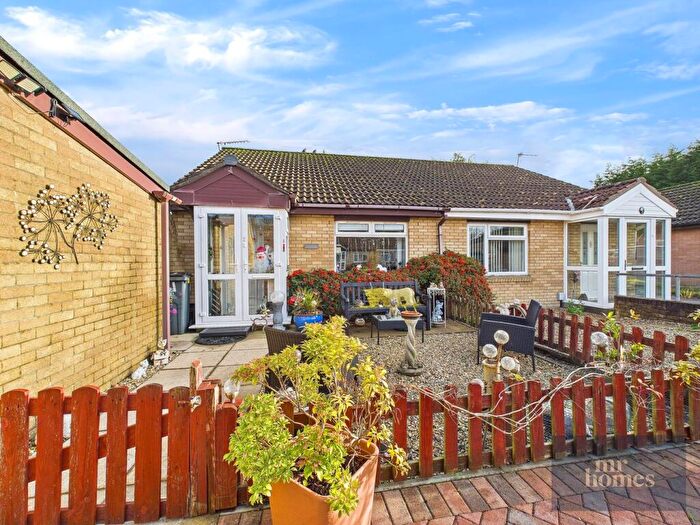
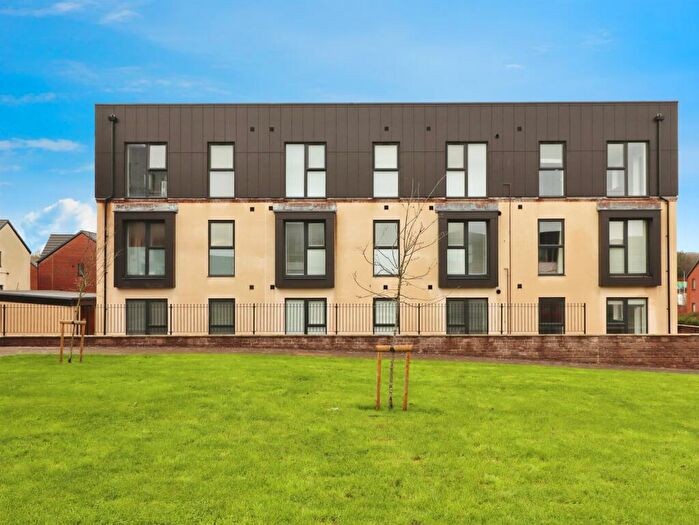
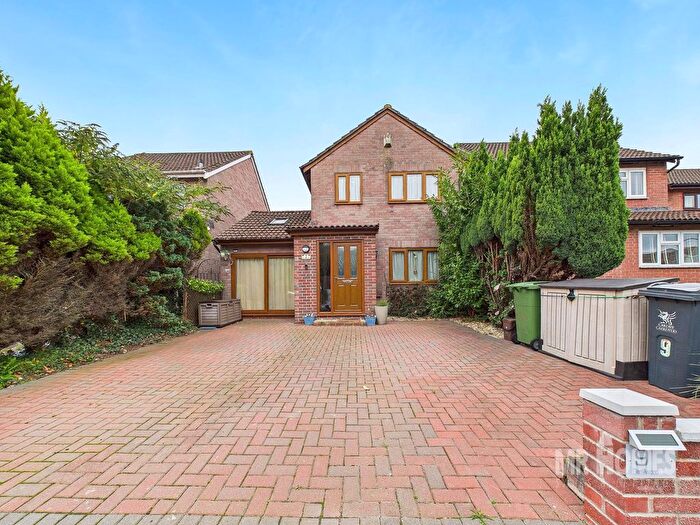
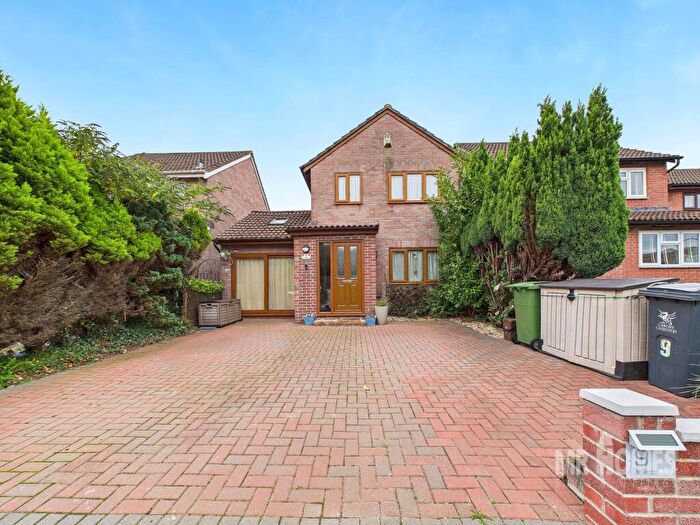
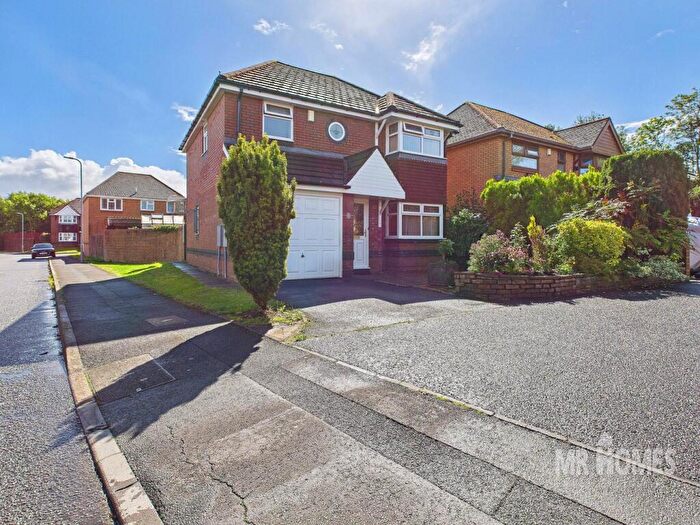
Houses for sale & to rent in Peterston-super-ely, Cardiff
House Prices in Peterston-super-ely
Properties in Peterston-super-ely have an average house price of £537,494.00 and had 48 Property Transactions within the last 3 years¹.
Peterston-super-ely is an area in Cardiff, Bro Morgannwg - the Vale of Glamorgan with 559 households², where the most expensive property was sold for £1,000,000.00.
Properties for sale in Peterston-super-ely
Roads and Postcodes in Peterston-super-ely
Navigate through our locations to find the location of your next house in Peterston-super-ely, Cardiff for sale or to rent.
| Streets | Postcodes |
|---|---|
| Ael Y Bryn | CF5 6LL |
| Castle Green | CF5 6EX |
| Chapel Lane | CF5 6LF |
| Church Cottages | CF5 6ER |
| Cory Crescent | CF5 6LS |
| Culverhouse Cross | CF5 6XQ CF5 6YZ |
| Drope Road | CF5 6EP |
| Drope Terrace | CF5 6EQ |
| Duffryn Crescent | CF5 6NF |
| Ffordd Yr Eglwys | CF5 6LE |
| Grants Field | CF5 6SE |
| Heol Llanbedr | CF5 6LP |
| Kingsland Cottage | CF5 6LY |
| Le Sor Hill | CF5 6LW |
| Little Avenue | CF5 6NG |
| Main Avenue | CF5 6LQ |
| Pendoylan Road | CF5 6LX |
| Pwll Y Myn Crescent | CF5 6LR |
| St Brides Place | CF5 6HB |
| Station Terrace | CF5 6LU |
| Tai Llanbedr | CF5 6LN |
| The Downs | CF5 6SB |
| The Elms | CF5 6NA |
| The Lane | CF5 6SD |
| The Tumble | CF5 6SA |
| Ty Newydd Cottages | CF5 6HD |
| Woodbine Cottages | CF5 6LJ |
| CF5 6EW CF5 6EY CF5 6EZ CF5 6LG CF5 6LH CF5 6LZ CF5 6ND CF5 6NE CF5 6TS CF5 6ET CF5 6HE CF5 6NB CF5 6SF CF5 6XA |
Transport near Peterston-super-ely
-
Fairwater Station
-
Waun-gron Park Station
-
Danescourt Station
-
Radyr Station
-
Llandaf Station
-
Coryton Station
-
Ninian Park Station
-
Pontyclun Station
-
Taffs Well Station
-
Whitchurch (South Glamorgan) Station
- FAQ
- Price Paid By Year
- Property Type Price
Frequently asked questions about Peterston-super-ely
What is the average price for a property for sale in Peterston-super-ely?
The average price for a property for sale in Peterston-super-ely is £537,494. This amount is 11% higher than the average price in Cardiff. There are 1,234 property listings for sale in Peterston-super-ely.
What streets have the most expensive properties for sale in Peterston-super-ely?
The streets with the most expensive properties for sale in Peterston-super-ely are Main Avenue at an average of £965,000, Pwll Y Myn Crescent at an average of £697,500 and The Downs at an average of £661,000.
What streets have the most affordable properties for sale in Peterston-super-ely?
The streets with the most affordable properties for sale in Peterston-super-ely are St Brides Place at an average of £265,000, Le Sor Hill at an average of £317,400 and Castle Green at an average of £375,000.
Which train stations are available in or near Peterston-super-ely?
Some of the train stations available in or near Peterston-super-ely are Fairwater, Waun-gron Park and Danescourt.
Property Price Paid in Peterston-super-ely by Year
The average sold property price by year was:
| Year | Average Sold Price | Price Change |
Sold Properties
|
|---|---|---|---|
| 2025 | £632,916 | 13% |
6 Properties |
| 2024 | £551,571 | 26% |
14 Properties |
| 2023 | £405,833 | -45% |
12 Properties |
| 2022 | £588,138 | 11% |
16 Properties |
| 2021 | £521,275 | 9% |
20 Properties |
| 2020 | £472,807 | 4% |
13 Properties |
| 2019 | £453,933 | -23% |
15 Properties |
| 2018 | £557,666 | 31% |
18 Properties |
| 2017 | £384,650 | -23% |
10 Properties |
| 2016 | £472,316 | 14% |
15 Properties |
| 2015 | £406,450 | -1% |
10 Properties |
| 2014 | £409,203 | 14% |
15 Properties |
| 2013 | £350,107 | -25% |
14 Properties |
| 2012 | £435,939 | -31% |
14 Properties |
| 2011 | £569,333 | 55% |
9 Properties |
| 2010 | £258,187 | -26% |
8 Properties |
| 2009 | £325,796 | -38% |
16 Properties |
| 2008 | £450,600 | 27% |
5 Properties |
| 2007 | £327,656 | -1% |
16 Properties |
| 2006 | £332,046 | -9% |
15 Properties |
| 2005 | £360,625 | 12% |
8 Properties |
| 2004 | £318,600 | 13% |
27 Properties |
| 2003 | £277,230 | 1% |
26 Properties |
| 2002 | £273,186 | 9% |
16 Properties |
| 2001 | £249,645 | 38% |
22 Properties |
| 2000 | £153,850 | 4% |
10 Properties |
| 1999 | £148,395 | -11% |
36 Properties |
| 1998 | £164,210 | 21% |
14 Properties |
| 1997 | £129,175 | 28% |
20 Properties |
| 1996 | £93,096 | -38% |
13 Properties |
| 1995 | £128,673 | - |
17 Properties |
Property Price per Property Type in Peterston-super-ely
Here you can find historic sold price data in order to help with your property search.
The average Property Paid Price for specific property types in the last three years are:
| Property Type | Average Sold Price | Sold Properties |
|---|---|---|
| Semi Detached House | £369,538.00 | 13 Semi Detached Houses |
| Detached House | £660,162.00 | 29 Detached Houses |
| Terraced House | £366,250.00 | 4 Terraced Houses |
| Flat | £193,000.00 | 2 Flats |

