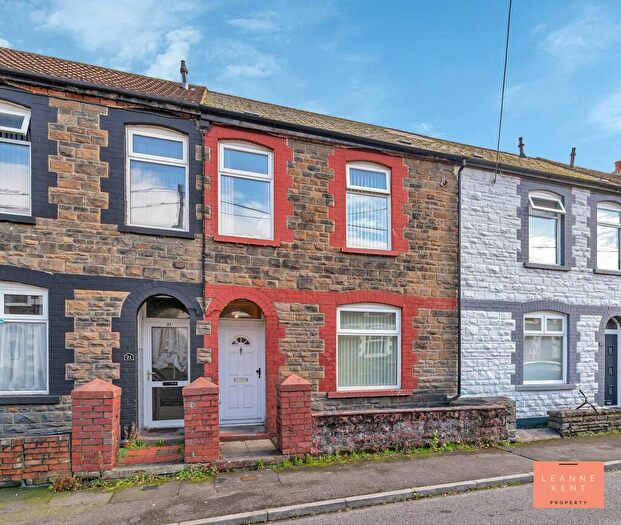
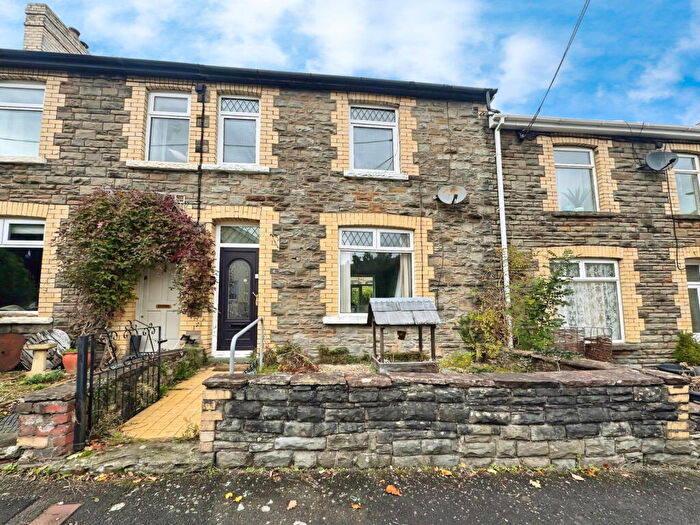
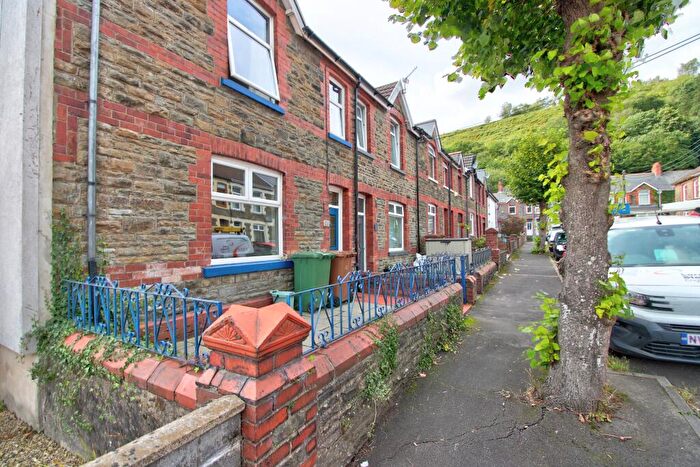
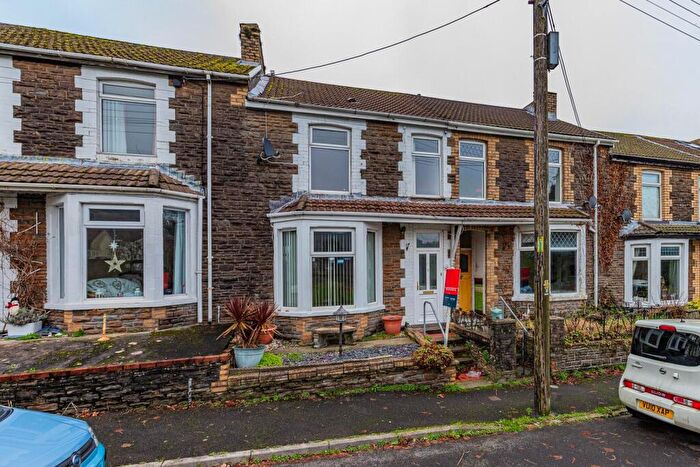
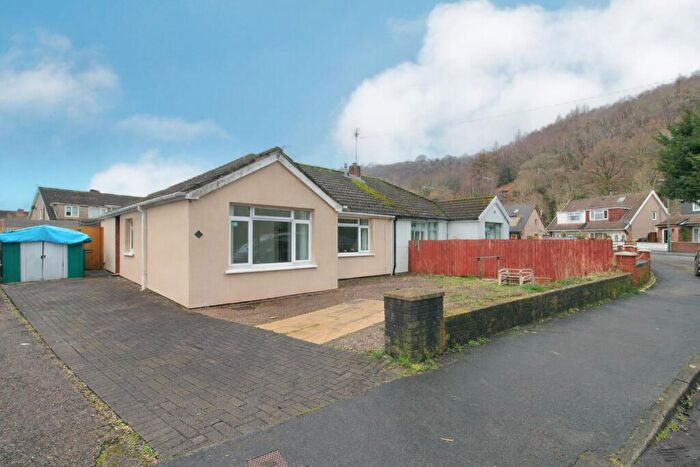
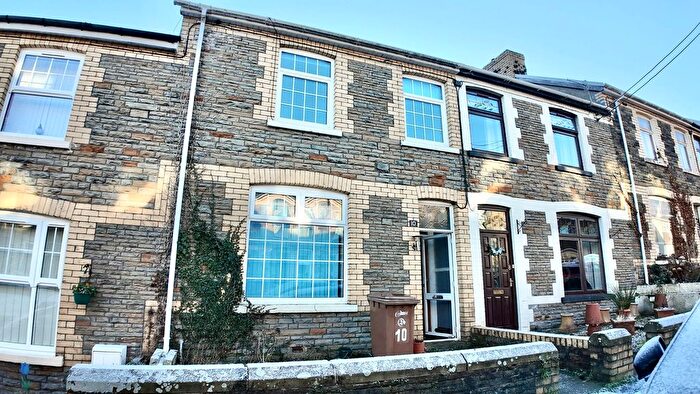
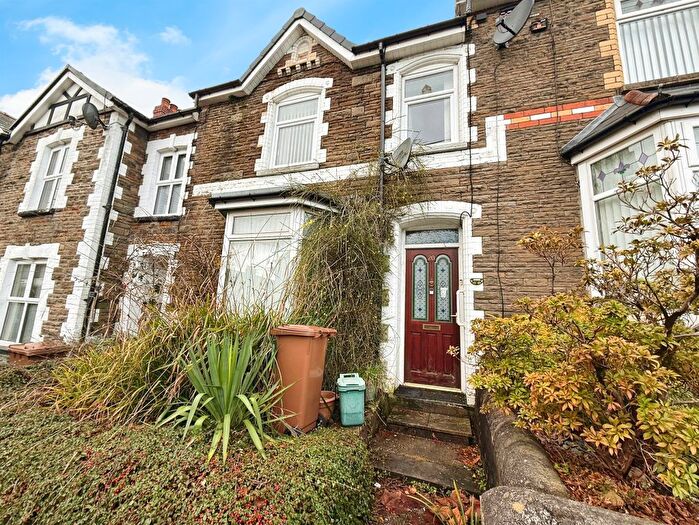
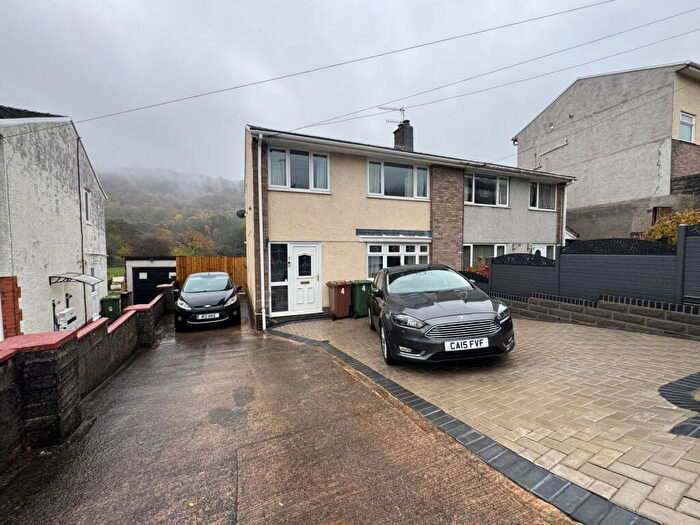
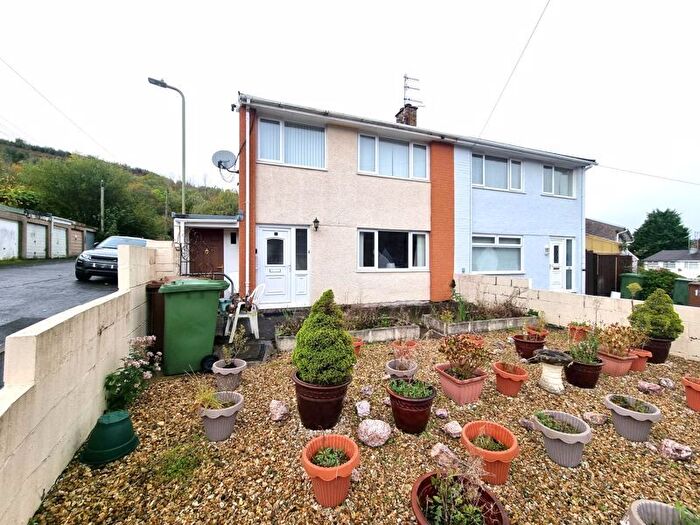
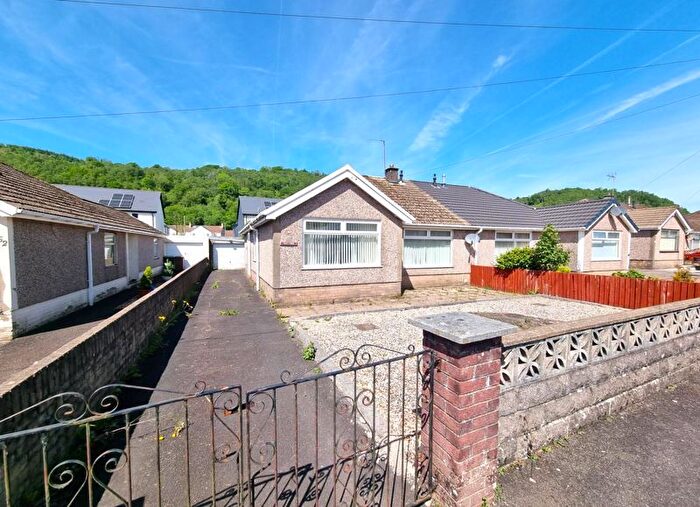
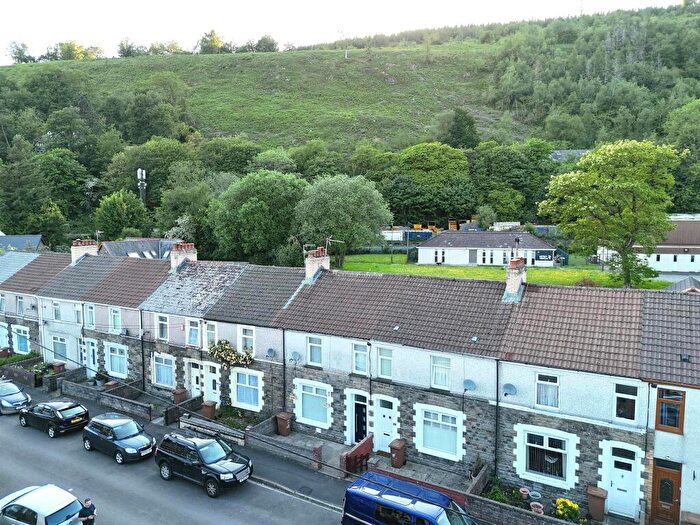
Houses for sale & to rent in Llanbradach, Caerphilly
House Prices in Llanbradach
Properties in Llanbradach have an average house price of £172,817.00 and had 167 Property Transactions within the last 3 years¹.
Llanbradach is an area in Caerphilly, Caerffili - Caerphilly with 1,856 households², where the most expensive property was sold for £545,000.00.
Properties for sale in Llanbradach
Previously listed properties in Llanbradach
Roads and Postcodes in Llanbradach
Navigate through our locations to find the location of your next house in Llanbradach, Caerphilly for sale or to rent.
| Streets | Postcodes |
|---|---|
| Bluebell View | CF83 3GU |
| Bryngwenol | CF83 3PR |
| Caerphilly Road | CF83 3HZ |
| Castle View | CF83 2NG |
| Central Street | CF83 2NJ CF83 2NL |
| Church Street | CF83 3LS |
| Clos Y Cedr | CF83 3RL |
| Coed Y Brain Court | CF83 3JT |
| Coed Y Brain Road | CF83 3JR CF83 3JS |
| Coed Y Pia | CF83 3PT |
| Colliery Road | CF83 3QQ CF83 3TA |
| Corbetts Lane | CF83 3HX |
| Craig Ysguthan | CF83 3PY |
| Dan Y Darren | CF83 3PU |
| De Winton Terrace | CF83 3JX CF83 3JY |
| Ffos Yr Hebog | CF83 3PS |
| Ffrwd Terrace | CF83 3NR |
| Garden Close | CF83 3NA |
| Garden Street | CF83 3LY CF83 3LZ CF83 3ND |
| Glen View Terrace | CF83 3NS |
| Glenview Terrace | CF83 3RX CF83 3TE |
| Glyn Bedw | CF83 3PE CF83 3PF CF83 3PG |
| Glyn Collen | CF83 3PP |
| Glyn Derwen | CF83 3PQ |
| Glyn Eiddew | CF83 3PH CF83 3PJ |
| Glyn Llwyfen | CF83 3PL CF83 3PN |
| Graddfa Industrial Estate | CF83 3QS |
| Graddfa Villas | CF83 3QR |
| Grove Street | CF83 3LN |
| Heol Beulah | CF83 3NF |
| Heol Pwll Y Pant | CF83 3SA |
| Heol Ty Gwyn | CF83 3PA CF83 3PB |
| High Street | CF83 3LP CF83 3LQ |
| Horace Terrace | CF83 3JU |
| James Street | CF83 3LJ |
| Lewis Terrace | CF83 3JZ |
| Llys Cambria | CF83 3NG |
| Lon Yr Afon | CF83 3NZ |
| Monmouth View | CF83 3LX |
| Morgan Street | CF83 3LW CF83 3QT |
| Mountain View | CF83 3HW |
| New Street | CF83 2NN |
| Oak Terrace | CF83 3LA |
| Oakfield Street | CF83 3NX |
| Pantglas | CF83 3PD CF83 3RQ |
| Park View | CF83 3LU |
| Pencerrig Street | CF83 3LR CF83 3SZ |
| Plas Cae Llwyd | CF83 3NE |
| Plasturtwyn Terrace | CF83 3NW |
| Rees Terrace | CF83 3NQ |
| Richmond Close | CF83 3JE |
| School Street | CF83 3LB CF83 3LD CF83 3LE CF83 3NB |
| Station Road | CF83 3LF |
| Telor Y Coed | CF83 3PW |
| The Avenue | CF83 3LL |
| Thomas Street | CF83 3LG |
| Tyn Y Graig Road | CF83 3LH |
| Tyn Y Graig Terrace | CF83 3LT |
| Victoria Street | CF83 3NY |
| Wilkins Terrace | CF83 2NH |
| Wingfield Crescent | CF83 3NU |
| Wingfield Terrace | CF83 3NT |
| Woodland Flats | CF83 3GN |
| CF83 3RW CF83 3SH |
Transport near Llanbradach
-
Llanbradach Station
-
Energlyn and Churchill Park Station
-
Aber Station
-
Ystrad Mynach Station
-
Caerphilly Station
-
Hengoed Station
- FAQ
- Price Paid By Year
- Property Type Price
Frequently asked questions about Llanbradach
What is the average price for a property for sale in Llanbradach?
The average price for a property for sale in Llanbradach is £172,817. This amount is 23% lower than the average price in Caerphilly. There are 244 property listings for sale in Llanbradach.
What streets have the most expensive properties for sale in Llanbradach?
The streets with the most expensive properties for sale in Llanbradach are Corbetts Lane at an average of £545,000, Heol Ty Gwyn at an average of £280,400 and Grove Street at an average of £254,500.
What streets have the most affordable properties for sale in Llanbradach?
The streets with the most affordable properties for sale in Llanbradach are Lewis Terrace at an average of £106,420, Oakfield Street at an average of £122,000 and Coed Y Brain Road at an average of £130,750.
Which train stations are available in or near Llanbradach?
Some of the train stations available in or near Llanbradach are Llanbradach, Energlyn and Churchill Park and Aber.
Property Price Paid in Llanbradach by Year
The average sold property price by year was:
| Year | Average Sold Price | Price Change |
Sold Properties
|
|---|---|---|---|
| 2025 | £169,021 | -7% |
47 Properties |
| 2024 | £181,695 | 7% |
54 Properties |
| 2023 | £168,257 | -3% |
66 Properties |
| 2022 | £173,407 | 12% |
69 Properties |
| 2021 | £152,890 | 8% |
76 Properties |
| 2020 | £141,369 | 6% |
48 Properties |
| 2019 | £133,334 | -8% |
73 Properties |
| 2018 | £144,031 | 4% |
72 Properties |
| 2017 | £138,060 | 12% |
74 Properties |
| 2016 | £121,882 | 5% |
57 Properties |
| 2015 | £115,739 | 1% |
54 Properties |
| 2014 | £115,047 | 3% |
52 Properties |
| 2013 | £112,000 | 3% |
50 Properties |
| 2012 | £108,397 | -3% |
34 Properties |
| 2011 | £111,431 | 1% |
45 Properties |
| 2010 | £110,054 | -23% |
35 Properties |
| 2009 | £134,963 | 3% |
37 Properties |
| 2008 | £130,273 | 9% |
56 Properties |
| 2007 | £118,109 | 9% |
98 Properties |
| 2006 | £107,637 | 9% |
104 Properties |
| 2005 | £98,216 | -0,1% |
61 Properties |
| 2004 | £98,323 | 27% |
93 Properties |
| 2003 | £71,917 | 18% |
92 Properties |
| 2002 | £58,808 | 15% |
109 Properties |
| 2001 | £49,900 | 9% |
92 Properties |
| 2000 | £45,590 | 6% |
97 Properties |
| 1999 | £42,661 | 5% |
88 Properties |
| 1998 | £40,316 | 5% |
77 Properties |
| 1997 | £38,403 | -2% |
95 Properties |
| 1996 | £39,000 | 1% |
59 Properties |
| 1995 | £38,563 | - |
61 Properties |
Property Price per Property Type in Llanbradach
Here you can find historic sold price data in order to help with your property search.
The average Property Paid Price for specific property types in the last three years are:
| Property Type | Average Sold Price | Sold Properties |
|---|---|---|
| Semi Detached House | £197,140.00 | 46 Semi Detached Houses |
| Detached House | £294,500.00 | 8 Detached Houses |
| Terraced House | £156,467.00 | 106 Terraced Houses |
| Flat | £121,500.00 | 7 Flats |

