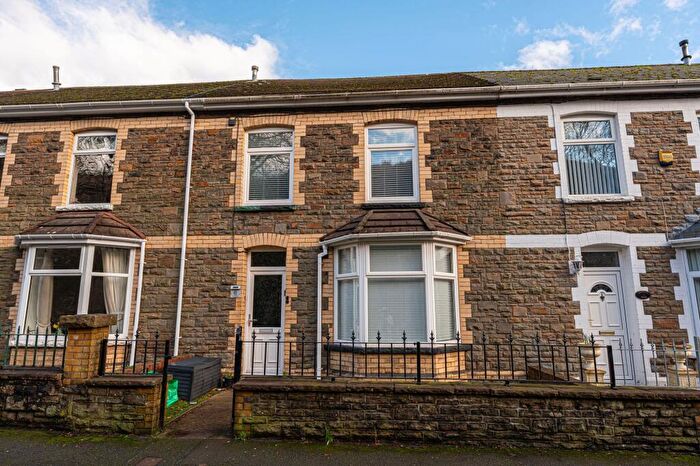
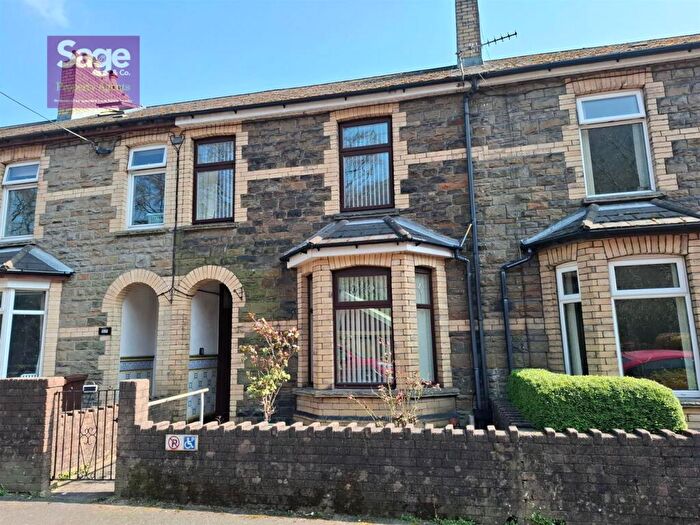
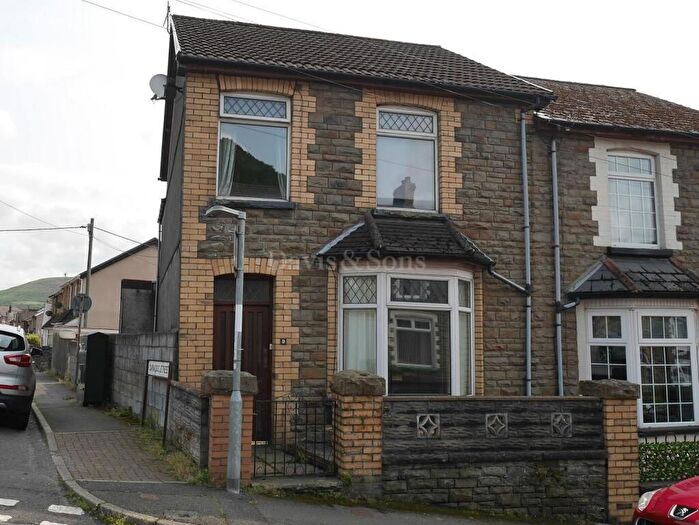
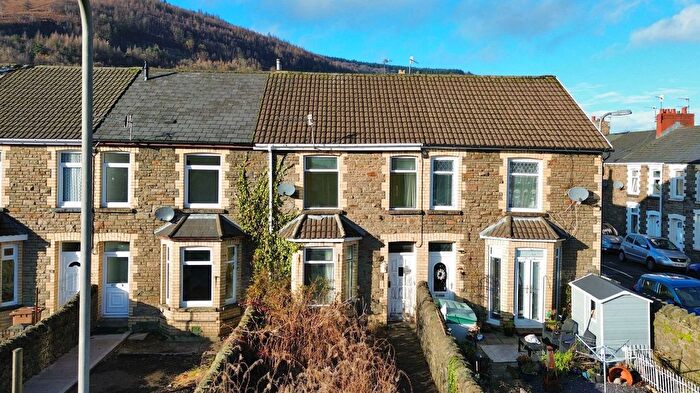
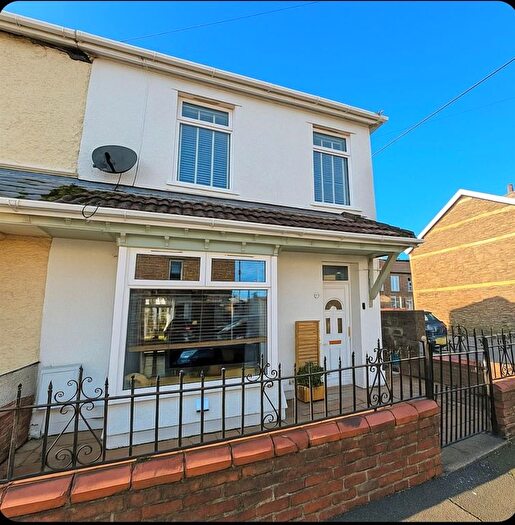
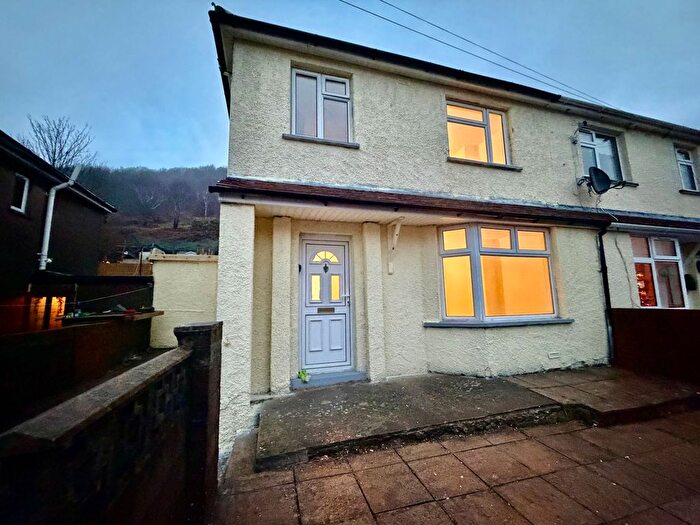
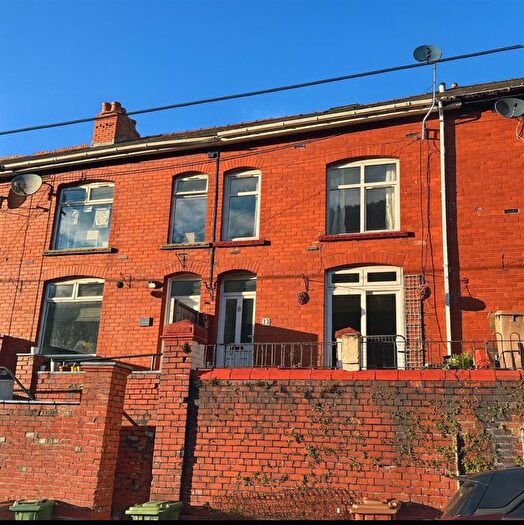
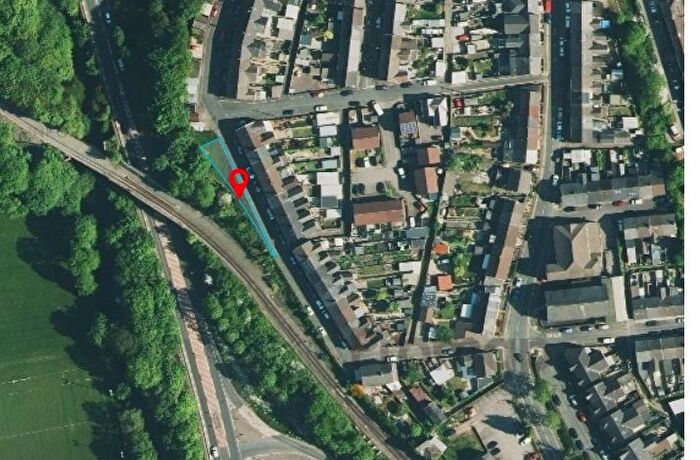
Houses for sale & to rent in Crosskeys, Newport
House Prices in Crosskeys
Properties in Crosskeys have an average house price of £162,762.00 and had 125 Property Transactions within the last 3 years¹.
Crosskeys is an area in Newport, Caerffili - Caerphilly with 1,536 households², where the most expensive property was sold for £470,000.00.
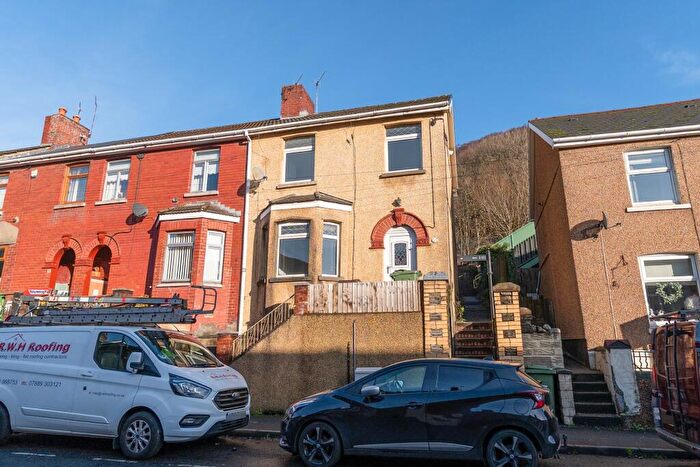
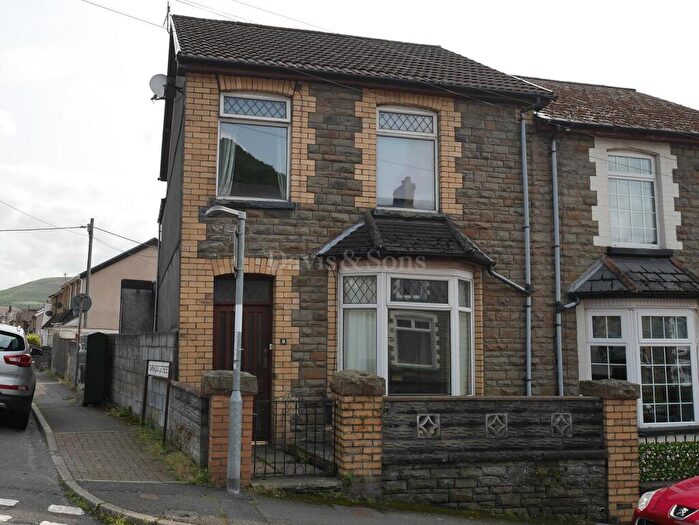
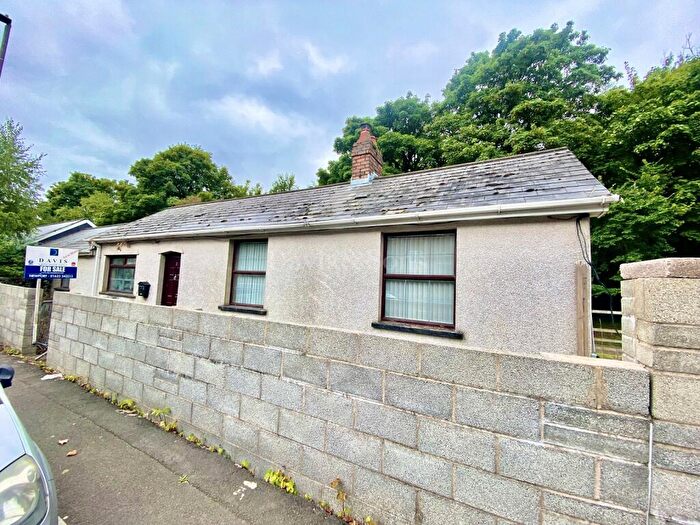
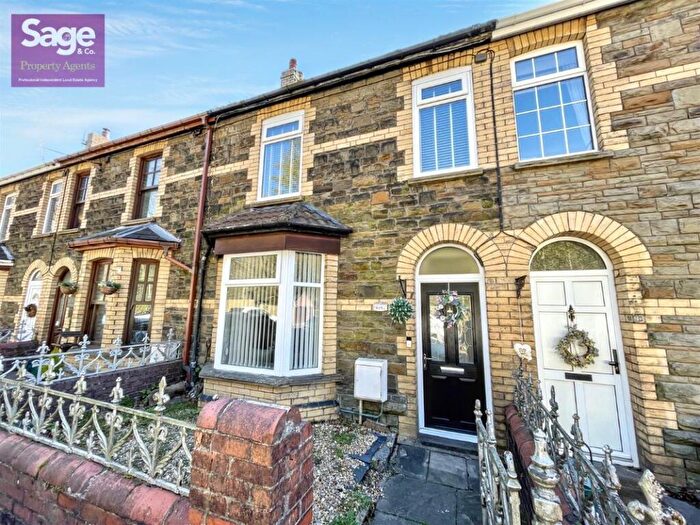
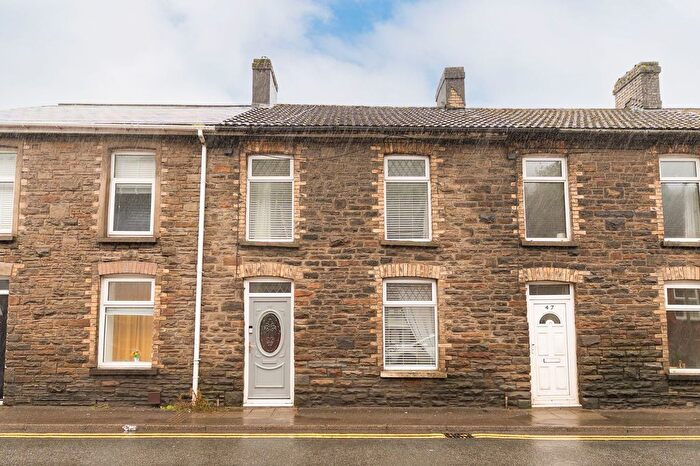
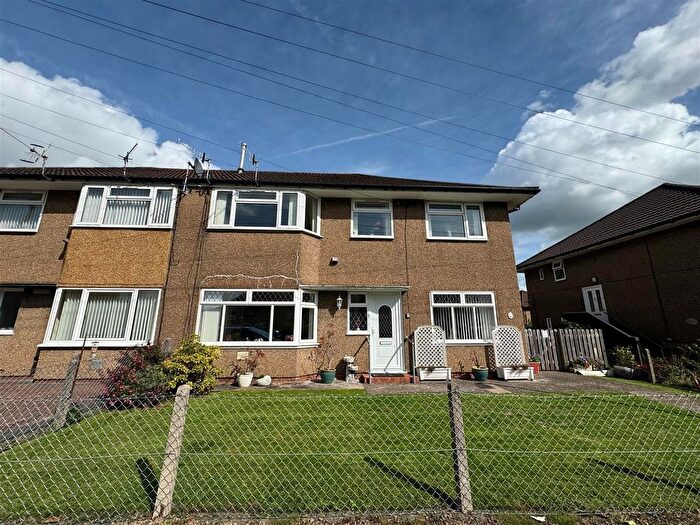
Properties for sale in Crosskeys
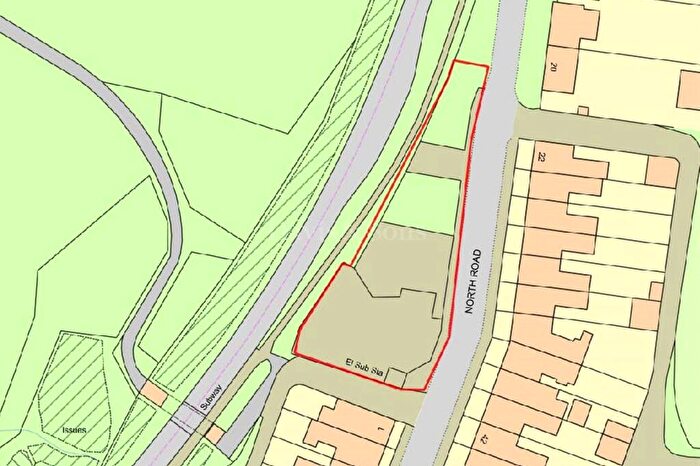
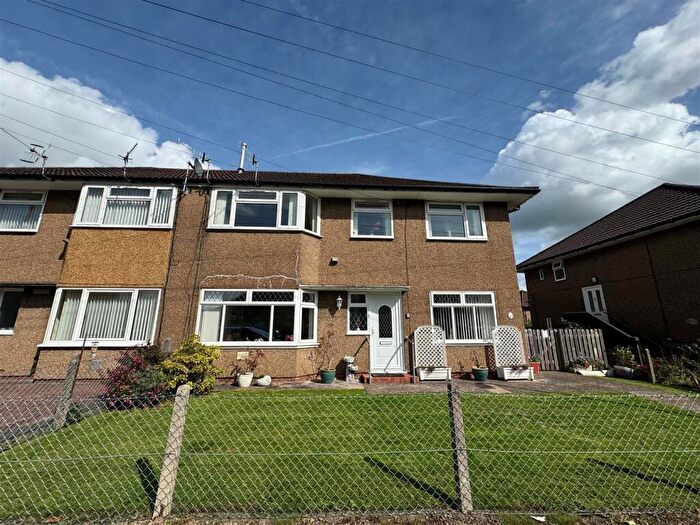
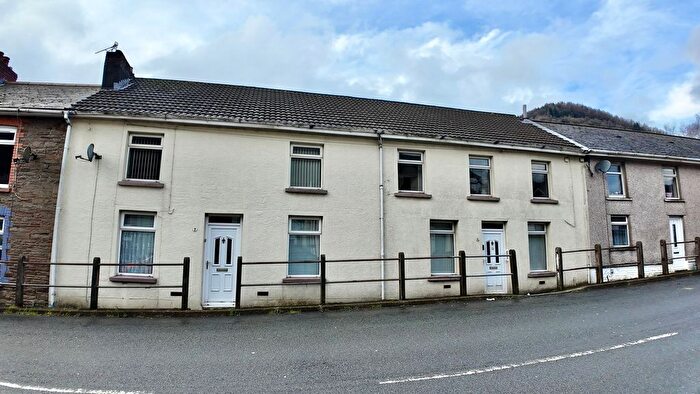
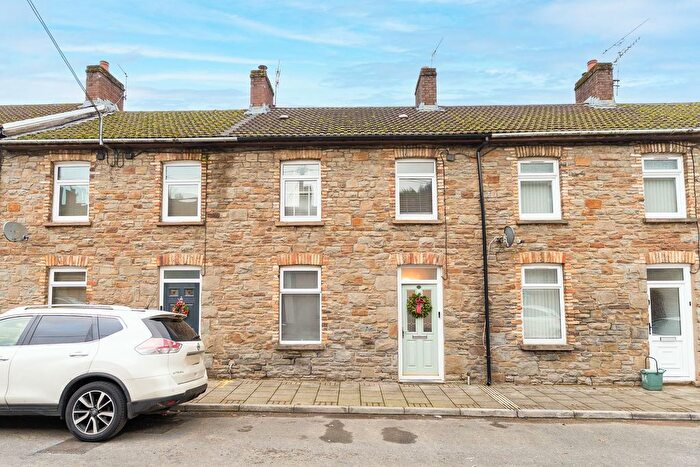
Previously listed properties in Crosskeys
Roads and Postcodes in Crosskeys
Navigate through our locations to find the location of your next house in Crosskeys, Newport for sale or to rent.
| Streets | Postcodes |
|---|---|
| Beecher Terrace | NP11 7FP |
| Blackvein Mountain Road | NP11 7PS |
| Bright Street | NP11 7PB |
| Carlton Place | NP11 7BW |
| Carlton Terrace | NP11 7BU |
| Castle Close | NP11 7FU |
| Castle Lane | NP11 7FT |
| Cobden Place | NP11 7PJ |
| Cobden Street | NP11 7PF |
| Coronation Place | NP11 7FY |
| Darran Road | NP11 6GY NP11 6GZ |
| Fields Park Terrace | NP11 7DA |
| Garden Suburbs | NP11 7GB NP11 7GD |
| Gardens View Close | NP11 7BL |
| Gelli Unig Place | NP11 7GG |
| Gelli Unig Road | NP11 7GE |
| Gelli Unig Terrace | NP11 7GF |
| Gladstone Street | NP11 7PA NP11 7PL NP11 7PN |
| Greenmeadow Drive | NP11 7DN |
| Halls Road Terrace | NP11 7FQ |
| Hawthorn Place | NP11 7DW |
| High Street | NP11 7FN NP11 7FR NP11 7BY |
| Hilary Rise | NP11 7GL |
| Hillview Bungalows | NP11 7DX |
| Medart Place | NP11 7DJ |
| Medart Street | NP11 7AG |
| Mount Pleasant Terrace | NP11 7GH |
| Newtown Industrial Estate | NP11 7PZ |
| North Road | NP11 7FS NP11 7FW NP11 7FZ NP11 7GA |
| Oak Terrace | NP11 7BX |
| Pandy View | NP11 7DL |
| Park Place | NP11 7DB |
| Park Street | NP11 7DF |
| Park View | NP11 7DD NP11 7DE |
| Pontywaun | NP11 7DY NP11 7GJ |
| Risca Road | NP11 7BT NP11 7DG NP11 7DH NP11 7ZA |
| Salisbury Street | NP11 7PD |
| Silver Street | NP11 7FX |
| St Catherines Court | NP11 7QB |
| St Johns Terrace | NP11 7RD |
| Tredegar Street | NP11 7PP NP11 7PQ NP11 7PW NP11 7PY NP11 7QA |
| Tredegar Terrace | NP11 7PR |
| Twyncarn Road | NP11 7DU |
| Waunfawr Gardens | NP11 7AJ NP11 7AL NP11 7AN |
| Waunfawr Park Road | NP11 7PH |
| Waunfawr Road | NP11 7PG |
| Waunfawr Terrace | NP11 7PE |
| Western Terrace | NP11 7BZ |
| Woodward Avenue | NP11 7BS |
| Woodward Road | NP11 7AT NP11 7BR |
| NP11 7FD |
Transport near Crosskeys
-
Crosskeys Station
-
Risca and Pontymister Station
-
Newbridge Station
-
Rogerstone Station
-
Hengoed Station
-
Llanbradach Station
-
Pye Corner Station
- FAQ
- Price Paid By Year
- Property Type Price
Frequently asked questions about Crosskeys
What is the average price for a property for sale in Crosskeys?
The average price for a property for sale in Crosskeys is £162,762. This amount is 6% lower than the average price in Newport. There are 248 property listings for sale in Crosskeys.
What streets have the most expensive properties for sale in Crosskeys?
The streets with the most expensive properties for sale in Crosskeys are Gardens View Close at an average of £419,375, Waunfawr Road at an average of £248,333 and Gelli Unig Place at an average of £234,000.
What streets have the most affordable properties for sale in Crosskeys?
The streets with the most affordable properties for sale in Crosskeys are Beecher Terrace at an average of £107,500, Woodward Road at an average of £112,400 and Oak Terrace at an average of £118,867.
Which train stations are available in or near Crosskeys?
Some of the train stations available in or near Crosskeys are Crosskeys, Risca and Pontymister and Newbridge.
Property Price Paid in Crosskeys by Year
The average sold property price by year was:
| Year | Average Sold Price | Price Change |
Sold Properties
|
|---|---|---|---|
| 2025 | £172,649 | 2% |
30 Properties |
| 2024 | £169,810 | 11% |
43 Properties |
| 2023 | £151,231 | -11% |
52 Properties |
| 2022 | £168,405 | 23% |
53 Properties |
| 2021 | £129,927 | 7% |
64 Properties |
| 2020 | £120,275 | -7% |
38 Properties |
| 2019 | £128,235 | -13% |
46 Properties |
| 2018 | £144,490 | 14% |
78 Properties |
| 2017 | £123,944 | 18% |
69 Properties |
| 2016 | £101,178 | 2% |
49 Properties |
| 2015 | £99,094 | -0,2% |
39 Properties |
| 2014 | £99,245 | 1% |
34 Properties |
| 2013 | £97,939 | 9% |
34 Properties |
| 2012 | £89,478 | -14% |
25 Properties |
| 2011 | £101,849 | 6% |
18 Properties |
| 2010 | £95,250 | 11% |
34 Properties |
| 2009 | £84,625 | -17% |
24 Properties |
| 2008 | £99,187 | -22% |
24 Properties |
| 2007 | £120,912 | 9% |
61 Properties |
| 2006 | £110,340 | 10% |
75 Properties |
| 2005 | £99,834 | 13% |
60 Properties |
| 2004 | £86,854 | 23% |
58 Properties |
| 2003 | £66,886 | 31% |
64 Properties |
| 2002 | £46,237 | 8% |
70 Properties |
| 2001 | £42,501 | -10% |
63 Properties |
| 2000 | £46,917 | 22% |
53 Properties |
| 1999 | £36,763 | -5% |
52 Properties |
| 1998 | £38,438 | 10% |
52 Properties |
| 1997 | £34,510 | -3% |
44 Properties |
| 1996 | £35,463 | 6% |
30 Properties |
| 1995 | £33,286 | - |
42 Properties |
Property Price per Property Type in Crosskeys
Here you can find historic sold price data in order to help with your property search.
The average Property Paid Price for specific property types in the last three years are:
| Property Type | Average Sold Price | Sold Properties |
|---|---|---|
| Semi Detached House | £207,500.00 | 16 Semi Detached Houses |
| Detached House | £327,785.00 | 7 Detached Houses |
| Terraced House | £147,390.00 | 93 Terraced Houses |
| Flat | £113,722.00 | 9 Flats |

