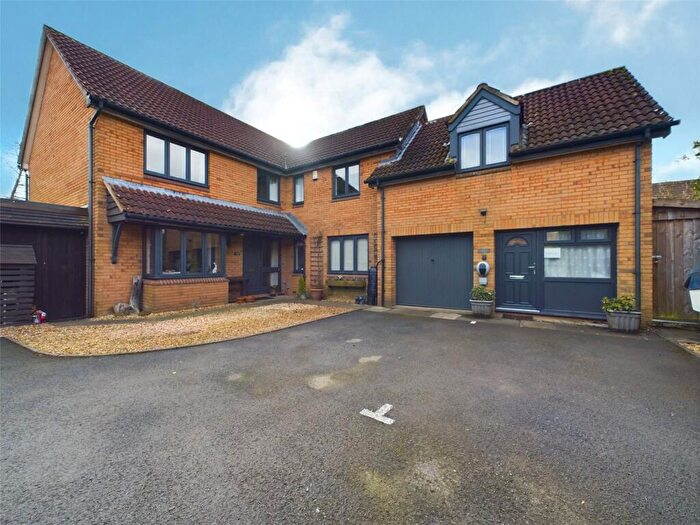
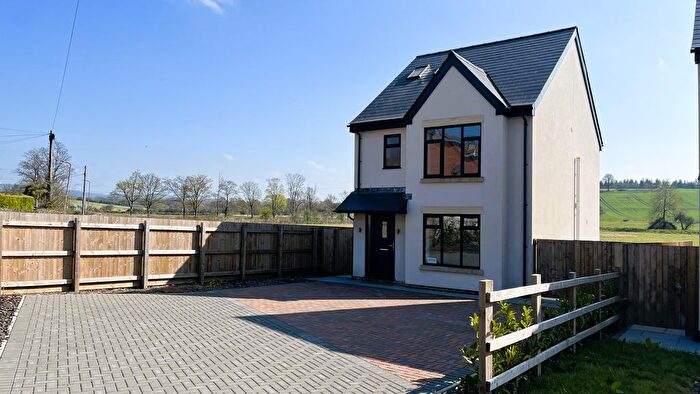
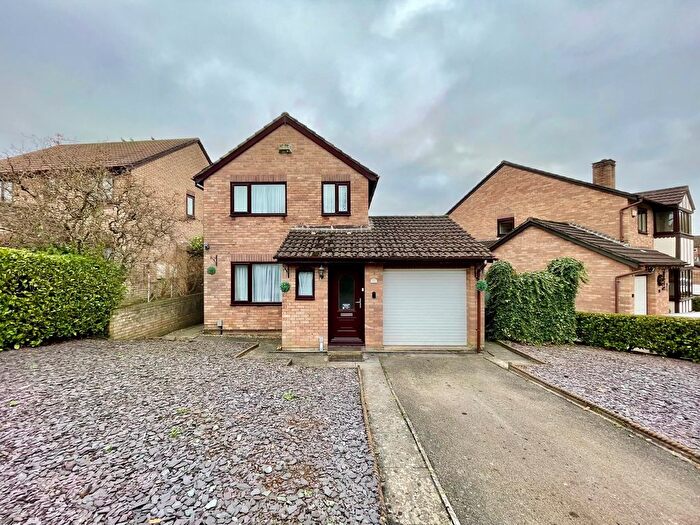
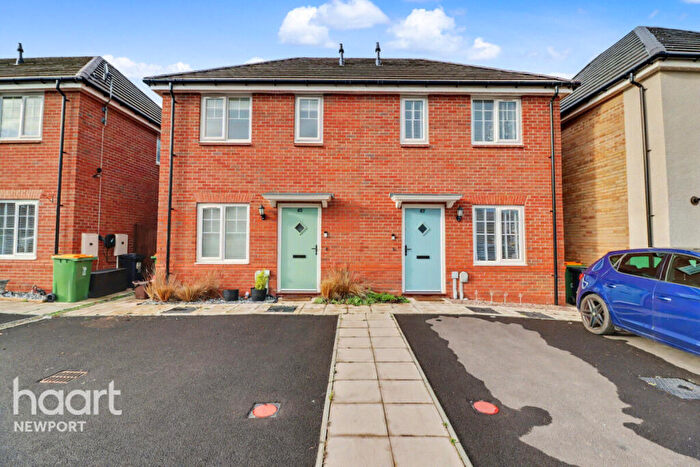
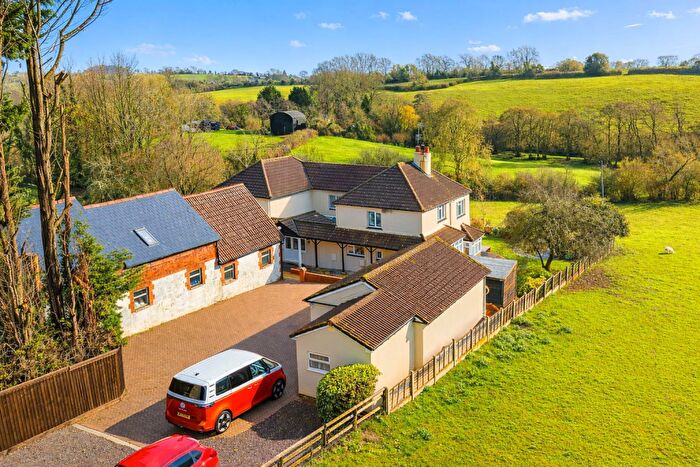
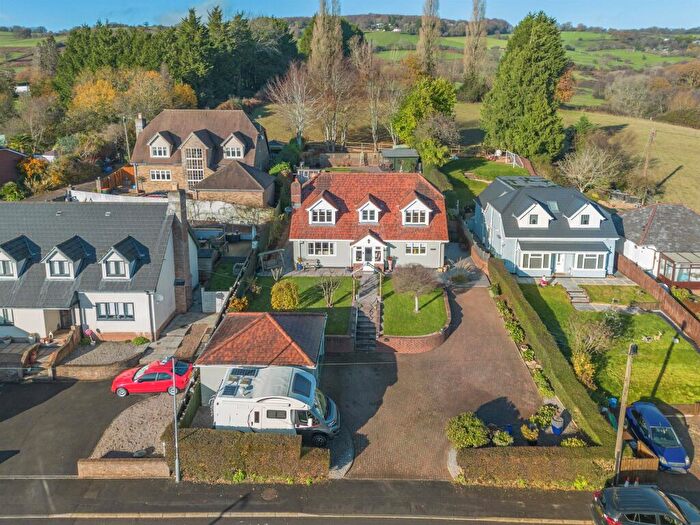
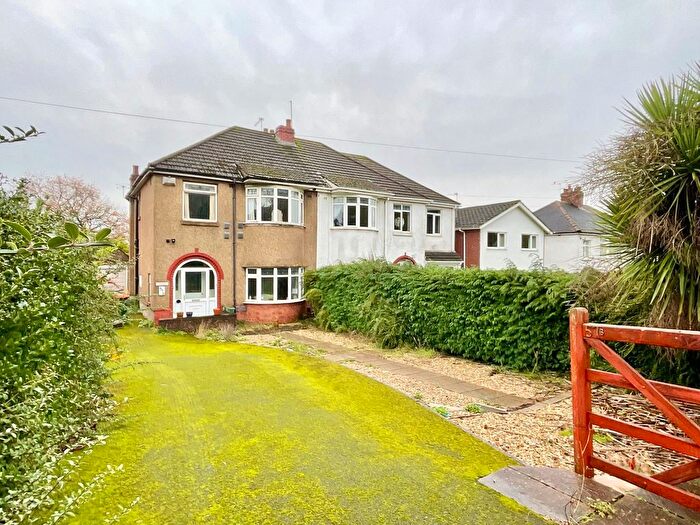
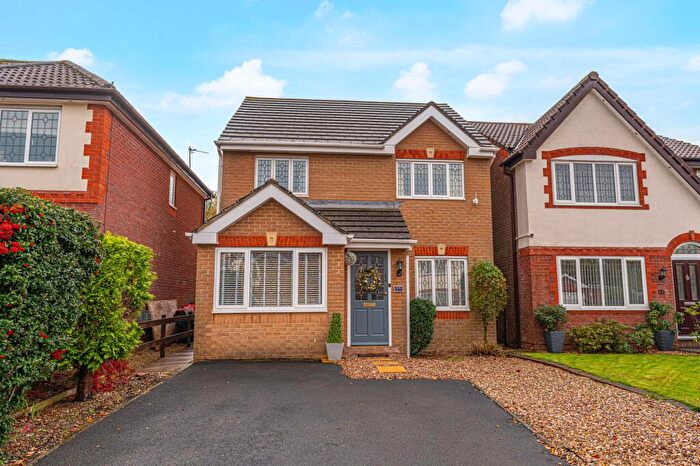
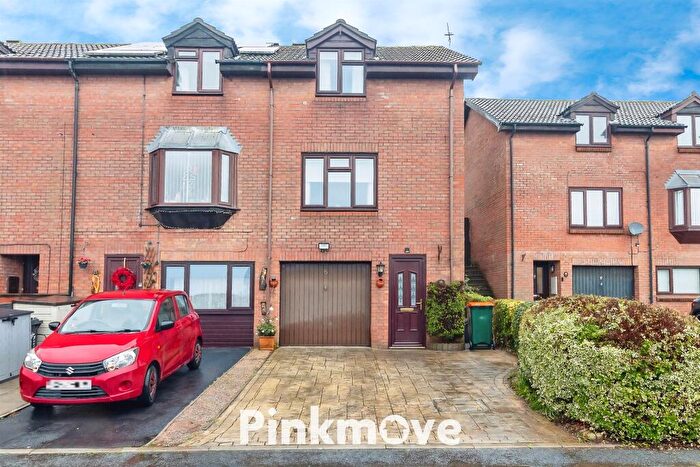
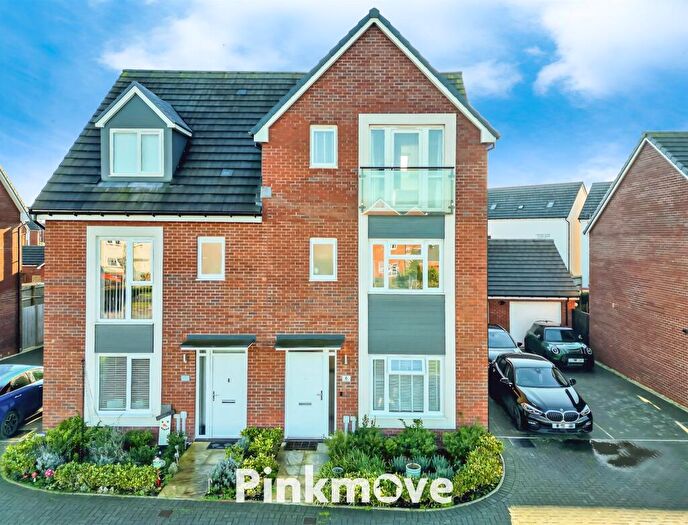
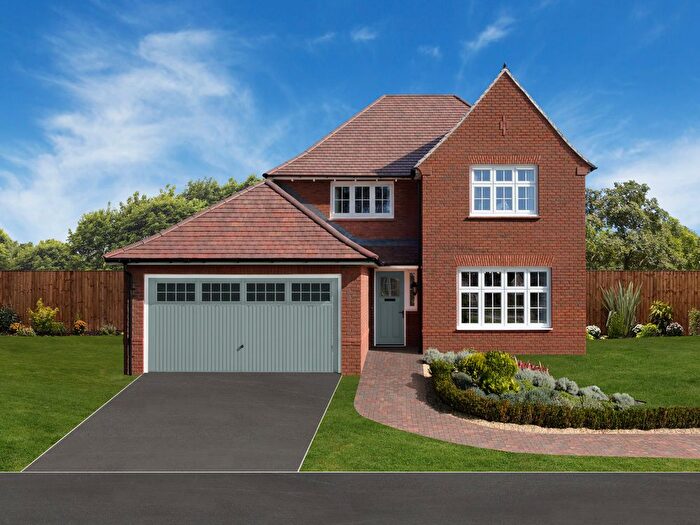
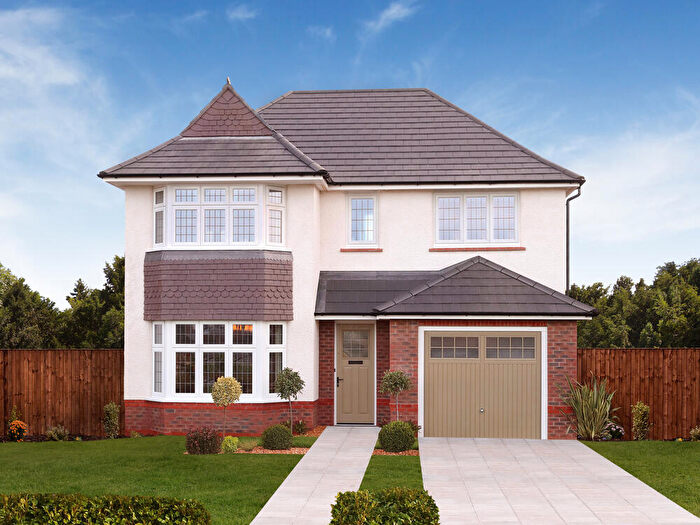
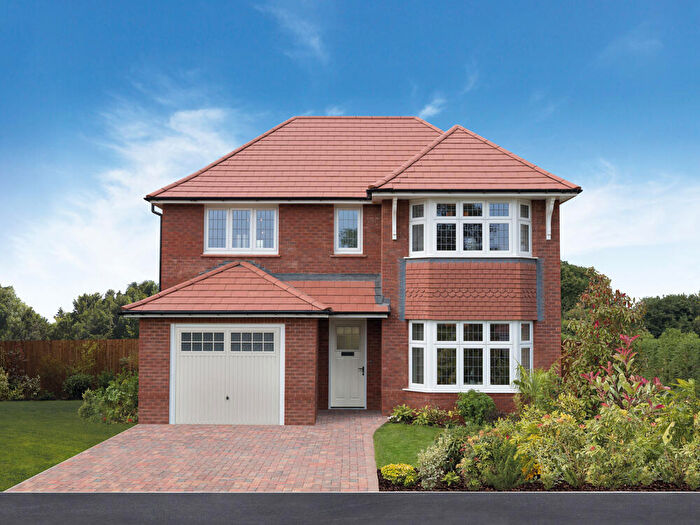
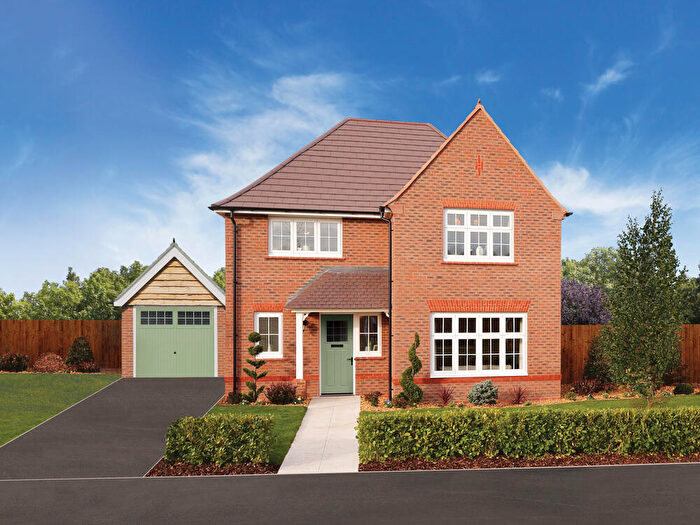
Houses for sale & to rent in Langstone, Newport
House Prices in Langstone
Properties in Langstone have an average house price of £433,962.00 and had 155 Property Transactions within the last 3 years¹.
Langstone is an area in Newport, Casnewydd - Newport with 1,275 households², where the most expensive property was sold for £840,000.00.
Properties for sale in Langstone
Roads and Postcodes in Langstone
Navigate through our locations to find the location of your next house in Langstone, Newport for sale or to rent.
| Streets | Postcodes |
|---|---|
| Arch Cottages | NP18 2JY |
| Bailey Crescent | NP18 2BL |
| Blossom Close | NP18 2LT |
| Blossom Grove | NP18 2QJ |
| Bramble Way | NP18 2AH |
| Bramley Close | NP18 2BJ |
| Caerlicyn Lane | NP18 2JZ |
| Carpenter Close | NP18 2LF |
| Catsash Road | NP18 2LZ |
| Chepstow Road | NP18 2JN NP18 2JP NP18 2JR NP18 2LU NP18 2LX NP18 2NX |
| Cherry Tree Close | NP18 2NL |
| Coed Y Caerau Lane | NP18 1JR |
| Cooper Close | NP18 2LD |
| Court Meadow | NP18 2NQ |
| Court View | NP18 2NN |
| Ellen Ridge Circle | NP18 2DF |
| Ford Farm Lane | NP18 2JH |
| Greenfields View | NP18 2AJ |
| Grenadier Drive | NP18 2BG |
| Hendrew Lane | NP18 2AB |
| Laburnum Gardens | NP18 2AL |
| Langstone Business Village | NP18 2LH |
| Langstone Cottages | NP18 2LY |
| Langstone Court Road | NP18 2NE NP18 2NG |
| Langstone Rise | NP18 2JQ |
| Magor Road | NP18 2JX |
| Maplewood | NP18 2AN NP18 2AP |
| Miller Close | NP18 2LE |
| Monolith Court | NP18 2BN |
| Old Chepstow Road | NP18 2ND |
| Old Langstone Court Road | NP18 2NF |
| Old Paddocks | NP18 2NP |
| Old Roman Road | NP18 2JU NP18 2JW |
| Park End | NP18 2NA NP18 2NB |
| Parkend Court | NP18 2NJ |
| Pencoed Lane | NP18 2ED |
| Pencoed View | NP18 2EG |
| Priory Crescent | NP18 2JF |
| Priory Drive | NP18 2JD |
| Priory Gardens | NP18 2JG |
| Priory Grove | NP18 2NY |
| Priory View | NP18 2NZ |
| Priory Way | NP18 2JE |
| Rosecroft Drive | NP18 2LQ |
| Russet Close | NP18 2BQ |
| Shepherd Drive | NP18 2LB |
| Silure Way | NP18 2NU |
| Spartan Close | NP18 2BH |
| St Curigs Garden | NP18 2BR NP18 2DE |
| Stockwood Close | NP18 2NW |
| Stockwood View | NP18 2NS |
| The Glen | NP18 2NR |
| The Nurseries | NP18 2NT |
| Tregarn Close | NP18 2JL |
| Tregarn Court | NP18 2JJ |
| Tregarn Road | NP18 2JS NP18 2JT |
| Usk Road | NP18 1DB |
| Watery Lane | NP18 2LA |
| NP18 1JQ NP18 1JS NP18 2AA NP18 2AD NP18 2AE NP18 2AF NP18 2AG NP18 2EB NP18 2GG NP18 2HJ NP18 2LJ |
Transport near Langstone
-
Newport (Gwent) Station
-
Severn Tunnel Junction Station
-
Cwmbran Station
-
Caldicot Station
-
Pye Corner Station
-
Rogerstone Station
-
Pontypool and New Inn Station
-
Risca and Pontymister Station
-
Crosskeys Station
- FAQ
- Price Paid By Year
- Property Type Price
Frequently asked questions about Langstone
What is the average price for a property for sale in Langstone?
The average price for a property for sale in Langstone is £433,962. This amount is 91% higher than the average price in Newport. There are 1,213 property listings for sale in Langstone.
What streets have the most expensive properties for sale in Langstone?
The streets with the most expensive properties for sale in Langstone are Pencoed Lane at an average of £632,500, Magor Road at an average of £631,000 and Miller Close at an average of £610,000.
What streets have the most affordable properties for sale in Langstone?
The streets with the most affordable properties for sale in Langstone are Spartan Close at an average of £269,750, Park End at an average of £280,457 and Bailey Crescent at an average of £303,075.
Which train stations are available in or near Langstone?
Some of the train stations available in or near Langstone are Newport (Gwent), Severn Tunnel Junction and Cwmbran.
Property Price Paid in Langstone by Year
The average sold property price by year was:
| Year | Average Sold Price | Price Change |
Sold Properties
|
|---|---|---|---|
| 2025 | £432,762 | 4% |
35 Properties |
| 2024 | £413,967 | -4% |
39 Properties |
| 2023 | £432,285 | -6% |
42 Properties |
| 2022 | £456,838 | 12% |
39 Properties |
| 2021 | £401,299 | 11% |
63 Properties |
| 2020 | £357,439 | -1% |
49 Properties |
| 2019 | £362,120 | 7% |
55 Properties |
| 2018 | £337,424 | 3% |
55 Properties |
| 2017 | £327,326 | 5% |
71 Properties |
| 2016 | £310,828 | 13% |
71 Properties |
| 2015 | £270,421 | 6% |
81 Properties |
| 2014 | £252,923 | -5% |
116 Properties |
| 2013 | £265,688 | -2% |
65 Properties |
| 2012 | £269,794 | -3% |
37 Properties |
| 2011 | £277,983 | 3% |
33 Properties |
| 2010 | £269,426 | 4% |
32 Properties |
| 2009 | £259,860 | -0,3% |
33 Properties |
| 2008 | £260,511 | -15% |
29 Properties |
| 2007 | £298,715 | 11% |
78 Properties |
| 2006 | £265,150 | -2% |
88 Properties |
| 2005 | £271,265 | 4% |
56 Properties |
| 2004 | £259,296 | 20% |
68 Properties |
| 2003 | £206,183 | 17% |
87 Properties |
| 2002 | £171,378 | 8% |
117 Properties |
| 2001 | £158,506 | 9% |
145 Properties |
| 2000 | £144,034 | 6% |
147 Properties |
| 1999 | £134,817 | 17% |
115 Properties |
| 1998 | £112,232 | -0,3% |
68 Properties |
| 1997 | £112,540 | 8% |
47 Properties |
| 1996 | £103,858 | 15% |
79 Properties |
| 1995 | £88,106 | - |
78 Properties |
Property Price per Property Type in Langstone
Here you can find historic sold price data in order to help with your property search.
The average Property Paid Price for specific property types in the last three years are:
| Property Type | Average Sold Price | Sold Properties |
|---|---|---|
| Semi Detached House | £287,920.00 | 19 Semi Detached Houses |
| Detached House | £458,725.00 | 133 Detached Houses |
| Terraced House | £261,066.00 | 3 Terraced Houses |

