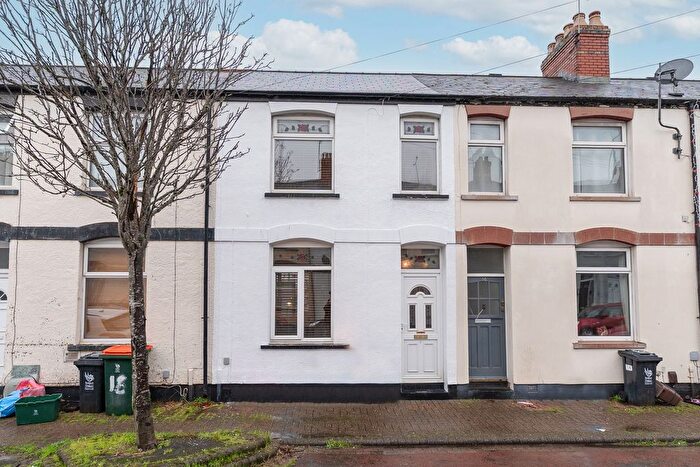
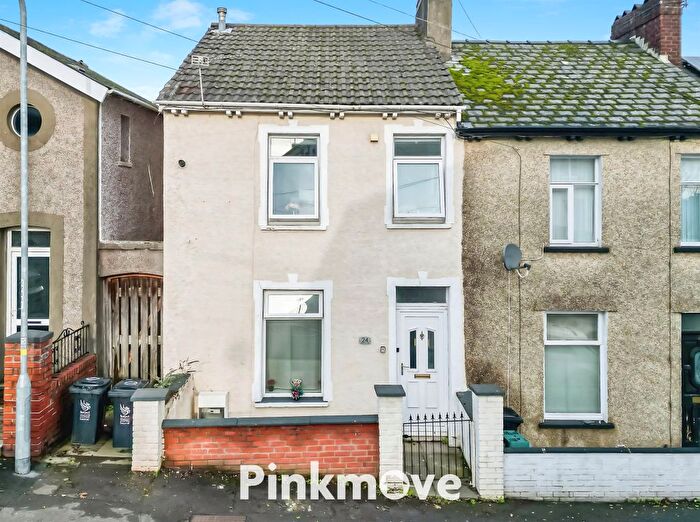
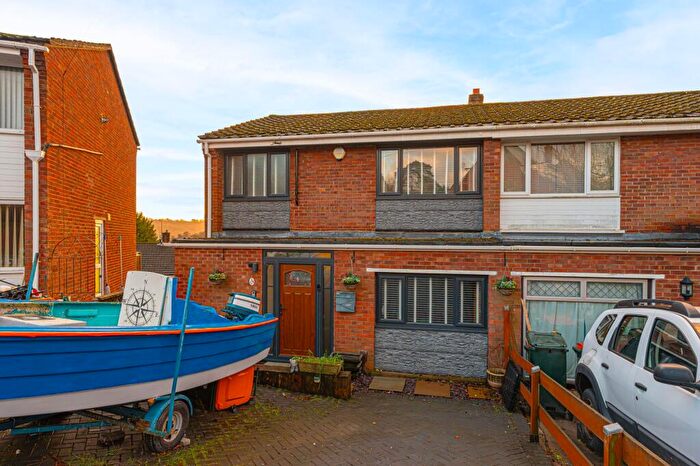
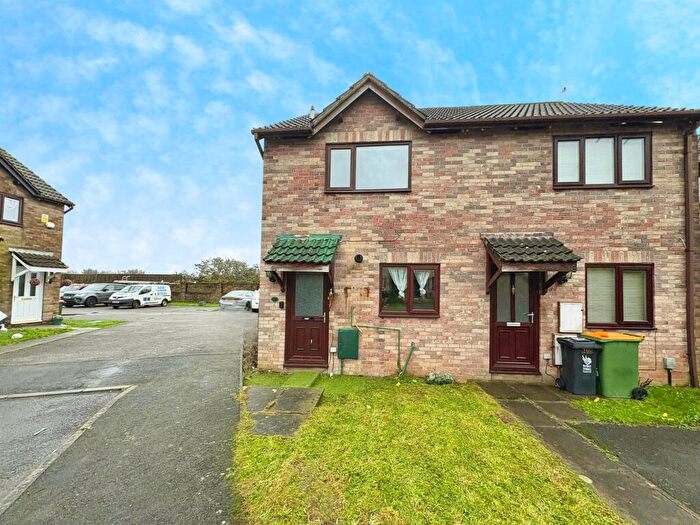
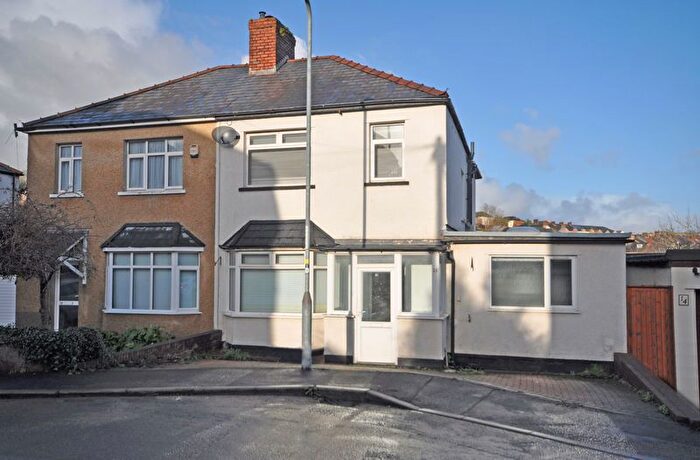
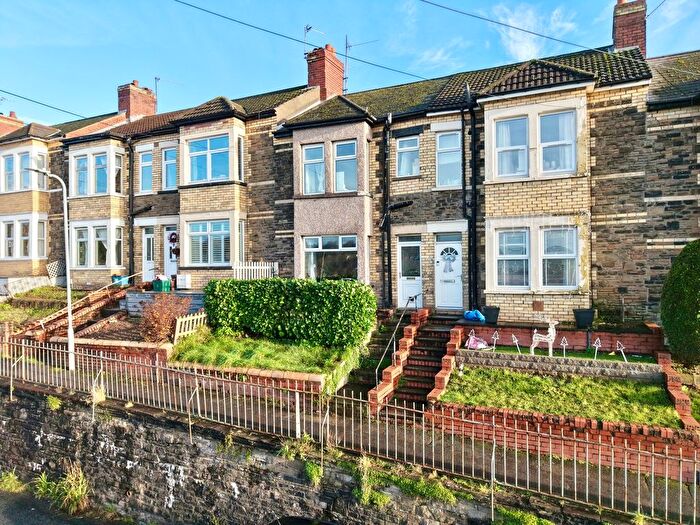
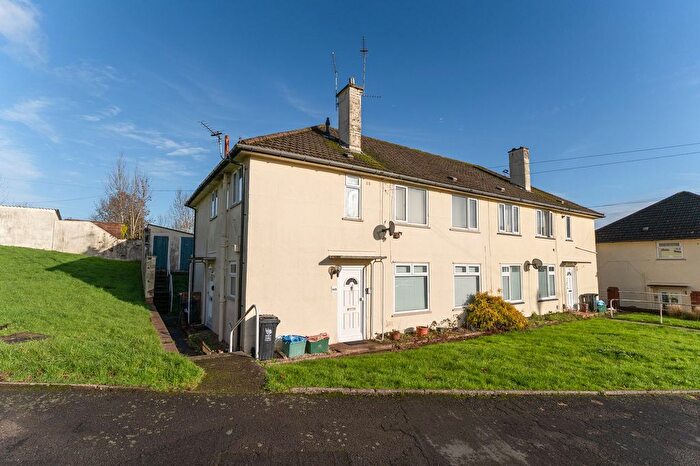
Houses for sale & to rent in Shaftesbury, Newport
House Prices in Shaftesbury
Properties in Shaftesbury have an average house price of £157,920.00 and had 294 Property Transactions within the last 3 years¹.
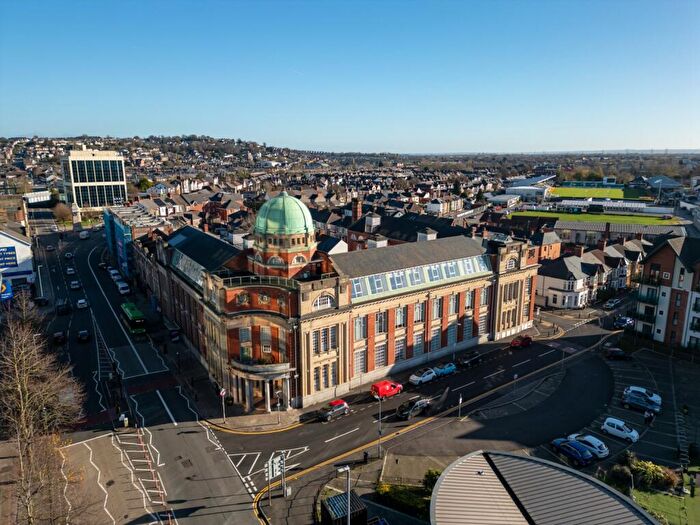
Shaftesbury is an area in Newport, Casnewydd - Newport with 2,366 households², where the most expensive property was sold for £621,500.00.
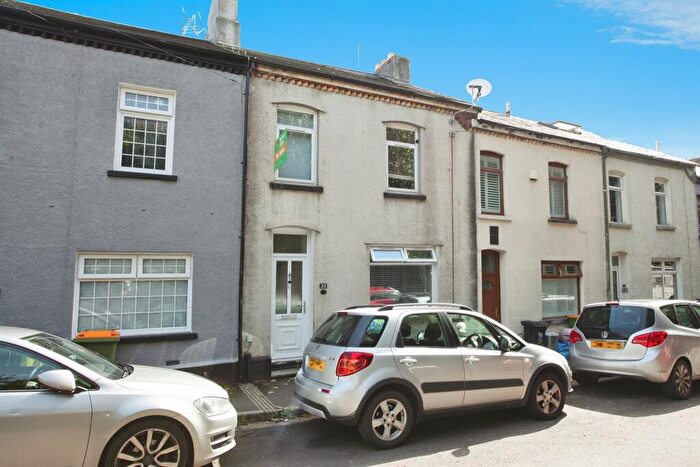
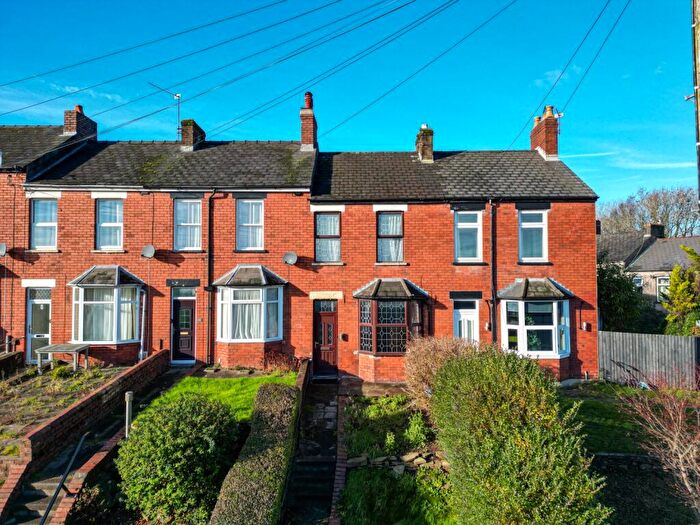
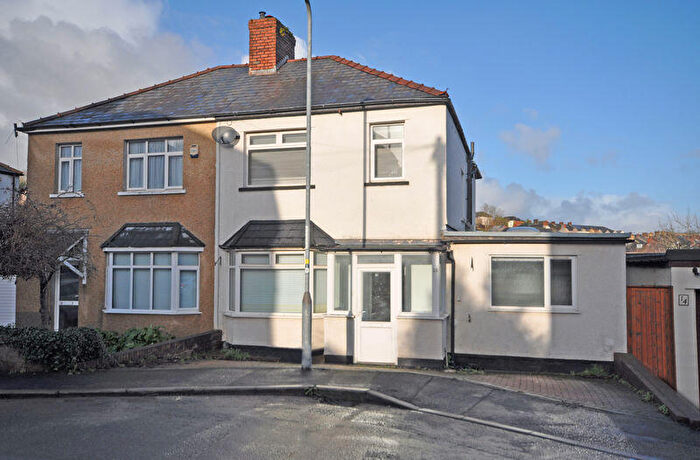
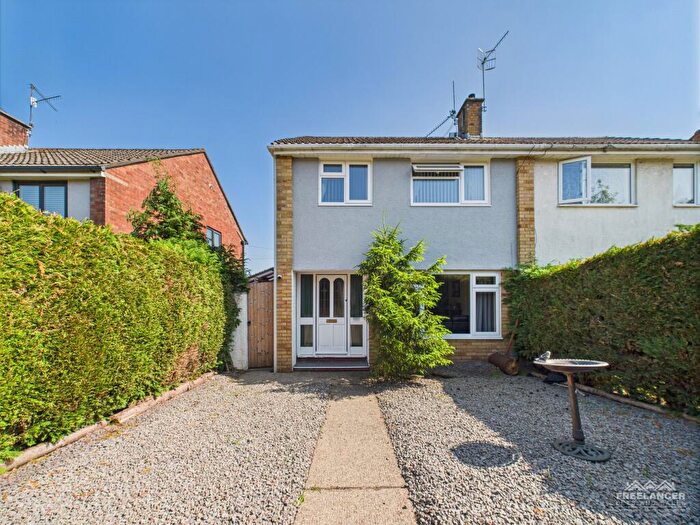
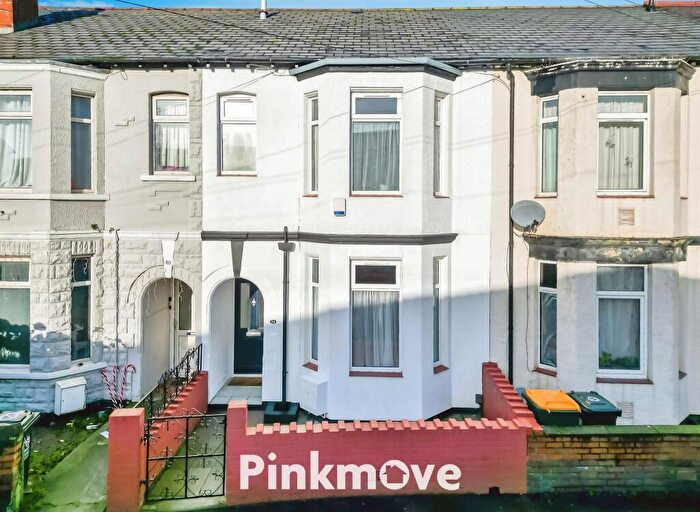
Properties for sale in Shaftesbury
Roads and Postcodes in Shaftesbury
Navigate through our locations to find the location of your next house in Shaftesbury, Newport for sale or to rent.
| Streets | Postcodes |
|---|---|
| Adelaide Street | NP20 5NF NP20 5RR |
| Agincourt Street | NP20 5JN |
| Ailesbury Street | NP20 5NB NP20 5ND |
| Albany Industrial Estate | NP20 5NS |
| Albany Street | NP20 5JL NP20 5NG NP20 5NJ |
| Albany Trading Estate | NP20 5NQ |
| Alderney Street | NP20 5NH |
| Aragon Street | NP20 5NN |
| Argyle Street | NP20 5NE |
| Aston Crescent | NP20 5RA NP20 5RB |
| Barrack Hill | NP20 5FR NP20 5FY NP20 5GN |
| Belvedere Terrace | NP20 5FQ |
| Blaen Y Pant Avenue | NP20 5PU |
| Blaen Y Pant Crescent | NP20 5PX NP20 5PY NP20 5QA NP20 5QB NP20 5QE |
| Blaen Y Pant Place | NP20 5PW |
| Bolton Street | NP20 5FP |
| Bryn Bevan | NP20 5QH NP20 5QJ NP20 5QL NP20 5QN |
| Brynglas Avenue | NP20 5LP NP20 5LQ NP20 5LR |
| Brynglas Close | NP20 5QT |
| Brynglas Court | NP20 5QR |
| Brynglas Crescent | NP20 5LT |
| Brynglas Drive | NP20 5QP NP20 5QQ NP20 5QS |
| Brynglas Road | NP20 5QF NP20 5QG NP20 5QU NP20 5QW NP20 5QX NP20 5QY NP20 5QZ NP20 5RY NP20 5RZ |
| Canal Street | NP20 5FL |
| Canterbury Close | NP20 5HQ |
| Chelston Place | NP20 5LX |
| Crindau Road | NP20 5LU |
| Dos Road | NP20 5FJ |
| Edwin Street | NP20 5JJ |
| Evans Street | NP20 5LD |
| Glassworks Cottages | NP20 5NL |
| Glastonbury Close | NP20 5HT |
| Goodrich Crescent | NP20 5PE NP20 5PF |
| Harlequin Court | NP20 5GL |
| Hopefield | NP20 5FN |
| Hopefield Court | NP20 5EZ |
| Hoskins Street | NP20 5JZ NP20 5LA |
| Jewell Lane | NP20 5QD |
| Lambert Close | NP20 5FX |
| Lambert Street | NP20 5FU NP20 5FW |
| Lyne Road | NP20 5JG |
| Malmesbury Close | NP20 5HS |
| Malpas Road | NP20 5PA NP20 5PB NP20 5PJ NP20 5PL NP20 5PN NP20 5PP NP20 5PS NP20 6GP NP20 6GQ NP20 6YN |
| Pant Road | NP20 5PQ NP20 5PR |
| Power Street | NP20 5FS |
| Prospect Street | NP20 5LY |
| Pugsley Street | NP20 5JU |
| Redland Street | NP20 5LS NP20 5LZ NP20 5NA |
| Ross Street | NP20 5RD NP20 5RE |
| Salisbury Close | NP20 5HW |
| Shaftesbury Walk | NP20 5HN |
| Shrewsbury Close | NP20 5HR |
| Spring Street | NP20 5LW |
| Sudbury Walk | NP20 5HU |
| Tetbury Close | NP20 5HX |
| Tewkesbury Walk | NP20 5HP |
| The Turnstiles | NP20 5NR |
| Upper Power Street | NP20 5FT |
| Walford Street | NP20 5PG NP20 5PH |
| Waterside Court | NP20 5NT |
| Wheeler Street | NP20 5LB |
| Wyndham Street | NP20 5JT |
Transport near Shaftesbury
- FAQ
- Price Paid By Year
- Property Type Price
Frequently asked questions about Shaftesbury
What is the average price for a property for sale in Shaftesbury?
The average price for a property for sale in Shaftesbury is £157,920. This amount is 31% lower than the average price in Newport. There are 1,380 property listings for sale in Shaftesbury.
What streets have the most expensive properties for sale in Shaftesbury?
The streets with the most expensive properties for sale in Shaftesbury are Canal Street at an average of £235,550, Blaen Y Pant Crescent at an average of £234,200 and Lambert Close at an average of £210,000.
What streets have the most affordable properties for sale in Shaftesbury?
The streets with the most affordable properties for sale in Shaftesbury are Shaftesbury Walk at an average of £84,000, Glastonbury Close at an average of £98,333 and Canterbury Close at an average of £100,000.
Which train stations are available in or near Shaftesbury?
Some of the train stations available in or near Shaftesbury are Newport (Gwent), Pye Corner and Rogerstone.
Property Price Paid in Shaftesbury by Year
The average sold property price by year was:
| Year | Average Sold Price | Price Change |
Sold Properties
|
|---|---|---|---|
| 2025 | £166,322 | 6% |
54 Properties |
| 2024 | £155,743 | 2% |
67 Properties |
| 2023 | £152,600 | -4% |
68 Properties |
| 2022 | £158,432 | 6% |
105 Properties |
| 2021 | £148,466 | 7% |
82 Properties |
| 2020 | £137,691 | 4% |
75 Properties |
| 2019 | £132,568 | 5% |
96 Properties |
| 2018 | £125,624 | 12% |
104 Properties |
| 2017 | £109,957 | 8% |
100 Properties |
| 2016 | £101,010 | 1% |
87 Properties |
| 2015 | £99,866 | -1% |
72 Properties |
| 2014 | £100,535 | 6% |
67 Properties |
| 2013 | £94,909 | -1% |
43 Properties |
| 2012 | £95,604 | -3% |
54 Properties |
| 2011 | £98,012 | -7% |
45 Properties |
| 2010 | £104,689 | 11% |
51 Properties |
| 2009 | £93,458 | -9% |
57 Properties |
| 2008 | £102,315 | -16% |
50 Properties |
| 2007 | £118,510 | 7% |
98 Properties |
| 2006 | £110,315 | 7% |
114 Properties |
| 2005 | £103,045 | 10% |
108 Properties |
| 2004 | £92,321 | 21% |
116 Properties |
| 2003 | £73,107 | 29% |
147 Properties |
| 2002 | £52,103 | 13% |
144 Properties |
| 2001 | £45,299 | 11% |
106 Properties |
| 2000 | £40,227 | 3% |
102 Properties |
| 1999 | £39,173 | -1% |
105 Properties |
| 1998 | £39,717 | 3% |
107 Properties |
| 1997 | £38,554 | 11% |
130 Properties |
| 1996 | £34,452 | 1% |
94 Properties |
| 1995 | £34,206 | - |
88 Properties |
Property Price per Property Type in Shaftesbury
Here you can find historic sold price data in order to help with your property search.
The average Property Paid Price for specific property types in the last three years are:
| Property Type | Average Sold Price | Sold Properties |
|---|---|---|
| Semi Detached House | £185,544.00 | 66 Semi Detached Houses |
| Detached House | £311,500.00 | 5 Detached Houses |
| Terraced House | £150,542.00 | 204 Terraced Houses |
| Flat | £100,763.00 | 19 Flats |

